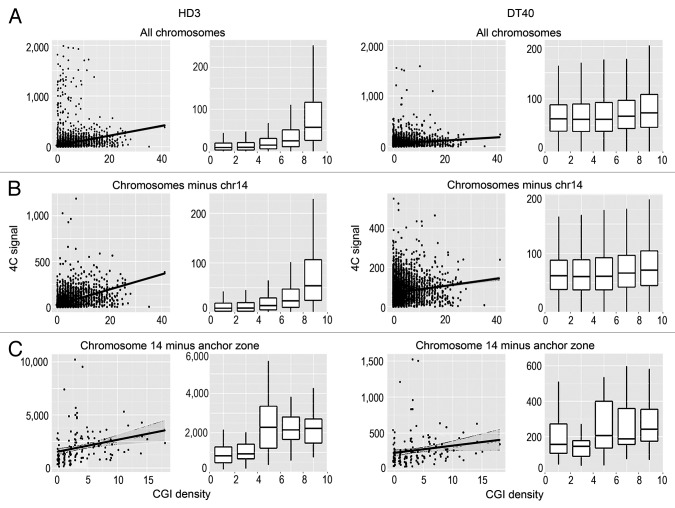
Figure 3. Scatterplots and box-plots showing the relationship between the NPRL3–4C signal (y-axis) in HD3 and DT40 cells and the density of CGIs (x-axis). The points represent non-overlapping 100 Kb genomic bins (see Materials and Methods). The region surrounding the anchor (NPRL3 anchor - chr14: 11500000–12800000) was not taken into account. The linear regression lines and the confidence intervals for the prediction are shown. The points at which the 4C signal was higher than 2000 reads per bin for all chromosomes and higher than 10 000 reads per bin for chromosome 14 were discarded. The box-plots contain the points split into 5 groups of equal size according to their x-value.

An official website of the United States government
Here's how you know
Official websites use .gov
A
.gov website belongs to an official
government organization in the United States.
Secure .gov websites use HTTPS
A lock (
) or https:// means you've safely
connected to the .gov website. Share sensitive
information only on official, secure websites.
