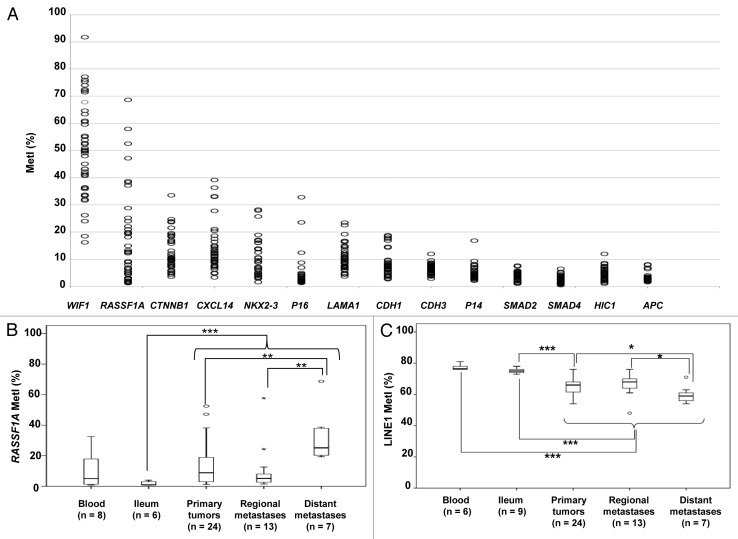
Figure 1. Results from quantifications of gene specific promoter methylation global methylation. (A) Scatter plot showing MetI values (mean methylation of the CpGs assessed in %) for each gene promoter in individual samples of SI-NETs. (B) Comparison of RASSF1A methylation in normal references, primary tumors and regional and distant metastases. (C) LINE1 global methylation in the different sample groups. Outliers are indicated by open circles and extremes by asterisks. P values for statistical comparisons between groups are indicated for suggestive P values ≤ 0.050 (*) or ≤ 0.01 (**), and for significant P-values ≤ 0.001 (***).

An official website of the United States government
Here's how you know
Official websites use .gov
A
.gov website belongs to an official
government organization in the United States.
Secure .gov websites use HTTPS
A lock (
) or https:// means you've safely
connected to the .gov website. Share sensitive
information only on official, secure websites.
