
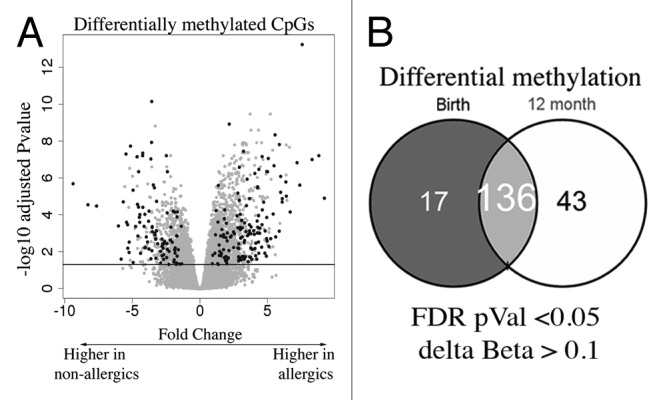
Figure 2. EWAS analysis test identifies differentially methylated CpG (A) Volcano plot depiction of the case vs. control test for differential methylation. DMP were identified by a combination of significance and effect size. The plot shows the log fold genome-wide methylation measurements (x-axis) by the –log P value (FDR-adjusted). Significant data points lie above the gray line. Those with an absolute delta Beta effect size of >10% are shown in black and were identified as candidates. (B) Venn diagram of DMPs detected at each age.