

Abstract
Due to the availability of ultra-high field scanners and novel imaging methods, high resolution, whole brain functional MR imaging (fMRI) has become increasingly feasible. However, it is common to use extensive spatial smoothing to account for inter-subject anatomical variation when pooling over subjects. This reduces the spatial details of group level functional activation considerably, even when the original data was acquired with high resolution. In our study we used an accelerated 3D EPI sequence at 7 Tesla to acquire whole brain fMRI data with an isotropic spatial resolution of 1.1 mm which shows clear gray/white matter contrast due to the stronger T1 weighting of 3D EPI. To benefit from the high spatial resolution on the group level, we develop a study specific, high resolution anatomical template which is facilitated by the good anatomical contrast that is present in the average functional EPI images. Different template generations with increasing accuracy were created by using a hierarchical linear and stepwise non-linear registration approach. As the template is based on the functional data themselves no additional co-registration step with the usual T1-weighted anatomical data is necessary which eliminates a potential source of misalignment. To test the improvement of functional localization and spatial details we performed a group level analysis of a finger tapping experiment in eight subjects. The most accurate template shows better spatial localization – such as a separation of somatosensory and motor areas and of single digit activation – compared to the simple linear registration. The number of activated voxels is increased by a factor of 1.2, 2.5, 3.1 for somatosensory, supplementary motor area, and dentate nucleus, respectively, for the functional contrast between left versus right hand. Similarly, the number of activated voxels is increased 1.4- and 2.4-fold for right little versus right index finger and left little versus left index finger, respectively. The Euclidian distance between the activation (center of gravity) of the respective fingers was found to be 13.90 mm using the most accurate template.
1 Introduction
Thanks to the availability of ultra-high field scanners (≥ 7 Tesla) a voxel size for functional MR imaging (fMRI) in the order of about 1 mm isotropic is technically possible and can thus reach that of anatomical data, while still offering sufficient functional information for analysis. To obtain a temporal resolution of about 3 seconds most studies have been performed on specific brain areas (Barry et al., 2011; De Martino et al., 2011; Harmer et al., 2012; Heidemann et al., 2012; Petridou et al., 2012; Polimeni et al., 2010; Sanchez-Panchuelo et al., 2010), but whole brain coverage can be achieved by using acceleration in the slice (Moeller et al., 2010) or second phase encoding (3D) direction (Poser et al., 2010).
One challenge that remains when acquiring very high resolution fMRI data is how to pool over subjects to obtain a group level interpretation, so results are often presented on single subject level. For certain studies it is feasible to first extract the parameter of interest on a single subject level and pool over subjects afterwards, as has been done in studies examining cortical layers (Koopmans et al., 2010; Koopmans et al., 2011; Polimeni et al., 2010; Siero et al., 2011), but in general neuroimaging researchers would like to perform a group level analysis in a common anatomical space, such as the MNI space (Collins et al., 1994), to improve sensitivity and to enable comparison between studies. A widely used model for fMRI group analysis is the MNI152 (Mazziotta et al., 2001; Mazziotta et al., 1995) which is based on 152 data sets from a normative young adult population. The MNI152 provides different contrasts (T1, T2, PD) and tissue maps (GM, WM, CSF) and has subsequently been incorporated into popular brain mapping software like SPM, FSL AIR or BRAINWAV (Evans et al., 2012). The MNI152 was built using linear image registration only and exhibits therefore a smoother anatomical definition as its next generation which was built using linear and non-linear image registration (Fonov et al., 2010). A more robust approach for group analysis (fMRI and anatomical data) is to use a cohort specific model which is built using the individual study data sets (Avants and Gee, 2004; Davis et al., 2004; Lorenzen et al., 2004). A cohort specific model has the advantage that it reduces the energy of the deformations required to map individual data to the template which reduces fitting errors and thus improves group analysis. There are several techniques to create such a study cohort specific model (Ashburner, 2007; Grabner et al., 2006; Guimond et al., 1999; Miller et al., 1997; Wilke et al., 2008).
In this study we present a new analysis pipeline for group studies to increase the benefit from high spatial resolution of functional MRI offered by the advanced imaging methods and the good anatomical contrast that is available at 7 Tesla. We propose to adapt a pre-existing multi-scale, non-linear normalization procedure to create a study-specific template (Grabner et al., 2006) which is created by using only the subjects’ functional MRI data, along the lines of (Huang et al., 2010), i.e. a direct normalization of T2*-weighted EPI images. To test if our approach is able to obtain activations on a small spatial scale we have performed a finger tapping study where small-scale activations are expected when a movement of single fingers is performed (Beisteiner et al., 2001; Kleinschmidt et al., 1997; Kurth et al., 1998; Martuzzi et al., 2012; Nelson and Chen, 2008; Schweizer et al., 2008; van Westen et al., 2004; Weibull et al., 2008). To illustrate the influence of different fitting parameters (template development), the group level evaluation was performed at various levels of template accuracy, up to the highest possible accuracy.
2 Materials and Methods
2.1 MRI measurements
A 3D EPI sequence with full partial Fourier and parallel imaging capability and flexible z-encoding order was used with the following settings: 1.1 mm isotropic resolution using a 32 channel head coil (Wiggins et al., 2006), TE = 23 ms, TRslice = 50 ms, TRvolume, 3D = 3.2 s, AF = 3 × 3, BW = 2000 Hz/px, matrix size 180 × 180, 104 or 112 (four subjects each) slices in an axial orientation, slice oversampling of 25%. Image reconstruction was performed entirely through the vendor-provided software which uses GRAPPA parallel imaging reconstruction, including EPI specific functionality for removing Nyquist ghosting and a zeroth order phase correction to minimize B0 fluctuation from scanner drift and subject breathing. Measurements were performed on 8 subjects on a 7 T scanner (Magnetom Siemens Healthcare, Erlangen, Germany) in accordance with local ethics regulations. The fMRI task consisted of stimulation blocks of four different finger tapping tasks with a length of 20 s each: tapping of the left index (LI), left little (LL), right index (RI), and right little (RL) finger, respectively, and each was repeated four times in a pseudo-randomized order embedded in short (10 s) resting (no movement) blocks (“_”) resulting in _LL-LI-RL-RI_LI-LL… etc. The total acquisition time for this functional run was 370 seconds.
2.2 Functional analysis
FMRI data processing was carried out using FEAT (FMRI Expert Analysis Tool) Version 5.98, part of FSL (FMRIB’s Software Library, www.fmrib.ox.ac.uk/fsl). The following pre-statistics processing was applied; motion correction using MCFLIRT (Jenkinson et al., 2002) non-brain removal using BET (Smith, 2002); spatial smoothing using a Gaussian kernel of 2 mm FWHM; grand-mean intensity normalization of the entire 4D dataset by a single multiplicative factor and highpass temporal filtering (Gaussian-weighted least-squares straight line fitting, with sigma = 20.0 s). First level time series statistical analysis was carried out using FILM (Woolrich et al., 2001) using contrasts for left hand versus right hand by contrasting the regressors of all fingers of the left versus the right hand (RH-LH) or by contrasting the regressors of individual fingers (e.g. LL-LI).
2.3 Template generation
The mean, motion corrected functional data obtained during the single subject analysis were used to create the symmetric EPI template. A symmetric template was chosen to avoid bias to one hemisphere (Evans et al., 1992). The template was created using the approach presented by (Grabner et al., 2006). This method involves a multi generation approach where both the original and the left-right flipped version of the individual data sets are iteratively registered to an evolving model. Image registration is performed linearly for the initial generation and nonlinearly for later generations (see Table 1). The evolving model is built after each iteration by averaging the current registration results. Cross-correlation is used as objective function and the regularization model is linear-elastic. After each iteration the accuracy of image registration is increased by changing the deformation grid resolution and image blurring. The used hierarchical registration parameters can be found in Table 1. These steps were performed until the original spatial resolution has been reached. A more detailed description about the method can be found in (Grabner et al., 2006). The development of the study specific EPI template is demonstrated in Figure 1 where an increase in accuracy can be seen as the template evolves. This study-specific template was then transformed into the MNI template space in order to conform with the Juelich Brain Atlas. All images registration steps were performed using the minc toolbox (http://packages.bic.mni.mcgill.ca).
Table 1.
Registration table used for the hierarchical matching. Note that linear registration is always performed before non-linear registration which minimizes non-linear deformation. It is also important that the number of iterations decrease as the deformation grid resolution increases which is based on the significantly increased computation time with a higher deformation grid resolution.
| Generation | Iterations / registration-deformation grid resolution/blur FWHM
|
|||||
|---|---|---|---|---|---|---|
| 1 (lina) | 2 (nlinb) | 3 (nlin) | 4 (nlin) | 5 (nlin) | 6 (nlin) | |
| 1 | 1 / - / - | |||||
| 2 | 1 / - / - | 10 / 16 / 8 | ||||
| 3 | 1 / - / - | 10 / 16 / 8 | 10 / 8 / 4 | |||
| 4 | 1 / - / - | 10 / 16 / 8 | 10 / 8 / 4 | 8 / 4 / 2 | ||
| 5 | 1 / - / - | 10 / 16 / 8 | 10 / 8 / 4 | 8 / 4 / 2 | 8 / 2 / 2 | |
| 6 | 1 / - / - | 10 / 16 / 8 | 10 / 8 / 4 | 8 / 4 / 2 | 8 / 2 / 2 | 5 / 1 / 0 |
Linear registration.
Non-linear registration.
Figure 1.

Group activation (N=8) of left hand (LH) versus right hand (RH) overlaid on the 1st generation (linear) template (first column); the 3rd generation (4 mm smoothing; second column); the 4th generation (2 mm smoothing; third column); and the most accurate template (6th generation). The rows represent (A to F) transverse slices at the height of the cerebellum, the subcortical structures, at the level of the ventricles and the motor area, as well as sagittal and coronal views of the motor area. The most accurate template (6th generation) shows a higher and spatially more specific activation pattern which enables a better separation of somatosensory and motor areas compared to less accurate templates. Z-maps are thresholded at a z-value of 5.3. Red color scale shows LH > RH, blue color scale shows RH > LH.
2.4 Group Based Functional analysis
Results from the single subject analysis were transformed into the symmetric template space using subsequently all intermediate and the final template as shown in Table 1. Second level analysis was performed using fixed effects statistical analysis as implemented in FLAME (FSL) on the various levels of template accuracy (Table 1).
3 Results
The background images in Figure 1 show several example slices of the population-specific EPI template for various generations (linear (1st), 3nd, 4th, and 6th generation). Note the clearer depiction of brain structures (central sulcus, deep brain nuclei) in the 6th generation template that are less well visible in the other generations. The activation maps in Figure 1 show the group activation (N=8) for left hand versus right hand using the respective templates. Slices that show activation in the motor cortex, SMA, the cerebellum (dentate nucleus), posterior putamen (center) and SMA (right) are depicted. The most accurate template (6th generation) shows a higher and spatially more specific activation pattern which enables a better separation of somatosensory and motor areas compared to less accurate templates. In Table 2 the number of activated voxels, average and maximum z-values in the ROIs defined by the activation clusters in the contrast LH vs. RH are given.
Table 2.
Number of activated voxels, average and maximum z-values in the ROIs defined by the activation clusters in the contrast left vs. right in the motor cortex, SMA, and the dentate nucleus (DN) for the different templates (Threshold level = 5).
| 1. Gen (lin) | 2. Gen | 6. Gen | |||||||
|---|---|---|---|---|---|---|---|---|---|
| act voxel | max | mean | act voxel | max | mean | act voxel | max | mean | |
| LH-RH Motor | 7520 | 18.83 | 8.5 | 6957 | 20.18 | 7.9 | 8870 | 22.73 | 9.57 |
| LH-RH SMA | 89 | 7.47 | 5.74 | 51 | 7.44 | 5.87 | 220 | 9.64 | 6.08 |
| LH-RH DN | 298 | 8.32 | 5.85 | 229 | 7.80 | 5.60 | 915 | 10.88 | 6.37 |
Comparison of the 6th generation template with the Juelich Brain Atlas (Desikan et al., 2006) shows that activation primarily occurs in the expected sensory-motor areas, i.e. Brodmann areas (BA) 4 and 6 (primary motor and premotor cortex, respectively) and BA 1, 2, and 3b (primary somatosensory cortex). For the number of activated voxels please refer to Table 3. The gap between these two areas as seen in Figure 1 corresponds to BA 3a.
Table 3.
Number of activated voxels per Brodmann areas for the two main contrasts (RH > LH and LH > RH) (Brodmann areas were taken from the Juelich Brain Atlas).
| GM regions | ROI Size [voxels] on left hemisphere for contrast (RH > LH) | ROI Size [voxels] on right hemisphere for contrast (LH > RH) |
|---|---|---|
| BA1: Primary somatosensory cortex | 2495 | 2047 |
| BA 2: Primary somatosensory cortex | 563 | 376 |
| BA3a: Primary somatosensory cortex | 277 | 42 |
| BA3b: Primary somatosensory cortex | 800 | 411 |
| OP1: Secondary somatosensory cortex/Parietal operculum | 54 | - |
| BA6: Premotor cortex | 4087 | 3318 |
| BA4: Primary motor cortex | 2076 | 1678 |
Figure 2 shows the group results of the LL vs. LI and RL vs. RI using the most accurate 6th generation template. A very clear separation of activation of the respective fingers is achieved which was not the case using the less accurate templates. Table 4 gives the number of activated voxels and maximum z-values in the ROIs defined by the activation clusters LL-LI, LI-LL, RL-RI, RI-RL in the motor cortex for the different templates. Furthermore the Euclidean distances between the voxels with the center of gravity for contrasts LL-LI and LI-LL, and RL-RI and RI-RL are reported.
Figure 2.
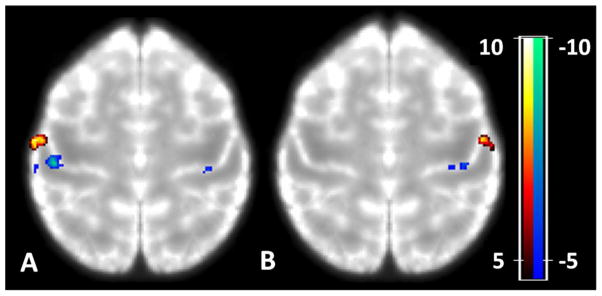
Group Activation (N=8) of left index (LI) finger versus left little (LL) finger (A); right index (RI) finger versus right little (RL) finger (B) overlaid on the most accurate template (6th generation). Note that between-fingers differences can be nicely localized on the posterior bank of the central sulcus (i.e. S1).
Table 4.
Number of activated voxels and maximum z-values in the ROIs defined by the activation clusters LL-LI, LI-LL, RL-RI, RI-RL in the motor cortex for the different templates (z-value > 5). Furthermore the Euclidean distances (ED) between the center of gravity for the contrasts LL-LI and LI-LL, as well as RL-RI and RI-RL are reported.
| 1. Gen (lin) | 2. Gen | 3. Gen | |||||||
|---|---|---|---|---|---|---|---|---|---|
| act voxel | max | ED/mm | act voxel | max | ED/mm | act voxel | max | ED/mm | |
| LL-LI | 490 | 10,60 | 15,70 | 120 | 7,70 | 16,20 | 675 | 11,10 | 13,60 |
| RL-RI | 395 | 9,55 | 18,70 | 332 | 9,77 | 16,50 | 408 | 9,51 | 13,40 |
| 4. Gen | 5. Gen | 6. Gen | |||||||
|---|---|---|---|---|---|---|---|---|---|
| act voxel | max | ED/mm | act voxel | max | ED/mm | act voxel | max | ED/mm | |
| LL-LI | 1003 | 12,00 | 13,50 | 1115 | 11,40 | 12,40 | 1172 | 10,90 | 12,70 |
| RL-RI | 537 | 11,40 | 13,50 | 516 | 10,10 | 13,30 | 540 | 11,20 | 13,90 |
4 Discussion and Conclusion
In our study we describe an image processing pipeline for group analysis of fMRI data. This pipeline uses the approach for study specific template generation presented by (Grabner et al., 2006). This technique was chosen because our group has the most experience with this technique and because of its robust performance in other projects (Grabner et al., 2013; Grabner et al., 2010). The image processing pipeline operates directly on the functional T2* weighted EPI data and thus eliminates the additional registration step towards the anatomical data. Importantly, the functional data can be used directly for normalization due to the detailed structural information available in the high spatial resolution T2*-weighted images and an increased T1 contrast between tissue types (GM/WM) due to the short TR when using the 3D EPI acquisition approach (Figure 1). We constructed a high resolution, symmetric, and study-specific template which can reduce registration errors compared to the case when using low resolution, general templates.
Using the highest resolution study-specific EPI-template, we were able to show significantly improved BOLD activation and clear separation of activated foci with high resolution fMRI data. On a group level somatosensory and motor activation in primary areas are well separated, as are left and right hemispheric activation in supplementary motor areas. Despite the relatively low number of subjects (N=8) we have found robust activations also for small scale activations in the somatosensory cortex on group level. As can been seen in Table 2 and Table 4, the number of activated voxels using linear registration only is higher compared to the first non-linear template (generation 2) thus one could consider to start with a 4 mm filter kernel for registration. Despite the lower number of activated voxels we suggest to start with an 8 mm kernel to reduce the risk of getting trapped into a local registration minimum, which is even more important when dealing with data showing a high anatomical variability.
The improved statistical sensitivity is based on both, the hierarchical, high resolution registration and the usage of a study-specific EPI template, but as T1-weighted anatomical data were not available in this study, we were not able to test the alternative approach of creating a study-specific template based on the anatomical T1-weighted data. Potentially, such an approach could be more accurate in areas with larger variability in anatomy due to the higher GM/WM contrast and the higher spatial resolution, but it would involve an additional registration step between EPI and T1-weighted anatomical data on a single subject level. This means an increased registration effortand, as such, a potential source of misregistration.
Our approach could be combined with surface-based registration (Goebel et al., 2006; Van Essen, 2005) to further improve sensitivity (Jo et al., 2007), but also more sophisticated boundary-based registration algorithms (Greve and Fischl, 2009) can be used to account for geometric distortions in the functional data. Using small smoothing kernels is also advantageous as it has been shown that spatial smoothing can lead to significant changes in localization of activation (Geissler et al., 2005; Weibull et al., 2008) and also clearly counteracts the efforts to acquire data with high spatial resolution (Mikl et al., 2008).
Despite the high acceleration factor in the phase encoding direction used here that mitigates EPI related geometric distortions by a factor of four compared to a non-accelerated acquisition, those are still present in the functional data used here and mapped into the study-specific template. However, in our approach they do not have to be mapped on non-distorted structural data when creating the template. This can be considered to be an advantage as it is very probable that the EPI distortions are more similar between subjects than compared to non-distorted structural data as areas with large susceptibility gradients (e.g. orbitofrontal, anterior and medio-temporal areas) are similar between subjects (Gholipour et al, 2008) as long as the same imaging parameters are used (i.e., echo time, gradient polarity). Eventually, when one needs to map the study-specific template to a common template, e.g. the MNI template, one can benefit from both the high resolution and the high SNR due to the averaging over the whole group which should lead to a better normalization. In our case, the registration of the study-specific template to the MNI template was performed using nine degrees of freedom and the mutual information option provided by the minc toolbox.
To summarize, we have proposed a robust and relatively straightforward normalization technique that is based solely on T2* weighted EPI images and is applicable to high-resolution fMRI data at 7 Tesla that improves the localization of activation on a group level.
Research Highlights.
take advantage of high spatial resolution on group level in fMRI using a high resolution, group specific template
the group specific template is based on the rich anatomical information of the average functional 3D EPI image at 7 Tesla
higher activation and more spatial details on group level using the most accurate template
Acknowledgments
We thank the NMR group at the A.A. Martinos Center, Department of Radiology, Massachusetts General Hospital for their generous support. L.L.W. acknowledges support from NIH, grant number: P41EB015896. J.R.P. acknowledges support from NIH-NIBIB, grant number: K01- EB011498.
Footnotes
Publisher's Disclaimer: This is a PDF file of an unedited manuscript that has been accepted for publication. As a service to our customers we are providing this early version of the manuscript. The manuscript will undergo copyediting, typesetting, and review of the resulting proof before it is published in its final citable fo rm. Please note that during the production process errors may be discovered which could affect the content, and all legal disclaimers that apply to the journal pertain.
References
- Ashburner J. A fast diffeomorphic image registration algorithm. Neuroimage. 2007;38:95–113. doi: 10.1016/j.neuroimage.2007.07.007. [DOI] [PubMed] [Google Scholar]
- Avants B, Gee JC. Geodesic estimation for large deformation anatomical shape averaging and interpolation. Neuroimage. 2004;23(Suppl 1):S139–150. doi: 10.1016/j.neuroimage.2004.07.010. [DOI] [PubMed] [Google Scholar]
- Barry RL, Strother SC, Gatenby JC, Gore JC. Data-driven optimization and evaluation of 2D EPI and 3D PRESTO for BOLD fMRI at 7 Tesla: I. Focal coverage. Neuroimage. 2011;55:1034–1043. doi: 10.1016/j.neuroimage.2010.12.086. [DOI] [PMC free article] [PubMed] [Google Scholar]
- Beisteiner R, Windischberger C, Lanzenberger R, Edward V, Cunnington R, Erdler M, Gartus A, Streibl B, Moser E, Deecke L. Finger somatotopy in human motor cortex. Neuroimage. 2001;13:1016–1026. doi: 10.1006/nimg.2000.0737. [DOI] [PubMed] [Google Scholar]
- Collins DL, Neelin P, Peters TM, Evans AC. Automatic 3D intersubject registration of MR volumetric data in standardized Talairach space. J Comput Assist Tomogr. 1994;18:192–205. [PubMed] [Google Scholar]
- Davis B, Lorenzen P, Joshi S. Large deformation minimum mean squared error template estimation for computational anatomy. Biomedical Imaging: Nano to Macro; 2004; IEEE International Symposium on; 2004. pp. 173–176. [Google Scholar]
- De Martino F, Esposito F, van de Moortele PF, Harel N, Formisano E, Goebel R, Ugurbil K, Yacoub E. Whole brain high-resolution functional imaging at ultra high magnetic fields: an application to the analysis of resting state networks. Neuroimage. 2011;57:1031–1044. doi: 10.1016/j.neuroimage.2011.05.008. [DOI] [PMC free article] [PubMed] [Google Scholar]
- Desikan RS, Segonne F, Fischl B, Quinn BT, Dickerson BC, Blacker D, Buckner RL, Dale AM, Maguire RP, Hyman BT, Albert MS, Killiany RJ. An automated labeling system for subdividing the human cerebral cortex on MRI scans into gyral based regions of interest. Neuroimage. 2006;31:968–980. doi: 10.1016/j.neuroimage.2006.01.021. [DOI] [PubMed] [Google Scholar]
- Evans AC, Collins DL, Milner B. An MRI-based stereotaxic atlas from 250 young normal subjects. Society Neuroscience, Abstracts. 1992;18:408. [Google Scholar]
- Evans AC, Janke AL, Collins DL, Baillet S. Brain templates and atlases. Neuroimage. 2012;62:911–922. doi: 10.1016/j.neuroimage.2012.01.024. [DOI] [PubMed] [Google Scholar]
- Fonov V, Evans AC, Botteron K, Almli CR, McKinstry RC, Collins DL. Unbiased average age-appropriate atlases for pediatric studies. Neuroimage. 2010;54:313–327. doi: 10.1016/j.neuroimage.2010.07.033. [DOI] [PMC free article] [PubMed] [Google Scholar]
- Geissler A, Lanzenberger R, Barth M, Tahamtan AR, Milakara D, Gartus A, Beisteiner R. Influence of fMRI smoothing procedures on replicability of fine scale motor localization. Neuroimage. 2005;24:323–331. doi: 10.1016/j.neuroimage.2004.08.042. [DOI] [PubMed] [Google Scholar]
- Gholipour A, Kehtarnavaz N, Gopinath K, Briggs R, Panahi I. Average field map image template for Echo-Planar image analysis. Conf Proc IEEE Eng Med Biol Soc.; 2008; 2008. pp. 94–7. [DOI] [PubMed] [Google Scholar]
- Goebel R, Esposito F, Formisano E. Analysis of functional image analysis contest (FIAC) data with brainvoyager QX: From single-subject to cortically aligned group general linear model analysis and self-organizing group independent component analysis. Hum Brain Mapp. 2006;27:392–401. doi: 10.1002/hbm.20249. [DOI] [PMC free article] [PubMed] [Google Scholar]
- Grabner G, Dal-Bianco A, Hametner S, Lassmann H, Trattnig S. Group specific vein-atlasing: An application for analyzing the venous system under normal and multiple sclerosis conditions. J Magn Reson Imaging. 2013 doi: 10.1002/jmri.24393. [DOI] [PubMed] [Google Scholar]
- Grabner G, Haubenberger D, Rath J, Beisteiner R, Auff E, Trattnig S, Barth M. A population-specific symmetric phase model to automatically analyze susceptibility-weighted imaging (SWI) phase shifts and phase symmetry in the human brain. J Magn Reson Imaging. 2010;31:215–220. doi: 10.1002/jmri.22013. [DOI] [PubMed] [Google Scholar]
- Grabner G, Janke AL, Budge MM, Smith D, Pruessner J, Collins DL. Symmetric atlasing and model based segmentation: an application to the hippocampus in older adults. Med Image Comput Comput Assist Interv Int Conf Med Image Comput Comput Assist Interv. 2006;9:58–66. doi: 10.1007/11866763_8. [DOI] [PubMed] [Google Scholar]
- Greve DN, Fischl B. Accurate and robust brain image alignment using boundary-based registration. Neuroimage. 2009;48:63–72. doi: 10.1016/j.neuroimage.2009.06.060. [DOI] [PMC free article] [PubMed] [Google Scholar]
- Guimond A, Meunier JPT. Average brain models: A Convergence Study. Average brain models: A Convergence Study. 1999;77:192–210. [Google Scholar]
- Harmer J, Sanchez-Panchuelo RM, Bowtell R, Francis ST. Spatial location and strength of BOLD activation in high-spatial-resolution fMRI of the motor cortex: a comparison of spin echo and gradient echo fMRI at 7 T. NMR Biomed. 2012;25:717–725. doi: 10.1002/nbm.1783. [DOI] [PubMed] [Google Scholar]
- Heidemann RM, Ivanov D, Trampel R, Fasano F, Meyer H, Pfeuffer J, Turner R. Isotropic submillimeter fMRI in the human brain at 7 T: combining reduced field-of-view imaging and partially parallel acquisitions. Magn Reson Med. 2012;68:1506–1516. doi: 10.1002/mrm.24156. [DOI] [PubMed] [Google Scholar]
- Huang CM, Lee SH, Hsiao IT, Kuan WC, Wai YY, Ko HJ, Wan YL, Hsu YY, Liu HL. Study-specific EPI template improves group analysis in functional MRI of young and older adults. J Neurosci Methods. 2010;189:257–266. doi: 10.1016/j.jneumeth.2010.03.021. [DOI] [PubMed] [Google Scholar]
- Jenkinson M, Bannister P, Brady M, Smith S. Improved optimization for the robust and accurate linear registration and motion correction of brain images. Neuroimage. 2002;17:825–841. doi: 10.1016/s1053-8119(02)91132-8. [DOI] [PubMed] [Google Scholar]
- Jo HJ, Lee JM, Kim JH, Shin YW, Kim IY, Kwon JS, Kim SI. Spatial accuracy of fMRI activation influenced by volume- and surface-based spatial smoothing techniques. Neuroimage. 2007;34:550–564. doi: 10.1016/j.neuroimage.2006.09.047. [DOI] [PubMed] [Google Scholar]
- Kleinschmidt A, Nitschke MF, Frahm J. Somatotopy in the human motor cortex hand area. A high-resolution functional MRI study. Eur J Neurosci. 1997;9:2178–2186. doi: 10.1111/j.1460-9568.1997.tb01384.x. [DOI] [PubMed] [Google Scholar]
- Koopmans PJ, Barth M, Norris DG. Layer-specific BOLD activation in human V1. Hum Brain Mapp. 2010;31:1297–1304. doi: 10.1002/hbm.20936. [DOI] [PMC free article] [PubMed] [Google Scholar]
- Koopmans PJ, Barth M, Orzada S, Norris DG. Multi-echo fMRI of the cortical laminae in humans at 7 T. Neuroimage. 2011;56:1276–1285. doi: 10.1016/j.neuroimage.2011.02.042. [DOI] [PubMed] [Google Scholar]
- Kurth R, Villringer K, Mackert BM, Schwiemann J, Braun J, Curio G, Villringer A, Wolf KJ. fMRI assessment of somatotopy in human Brodmann area 3b by electrical finger stimulation. Neuroreport. 1998;9:207–212. doi: 10.1097/00001756-199801260-00006. [DOI] [PubMed] [Google Scholar]
- Lorenzen P, Davis B, Gerig G, Bullitt E, Joshi S. Multi-class posterior atlas formation via unbiased kullback-leibler template estimation. Springer; 2004. pp. 95–102. [Google Scholar]
- Martuzzi R, van der Zwaag W, Farthouat J, Gruetter R, Blanke O. Human finger somatotopy in areas 3b, 1, and 2 A 7T fMRI study using a natural stimulus. Hum Brain Mapp. 2012 doi: 10.1002/hbm.22172. [DOI] [PMC free article] [PubMed] [Google Scholar]
- Mazziotta J, Toga A, Evans A, Fox P, Lancaster J, Zilles K, Woods R, Paus T, Simpson G, Pike B, Holmes C, Collins L, Thompson P, MacDonald D, Iacoboni M, Schormann T, Amunts K, Palomero-Gallagher N, Geyer S, Parsons L, Narr K, Kabani N, Le Goualher G, Boomsma D, Cannon T, Kawashima R, Mazoyer B. A probabilistic atlas and reference system for the human brain: International Consortium for Brain Mapping (ICBM) Philos Trans R Soc Lond B Biol Sci. 2001;356:1293–1322. doi: 10.1098/rstb.2001.0915. [DOI] [PMC free article] [PubMed] [Google Scholar]
- Mazziotta JC, Toga AW, Evans A, Fox P, Lancaster J. A probabilistic atlas of the human brain: theory and rationale for its development. The International Consortium for Brain Mapping (ICBM) Neuroimage. 1995;2:89–101. doi: 10.1006/nimg.1995.1012. [DOI] [PubMed] [Google Scholar]
- Mikl M, Marecek R, Hlustik P, Pavlicova M, Drastich A, Chlebus P, Brazdil M, Krupa P. Effects of spatial smoothing on fMRI group inferences. Magn Reson Imaging. 2008;26:490–503. doi: 10.1016/j.mri.2007.08.006. [DOI] [PubMed] [Google Scholar]
- Miller M, Banerjee A, Christensen G, Joshi S, Khaneja N, Grenander U, Matejic L. Statistical methods in computational anatomy. 1997 doi: 10.1177/096228029700600305. [DOI] [PubMed] [Google Scholar]
- Moeller S, Yacoub E, Olman CA, Auerbach E, Strupp J, Harel N, Ugurbil K. Multiband multislice GE-EPI at 7 tesla, with 16-fold acceleration using partial parallel imaging with application to high spatial and temporal whole-brain fMRI. Magn Reson Med. 2010;63:1144–1153. doi: 10.1002/mrm.22361. [DOI] [PMC free article] [PubMed] [Google Scholar]
- Nelson AJ, Chen R. Digit somatotopy within cortical areas of the postcentral gyrus in humans. Cereb Cortex. 2008;18:2341–2351. doi: 10.1093/cercor/bhm257. [DOI] [PubMed] [Google Scholar]
- Petridou N, Italiaander M, van de Bank BL, Siero JC, Luijten PR, Klomp DW. Pushing the limits of high-resolution functional MRI using a simple high-density multi-element coil design. NMR Biomed. 2012;26:65–73. doi: 10.1002/nbm.2820. [DOI] [PubMed] [Google Scholar]
- Polimeni JR, Fischl B, Greve DN, Wald LL. Laminar analysis of 7T BOLD using an imposed spatial activation pattern in human V1. Neuroimage. 2010;52:1334–1346. doi: 10.1016/j.neuroimage.2010.05.005. [DOI] [PMC free article] [PubMed] [Google Scholar]
- Poser BA, Koopmans PJ, Witzel T, Wald LL, Barth M. Three dimensional echo-planar imaging at 7 Tesla. Neuroimage. 2010;51:261–266. doi: 10.1016/j.neuroimage.2010.01.108. [DOI] [PMC free article] [PubMed] [Google Scholar]
- Sanchez-Panchuelo RM, Francis S, Bowtell R, Schluppeck D. Mapping human somatosensory cortex in individual subjects with 7T functional MRI. J Neurophysiol. 2010;103:2544–2556. doi: 10.1152/jn.01017.2009. [DOI] [PMC free article] [PubMed] [Google Scholar]
- Schweizer R, Voit D, Frahm J. Finger representations in human primary somatosensory cortex as revealed by high-resolution functional MRI of tactile stimulation. Neuroimage. 2008;42:28–35. doi: 10.1016/j.neuroimage.2008.04.184. [DOI] [PubMed] [Google Scholar]
- Siero JC, Petridou N, Hoogduin H, Luijten PR, Ramsey NF. Cortical depth-dependent temporal dynamics of the BOLD response in the human brain. J Cereb Blood Flow Metab. 2011;31:1999–2008. doi: 10.1038/jcbfm.2011.57. [DOI] [PMC free article] [PubMed] [Google Scholar]
- Smith SM. Fast robust automated brain extraction. Hum Brain Mapp. 2002;17:143–155. doi: 10.1002/hbm.10062. [DOI] [PMC free article] [PubMed] [Google Scholar]
- Van Essen DC. A Population-Average, Landmark- and Surface-based (PALS) atlas of human cerebral cortex. Neuroimage. 2005;28:635–662. doi: 10.1016/j.neuroimage.2005.06.058. [DOI] [PubMed] [Google Scholar]
- van Westen D, Fransson P, Olsrud J, Rosen B, Lundborg G, Larsson EM. Fingersomatotopy in area 3b: an fMRI-study. BMC Neurosci. 2004;5:28. doi: 10.1186/1471-2202-5-28. [DOI] [PMC free article] [PubMed] [Google Scholar]
- Weibull A, Bjorkman A, Hall H, Rosen B, Lundborg G, Svensson J. Optimizing the mapping of finger areas in primary somatosensory cortex using functional MRI. Magn Reson Imaging. 2008;26:1342–1351. doi: 10.1016/j.mri.2008.04.007. [DOI] [PubMed] [Google Scholar]
- Wiggins GC, Wiggins CJ, Potthast A, Alagappan V, Kraff O, Reykowski A, Wald LL. A 32 Channel Receive-only Head Coil And Detunable Transmit Birdcage Coil For 7 Tesla Brain Imaging. Proc Intl Soc Mag Reson Med. 2006:415. [Google Scholar]
- Wilke M, Holland SK, Altaye M, Gaser C. Template-O-Matic: a toolbox for creating customized pediatric templates. Neuroimage. 2008;41:903–913. doi: 10.1016/j.neuroimage.2008.02.056. [DOI] [PubMed] [Google Scholar]
- Woolrich MW, Ripley BD, Brady M, Smith SM. Temporal autocorrelation in univariate linear modeling of FMRI data. Neuroimage. 2001;14:1370–1386. doi: 10.1006/nimg.2001.0931. [DOI] [PubMed] [Google Scholar]