Abstract
Traditional burn mortality models are derived using all age groups. We hypothesized that age variably impacts mortality after burn and that age-specific models for children, adults, and seniors will more accurately predict mortality than an all-ages model. We audited data from the American Burn Association (ABA) National Burn Repository (NBR) from 2000-2009 and used mixed effect logistic regression models to assess the influence of age, total body surface area (TBSA) burn, and inhalation injury on mortality. Mortality models were constructed for all ages and age-specific models: children (<18 years), adults (18-60 years), and seniors (>60 years). Model performance was assessed by area under the receiver operating curve (AUC). Main effect and two-way interactions were used to construct age-group specific mortality models. Each age-specific model was compared to the All Ages model. Of 286,293 records 100,051 had complete data. Overall mortality was 4% but varied by age (17% seniors, <1% children). Age, TBSA, and inhalation injury were significant mortality predictors for all models (p<0.05). Differences in predicted mortality between the All Ages model and the age-specific models occurred in children and seniors. In the age-specific pediatric model, predicted mortality decreased with age; inhalation injury had greater effect on mortality than in the All Ages model. In the senior model mortality increased with age. Seniors had greater increase in mortality per 1% increment in burn size and 1 year increase in age than other ages. The predicted mortality in seniors using the senior-specific model was higher than in the All Ages model. “One size fits all” models for predicting burn outcomes do not accurately reflect the outcomes for seniors and children. Age-specific models for children and seniors may be advisable.
Keywords: burns, mortality, model
Introduction
Burn mortality has decreased markedly in the past 100 years, and multiple burn mortality prediction models have been developed over time in response to that decline. Mortality prediction models are important for quality control and assessment, planning treatment, providing families with prognosis, performing research power analysis, and comparing the efficacy of therapeutic interventions. To be valuable, however, mortality models need to accurately reflect survival for all patient populations.
The first burn mortality models developed in Copenhagen and Toronto set the stage for the landmark studies by Bull and Fisher as well as Pruitt. [1-4] One of the most frequently used mortality prediction models is the Baux Index, which was developed as a thesis by a non-burn academic. [5] These were followed by the Abbreviated Burn Severity Index and the Clark mortality prediction model. [6-7] The modern era has marked the development of a plethora of burn mortality models from multiple different countries, including China, the United States, Africa, Australia, Belgium, and Canada. [8-13] The sheer number of different models suggests that none accurately predicts outcomes in every population.
Virtually all of these burn mortality models have included three variables: age, total body surface area (TBSA) burn, and inhalation injury in their analysis of burn outcomes. Typically the entire spectrum of age and TBSA are included in one model. In addition, many models were developed from data sets of <10,000 patients, often from a limited number of centers. These characteristics limit the generalizability and utility of these models. We hypothesized that age variably impacts outcomes in burns and that age-specific models for children, adults, and seniors will more accurately predict mortality than a single model for all ages. The purpose of our study was to develop four burn outcomes models: All Ages, Children (<18 years), Adults (18-60 years), and Seniors (>60 years) and compare both outcomes and accuracy of the four models.
Data
The American Burn Association (ABA) National Burn Repository (NBR) contains outcomes, patient and injury characteristics for patients admitted to burn centers for treatment of burns and related medical conditions. We obtained the ABA's 2009 release of the NBR containing of 286,293 admission records. To focus on recent burn care and outcomes, we restricted our analysis to admissions in 2000 or later (210,683). We eliminated records missing information on survival to discharge (12,226), age (5,441), burn size (42,545), or inhalation injury (12,861). We also removed 3,218 records identified as probable duplicates, 6,529 records with unreliable information (e.g., total burn surface area greater than 100, records from facilities with questionable ages or mortality rates), 23,084 records associated with readmissions, and 3,690 records of patients with non-burn injuries. [14] This validation left 100,051 records of initial hospital visits (admissions and outpatient visits) with the minimum information for necessary analysis (i.e., patient age, a burn or inhalation injury, and hospital discharge status). We used mixed effect logistic regression models to evaluate the effect of patient age, TBSA burn and the presence of inhalation injury on mortality. Facility was included as a random effect to account for correlation among patients treated at the same facility. Proc GLIMMIX in SAS software version 9.2 was used to fit these regressions.
We first developed and evaluated mortality models by separating the data set into equally–sized training and test sets via computerized randomization. Model parameters were estimated using the training set and applied to the test set. We constructed models using all ages (All Ages model) and then separately modeled children (<18 years old), adults (18-60 years old), and seniors (≥ 60 years old). Model performance was assessed via the area under the receiver operating curve (AUC) and by comparing observed and predicted mortality of the test set. We first fit a main effects only model (age, TBSA burn, and inhalation injury) and then fit a more robust model that also included all two-way interactions between age, TBSA burn, and inhalation injury. We compared performance of the All Ages model to the age group-specific models for the three age groups. Finally, based on these results, we used all the data to construct age-group specific mortality models.
Results
The NBR yielded 100,051 unique records of initial hospital admissions or first outpatient visits with valid data on the patient's age, TBSA burn, inhalation injury, and survival to discharge. These record were randomly divided utilizing computer-based algorithm into a training (N=50,025) and test set (N=50,026). Children and seniors comprised a relatively small percentage of the records (Table 1). In both the training and test sets, overall mortality was about 4% but varied among the age groups with relatively high mortality among seniors (˜17%) and extremely low mortality (<1%) for children (Table 1). The occurrence of inhalation injury also varied substantially among the age groups with a much higher proportion of seniors suffering inhalation injury than children (Table 1).
Table 1.
Total number of records, number with inhalation injury (%) and number (%) of deaths in each age group evaluated for the training and test sets.
| Training Set | Test Set | |||||
|---|---|---|---|---|---|---|
| Group | Records | With Inhalation Injury | Deaths | Records | With Inhalation Injury | Deaths |
| All Ages | 50,025 | 4,460 (8.9%) | 2,082 (4.2%) | 50,026 | 4,408 (8.8%) | 2,046 (4.1%) |
| Children | 16,783 | 554 (3.3%) | 122 (0.7%) | 16,685 | 543 (3.3%) | 135 (0.8%) |
| Adults | 29,194 | 2,953 (10.7%) | 992 (3.6%) | 27,671 | 2,865 (10.3%) | 953 (3.4%) |
| Seniors | 5,487 | 953 (17.2%) | 968 (17.4%) | 5,571 | 1,000 (18.2%) | 958 (17.5%) |
Based on regression results with the training set, mortality was significantly (p < 0.05) related to TBSA burn and the presence of inhalation injury in all models. Increases in burn size had a similar increasing impact on mortality in children and adults but had a larger effect in seniors (Table 2). The presence of inhalation injury increased mortality in all models. However, its effect was considerably larger in children than in adults or seniors (Table 2). Increasing age was a significant factor for seniors and adults but not for children (F1,16701 = 0.86, p = 0.355). For seniors and adults, mortality increased with age with a greater impact in seniors than adults (Table 2).
Table 2.
Parameter estimates (± SE) for the intercept, total burn surface area, age and presence of inhalation injury (1: present, 0: absent) with developed with the training set using records for all ages, children (0-18 years old) only, adults (18-60 years old) only and seniors (≥ 60 years old) only. Except where noted all estimated parameters are significantly different from 0 (p < 0.05).
| Models | Intercept | TBSA | Age | Inhalation Injury |
|---|---|---|---|---|
| All Ages | -8.36±0.136 | 0.082±0.001 | 0.069±0.002 | 1.527±0.067 |
| Children-specific | -6.853±0.270 | 0.071±0.004 | -0.019±0.021a | 2.432±0.254 |
| Adult-specific | -8.075±0.219 | 0.079±0.002 | 0.061±0.004 | 1.562±0.093 |
| Senior-specific | -10.065±0.453 | 0.104±0.004 | 0.088±0.006 | 1.527±0.110 |
Not significantly different from 0 (F1,16701 = 0.86, p = 0.355)
We tested the validity of the model by applying the models developed with the training set (Table 2) to the independent test set. Models developed with the training set had high discriminatory ability of mortality for patients in the test set. The area under the receiver operating curves (AUC) exceeded 0.89 in all cases and was greater than 0.93 except for seniors (Table 3). Across all ages, the AUC for the All Age model was 0.947. With this model however, the AUC decreased when adults, and most notably, seniors were considered separately. Including all two-way interactions in the models yielded only small improvements in AUC values (Table 3).
Table 3.
Area under the curve values (AUC) for models containing only main effects (TBSA, age and inhalation injury) and models with these main effects plus all two-way interactions. Model parameters were estimated with the training set and applied to an independent test set. AUC values were calculated for the All Ages Model applied to all test set records, children (0-18 years old) only, adults (18-60 years old) only and seniors (≥ 60 years old) only and compared to results for models developed using training set records for the specific age groups.
| Model | Main Effects Model | Main Effects + 2-way Interactions Model |
|---|---|---|
| All Ages Model | ||
| All Ages | 0.947 | 0.954 |
| Children only | 0.952 | 0.960 |
| Adults only | 0.933 | 0.942 |
| Seniors only | 0.896 | 0.897 |
| Children-specific Model | 0.969 | 0.970 |
| Adult-specific Model | 0.935 | 0.943 |
| Senior-specific Model | 0.896 | 0.898 |
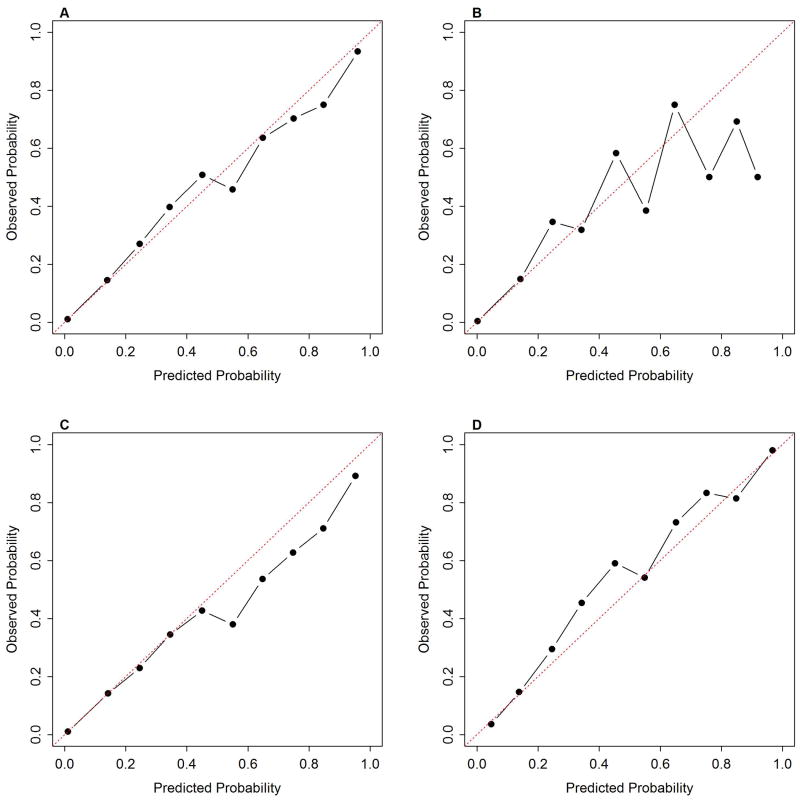
Across all records, the All Ages training model showed very good calibration with the test set (Figure 1A), but when separated by age group, this model tended to underestimate mortality among seniors (Figure 1D) and slightly overestimate adult mortality (Figure 1C). For children, agreement between observed and predicted mortality was poorer than for the other age groups (Figure 1B). This apparent poor agreement likely results from the small number of deaths among children. For many risk deciles fewer than 10 children died (Table 4). As a result, misclassifying just one child could change the estimated mortality by 10% or more. Directly comparing the observed number of deaths to the predicted number of deaths by risk deciles clearly showed that the All Ages model underestimated the total number of deaths among children particularly those with a low mortality risk (Table 4). The All Ages model also underestimated the total number of deaths among seniors but overestimated deaths in the lowest risk group (Table 5).
Figure 1.
Calibration curves for All Ages model applied to test set separated by age groups, A) all ages, B) children, C) adults, and D) seniors.
Table 4.
Comparisons of observed and predicted mortality in children for the All Ages model children-specific model with main effects and with interactions. Risk deciles were defined based on predicted mortality probability for each model.
| All Ages Model | Child Specific Main Effects Model | Child Specific Interactions Model | ||||
|---|---|---|---|---|---|---|
| Risk Deciles | Observed | Predicted | Observed | Predicted | Observed | Predicted |
| 0-10% | 72 | 25 | 54 | 44 | 50 | 41 |
| 10-20% | 7 | 7 | 20 | 11 | 16 | 16 |
| 20-30% | 9 | 6 | 8 | 8 | 9 | 12 |
| 30-40% | 7 | 8 | 5 | 8 | 12 | 10 |
| 40-50% | 7 | 5 | 7 | 8 | 6 | 9 |
| 50-60% | 5 | 7 | 3 | 8 | 5 | 11 |
| 60-70% | 12 | 10 | 3 | 6 | 21 | 23 |
| 70-80% | 6 | 9 | 9 | 14 | 16 | 17 |
| 80-90% | 9 | 11 | 19 | 23 | - | - |
| 90-100% | 1 | 2 | 7 | 10 | - | - |
| Total | 135 | 90 | 135 | 141 | 135 | 139 |
Table 5.
Comparisons of observed and predicted mortality in seniors for the All Ages model senior-specific model with main effects and with interactions. Risk deciles were defined based on predicted mortality probability for each model.
| All Ages Model | Senior-Specific Main Effects Model | Senior-Specific Interactions Model | ||||
|---|---|---|---|---|---|---|
| Risk Deciles | Observed | Predicted | Observed | Predicted | Observed | Predicted |
| 0-10% | 120 | 156 | 129 | 136 | 126 | 135 |
| 10-20% | 148 | 139 | 125 | 124 | 122 | 114 |
| 20-30% | 100 | 83 | 78 | 67 | 89 | 75 |
| 30-40% | 84 | 63 | 72 | 64 | 57 | 59 |
| 40-50% | 65 | 50 | 61 | 52 | 66 | 54 |
| 50-60% | 52 | 53 | 50 | 54 | 55 | 60 |
| 60-70% | 60 | 53 | 47 | 51 | 54 | 55 |
| 70-80% | 60 | 54 | 59 | 61 | 44 | 48 |
| 80-90% | 70 | 73 | 70 | 74 | 79 | 82 |
| 90-100% | 199 | 196 | 267 | 274 | 266 | 269 |
| Total | 958 | 920 | 958 | 957 | 958 | 951 |
Discriminatory ability for mortality among children improved with the child-specific model (AUC = 0.969 vs. 0.952 with the All Ages model) but age-specific models increased AUC values only slightly for adults and seniors. The child-specific model yielded total deaths among children much closer to the observed value and with a more similar distribution than the All Ages model (Table 4). Similarly, for seniors, predicted deaths with the senior-specific model were closer to the observed values. Including interaction terms generally improved predictions for all age groups although AUC values did not improve substantially beyond the main effects only model (Table 3).
Age-Specific Mortality Prediction Models
The above results revealed the benefit of separately considering children and seniors in predicting mortality from burns and showed models with main effects of age, TBSA, and the presence of inhalation injury to capture much of the variation in mortality. Therefore, we developed predictive models for each age group using the full data set.
Age, TBSA and inhalation injury were significant (p < 0.05) mortality predictors for all models developed using the full data set. Unlike the models for seniors, adults and those using all ages, predicted mortality for children decreased with age, highlighting the importance of using age-specific models (Table 6). Inhalation injury was also estimated to have a larger effect in children than in other age groups. For seniors, the age-specific modeling revealed a greater increase in mortality risk for every 1% increase in burn size and 1 year increase in age than among adults (Table 6).
Table 6.
Parameter estimates (± SE) for the intercept, total burn surface area, age and presence of inhalation injury (1: present, 0: absent) with developed using all records for children (0-18 years old) only, adults (18-60 years old) only and seniors (≥ 60 years old) only. All estimated parameters are significantly different from 0 (p < 0.05).
| Models | Intercept | TBSA | Age | Inhalation Injury |
|---|---|---|---|---|
| All Ages | -8.232±0.105 | 0.080±0.001 | 0.067±0.001 | 1.570±0.047 |
| Children-specific | -6.671±0.200 | 0.070±0.003 | -0.035±0.015 | 2.559±0.177 |
| Adult-specific | -7.888±0.160 | 0.076±0.001 | 0.057±0.0034 | 1.645±0.066 |
| Senior-specific | -10.046±0.325 | 0.104±0.003 | 0.088±0.004 | 1.515±0.079 |
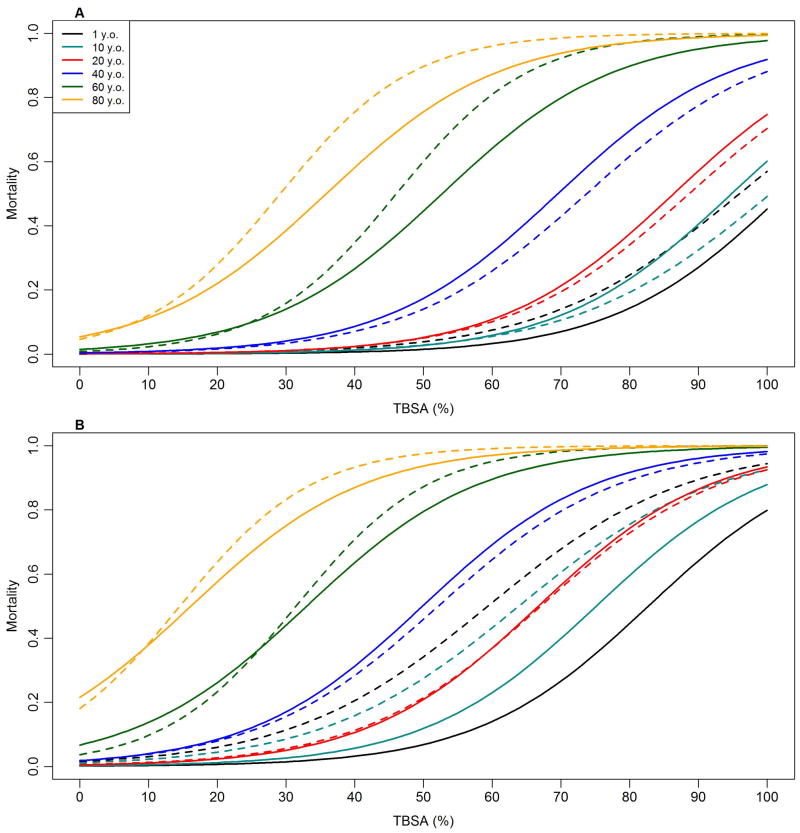
The greatest differences in predicted mortality between the All Ages model and the age-specific model occurred for children and seniors. The most substantial difference is that the child-specific model predicts lower mortality in older children than in younger children while the opposite is predicted by the All Ages models (Figure 2). Secondly, the child-specific model predicts considerably higher mortality among children suffering inhalation injury than does the All Ages model (Figure 2B). For seniors, predicted mortality is higher with the age-specific model when inhalation injury is absent (Figure 2B) but is similar between the All Ages and senior-specific model for seniors suffering inhalation injury.
Figure 2.
Predicted mortality for different ages (1, 10, 20, 40, 60, and 80 years old) as a function of total burn surface area (%) without inhalation injury (A) and with inhalation injury (B). Solid lines are prediction from model developed using all ages. Dashed lines show predictions from age-specific models.
Discussion
Traditional mortality models have served the burn community well. However, as our study demonstrates, they are less accurate in predicting outcomes in children and seniors. Children have decreased mortality as they get older, most likely due to organ and immune system development. In contrast, the elderly have increased mortality as they age, and each percent burn and year in age change impact their outcomes more than predicted by an all ages model. The inaccuracies in an all ages model are likely due to the large number of patients in the 18-60 year old group, which dwarfs the contribution of the smaller pediatric and senior groups.
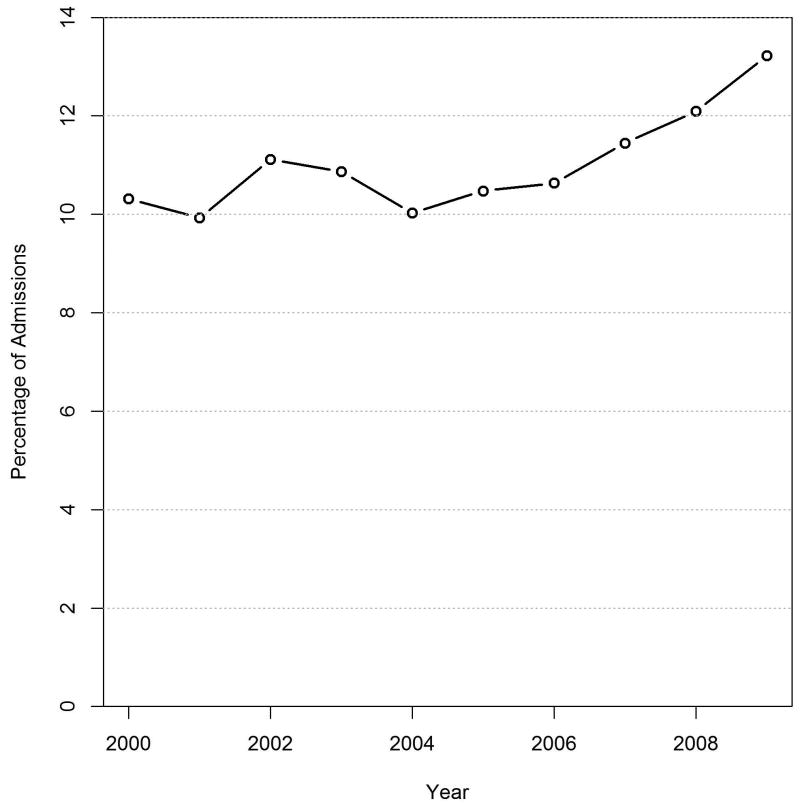
Why should we care about these differences? First, children have the greatest number of life-years after injury, so an over or underestimation of mortality in any single patient will have a greater impact sytem-wide. Second, the senior population is growing rapidly, and the number of burn injuries in the elderly is likely to parallel that increase. Indeed, this is already reflected in the NBR, which has seen a steady increase in the number of senior burn injuries reported in the last 10 years. (Figure 3)
Figure 3.
Percentage of senior (> 60 years old) burn admissions reported in the National Burn Repository (NBR) 2000-2009.
We are not the first in the modern era to use the NBR to develop burn mortality prediction models. Osler, et al used the NBR and logistic regression analysis to modify the classical Baux score and estimate mortality after burn injury. [15] Our mortality model had a smaller age effect and smaller effect of inhalation injury on mortality. This is likely due to the data used to develop the model. Osler utilized records from initial admission patients in the NBR from 2000-2007 but eliminated patients from centers that submitted less than 300 patients. As a result, they analyzed 1/3 the patient volume (about 40,000 records) and utilized data from only 40 different burn centers in the analysis. We included all centers to increase generalizibility of the data set, and included patients from 2000-2010 in our model. Our data set was 2.5 larger, consisting of over 100,000 records. With this larger data set, we had larger numbers of seniors and children than were available in Osler's data set which allowed us to better estimate mortality for these age groups. In addition, Osler combined the extremes of ages in his model and acknowledged that the revised Baux model was less accurate for children or seniors because it was based on the “majority” of burn injuries, which occurs in ages 20-80 years. The fundamental purpose of Osler's work was to create a single simple to use score for all patients, which he accomplished, but at the cost of accuracy for children and seniors.
Using data bases for development of mortality models has pitfalls that must be acknowledged. First, the accuracy of burn size and inhalation injury diagnosis was not standardized among centers and cannot be confirmed objectively. This could lead to individual center variability in diagnosis. We compensated for this by including center as a random effect; however, this may not fully account for data variability. Second, using the model for prognostication in any individual patient is not necessarily appropriate, as survival rates represent averages over patients for a given age, burn size and inhalation injury. For example, for patients predicted to have a 90% mortality probability, 10% are predicted to survive on average. Perhaps the most reasonable approach is to provide the family with the percentages as a perspective regarding chances for survival. Third, other factors, such as comorbidities, are not accounted for in the model and may indeed explain the variability in AUC for seniors and children. The impact of comorbidities and other variables is likely to be most pronounced in the senior population, and as such the model fit is not as robust as for other groups. Our study suggests that the classical triad used to predict mortality after burn injury (inhalation injury, age, and TBSA burn) may need to be expanded to include other factors for extremes of ages. Finally, children as a group have an extremely low mortality; as such, predicting survival in a child will be accurate in the majority of cases. Further examination of data sets including larger numbers of children and more refined information on injury characteristics may be needed to further refine mortality predictions.
In conclusion, traditional burn mortality models have concentrated efforts on development of a “one size fits all” model to make estimation of burn mortality easier for the clinician. However, this methodology is less accurate at the extremes of ages-both seniors and children. Specific modeling for these groups is necessary to allow for a more accurate representation of mortality for quality control, research, and comparison of different treatments. Ideally a fully audited prospective data collection effort could provide accurate data that could be used to model mortality for all groups in the future.
Acknowledgments
Grant funding: National Center for Research Resources, National Institutes of Health, Grant #UL1RR024146, National Center for Advancing Translational Sciences, National Institutes of Health, Grant #TR000002 and by USAMRMC Award #W81XWH-09-1-069
Appendix A: Assessment of linear relationships between log odds mortality and TBSA and age
An implicit assumption of the models we developed for predicting mortality as a function of patient age, total burn surface area (TBSA) and inhalation injury is that the log odds of mortality is linearly related to TBSA and age. Using the NBR, we investigated the functional nature of the relationships between the log odds of mortality and TBSA and age and assessed the appropriateness of using only linear terms for these factors in the modeling.
Total Body Surface Area Burned
With the large number of records available in the NBR, we were able to directly calculate the log odds mortality for every 1% TBSA. All patients were used for the calculations irrespective of age or inhalation status. A plot of the log odds mortality versus TBSA revealed a mild non-linear relationship (Figure A1). Adjusted r2 values from a simple linear regression indicated slightly improved fit with inclusion of a quadratic TBSA term (Linear regression adjusted r2 = 0.956; Quadratic regression adjusted r2 = 0.944).
Figure A1.
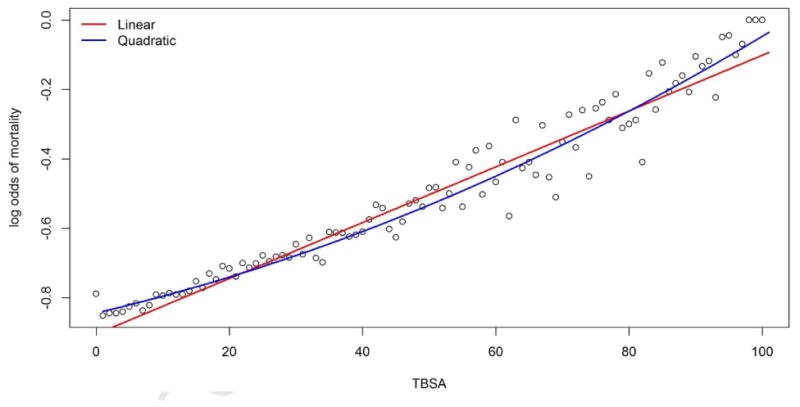
Log odds of mortality calculated for each 1% of total burn surface area using the training set consisting of 50,025 records. The red line shows a regression fit with a linear term for TBSA and the blue line shows the regression fit with a linear and quadratic term for TBSA.
We then compared predicted mortality for the training and test sets using age-specific models developed with the training set with 1) only a linear TBSA term and 2) with a linear and quadratic terms for TBSA. For children and adults, predicted mortality was nearly identical for the two models (Figure A2). For seniors, the two models still showed considerable agreement but did deviate more than for the other age groups (Figure A2).
Figure A2.
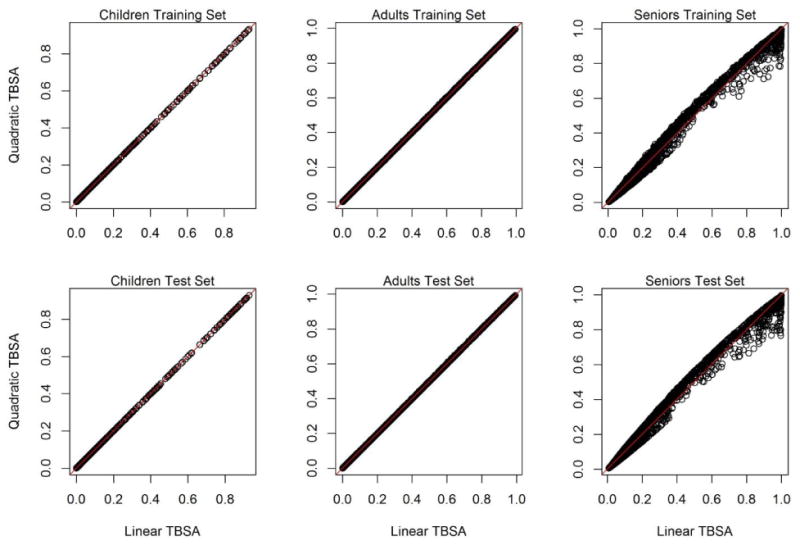
Comparison of predicted for mortality for the training and test sets for age-specific models with only a linear term of TBSA (Linear TBSA) or linear plus quadratic terms for TBSA (Quadratic TBSA).
Finally, we compared the observed and predicted number of deaths predicted for the test set using the age-specific models with only a linear TBSA term or linear plus quadratic terms for TBSA. Consistent with Figure A2, predicted number of deaths were identical for children and nearly identical for adults but differed for seniors (Table A1). For seniors, the quadratic model provided a slightly better fit particularly for the smallest and largest risk deciles.
Table A1.
Comparisons of observed (Obs) and predicted (Pred) mortality from age-specific models applied to the test set by risk decile. Risk deciles were defined based on predicted mortality probability for each model. Linear models included only a linear term for TBSA while quadratic models included linear and quadratic terms for TBSA.
| Children | Adults | Seniors | ||||||||||
|---|---|---|---|---|---|---|---|---|---|---|---|---|
| Linear | Quadratic | Linear | Quadratic | Linear | Quadratic | |||||||
| Decile | Obs | Pred | Obs | Pred | Obs | Pred | Obs | Pred | Obs | Pred | Obs | Pred |
| 0-10 | 54 | 45 | 54 | 45 | 296 | 264 | 296 | 264 | 129 | 136 | 128 | 129 |
| 10-20 | 20 | 11 | 20 | 11 | 82 | 72 | 82 | 72 | 125 | 124 | 110 | 108 |
| 20-30 | 8 | 8 | 8 | 8 | 67 | 63 | 67 | 63 | 78 | 67 | 84 | 68 |
| 30-40 | 5 | 8 | 5 | 8 | 58 | 54 | 59 | 53 | 72 | 64 | 56 | 62 |
| 40-50 | 7 | 8 | 7 | 8 | 43 | 46 | 41 | 45 | 61 | 52 | 61 | 55 |
| 50-60 | 3 | 8 | 3 | 8 | 51 | 59 | 52 | 59 | 50 | 54 | 58 | 61 |
| 60-70 | 3 | 6 | 3 | 6 | 51 | 58 | 51 | 57 | 47 | 51 | 59 | 61 |
| 70-80 | 9 | 14 | 9 | 14 | 61 | 68 | 60 | 68 | 59 | 61 | 76 | 83 |
| 80-90 | 19 | 23 | 19 | 23 | 83 | 94 | 83 | 94 | 70 | 74 | 96 | 98 |
| 90-100 | 7 | 10 | 7 | 10 | 161 | 169 | 162 | 171 | 267 | 274 | 230 | 230 |
| Total | 135 | 141 | 135 | 141 | 953 | 947 | 953 | 946 | 958 | 957 | 958 | 955 |
Age
As for TBSA, because of the large number of records available in the NBR, we were able to directly calculate the log odds mortality for every one year of age. All patients were used for the calculations irrespective of TBSA or inhalation status. Over the full range of ages, the log odds of mortality had a nonlinear relationship with age (Figure A3). However, within the age groups that we used in developing our models, the relationships can reasonably be represented linearly (Figure A3).
Figure A3.
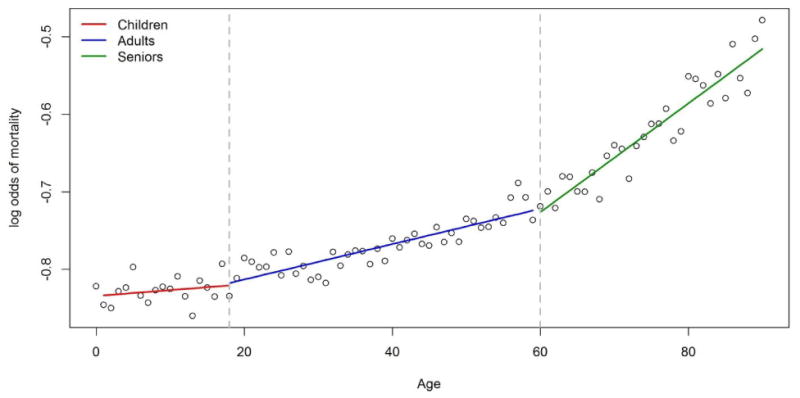
Log odds of mortality calculated for each 1 year of age using the training set consisting of 50,025 records. Solid lines show linear regression fitted values determined separately for children (red), adults (blue) and seniors (green).
This finding emphasized the value of the age-specific models we developed but also suggested that age could be modeled with non-linear terms without creating age specific models. We further investigated this possibility by developing a model using all records of the training set that included linear, quadratic and cubic terms for age. We considered a cubic polynomial based on based on Moreau et al (2005). We also developed age-specific models with cubic age terms. Models developed with the training set were applied to the test set and AUC values computed.
The cubic polynomial All Ages had higher AUC values than the All Ages linear model for all age groups which is expected given the non-linear relationship between age and the log odds of mortality (Table A2). However, the age-specific linear models remained superior to the All Ages cubic polynomial model. Interestingly, the age-specific cubic polynomial models were no better than the linear age-specific models.
Table A2.
Area under the curve values (AUC) for models containing only a linear term for age and cubic polynomials for age. Model parameters were estimated with the training set and applied to an independent test set. AUC values were calculated for the All Ages Model applied to all test set records, children (0-18 years old) only, adults (18-60 years old) only and seniors (≥ 60 years old) only and compared to results for models developed using training set records for the specific age groups.
| Model | Linear Age Effect | Cubic Polynomial Age |
|---|---|---|
| All Ages Linear Model | ||
| All Ages | 0.947 | 0.951 |
| Children only | 0.952 | 0.963 |
| Adults only | 0.933 | 0.935 |
| Seniors only | 0.896 | 0.894 |
| Children-specific Model | 0.969 | 0.967 |
| Adult-specific Model | 0.935 | 0.933 |
| Senior-specific Model | 0.896 | 0.895 |
Summary and Conclusions
These results showed that the log odds of mortality is not linearly related to age over the full range of ages. However, a linear relationship is a reasonable assumption for the three age groups we used – children (0-18 years), adults (18-60 years) and seniors (≥ 60 years). The log odds of mortality showed a slightly non-linear relationship with TBSA. However at the practical level of predicting the probability of mortality, incorporating this non-linearity into the modeling resulted in almost no differences for children and adults. For seniors, predictions using models with linear and quadratic terms for TBSA differed more than for the other age groups, although were still substantially similar.
Footnotes
Presented at International Surgical Week, Helsinki, Finland, August 2013.
Conflict of Interest Statement: None of the authors have financial and personal relationships with other people or organizations that could inappropriately influence (bias) their work.
Tina L. Palmieri MD, FACS, FCCM Confirmed with: Dr. Sanda Taylor, Ms. MaryBeth Lawless, Dr. Soman Sen, Dr. David G. Greenhalgh
Publisher's Disclaimer: This is a PDF file of an unedited manuscript that has been accepted for publication. As a service to our customers we are providing this early version of the manuscript. The manuscript will undergo copyediting, typesetting, and review of the resulting proof before it is published in its final citable form. Please note that during the production process errors may be discovered which could affect the content, and all legal disclaimers that apply to the journal pertain.
References
- 1.Lutken P. Mortality from burns. Ugesk Laeger. 1937;99:409. [Google Scholar]
- 2.Farmer AW. Experience with burns at the hospital for sick children. Am J Surg. 1943;59:195. [Google Scholar]
- 3.Bull JP, Fisher AJ. A study of mortality in a burns unit: a revised estimate. Ann Surg. 1954;139:269–74. doi: 10.1097/00000658-195403000-00002. [DOI] [PMC free article] [PubMed] [Google Scholar]
- 4.Pruitt BA, Jr, Tumbusch WT, Mason AD, Jr, Pearson E. Ann Surg. 1964;159:396–401. doi: 10.1097/00000658-196403000-00011. [DOI] [PMC free article] [PubMed] [Google Scholar]
- 5.Baux S. These; Paris: 1961. Contribution a l'etude du traitement local des brulures thermiques etendues. [Google Scholar]
- 6.Tobiasen J, Hiebert JM, Edlich RF. The abbreviated burn severity index. Ann Emerg Med. 1982;11:260–2. doi: 10.1016/s0196-0644(82)80096-6. [DOI] [PubMed] [Google Scholar]
- 7.Clark CJ, Reid WH, Gilmour WH, Campbell D. Mortality probaility in victims of fire trauma: revised equation to include inhalation injury. Br Med J. 1986;292:1303–5. doi: 10.1136/bmj.292.6531.1303. [DOI] [PMC free article] [PubMed] [Google Scholar]
- 8.Godwin, Wood Major burns in Cape Town: a modified burns score for patient triage. Burns. 1998;24:58–63. doi: 10.1016/s0305-4179(97)00053-3. [DOI] [PubMed] [Google Scholar]
- 9.Ryan CM, Schoenfeld DA, Thorpe WP, Sheridan RL, et al. Objective estimates of the probability of death from burn injuries. N Engl J Med. 1998;338:363–6. doi: 10.1056/NEJM199802053380604. [DOI] [PubMed] [Google Scholar]
- 10.Ho WS, Ying SY, Burd A. Outcome analysis of 286 severely burned patients: retrospective study. Hong Kong Med J. 2002;8:235–9. [PubMed] [Google Scholar]
- 11.Belgian Outcome in Burn Injury (BOBI) Burn Injury Study Group. Development and validation of a model for prediction of mortality in patients with acute burn injury. Br J Surg. 2009;96:111–7. doi: 10.1002/bjs.6329. [DOI] [PubMed] [Google Scholar]
- 12.Gomez M, Wong DT, Stewart TE, Redelmeier DA, et al. The FLAMES score accurately predicts mortality risk in burn patients. J Trauma. 2008;65:636–45. doi: 10.1097/TA.0b013e3181840c6d. [DOI] [PubMed] [Google Scholar]
- 13.Moore EC, Pilcher DV, Bailey MJ, Cleland H, et al. A simple tool for mortality prediction in burns patients: APACHE III score and FTSA. J Trauma. 2013;75:298–303. doi: 10.1016/j.burns.2010.03.013. [DOI] [PubMed] [Google Scholar]
- 14.Taylor SL, Lee D, Travis Nagler, Lawless MB, et al. A validity review of the National Burn Repository. J Burn Care Res. 2013;34(2):274–280. doi: 10.1097/BCR.0b013e3182642b46. [DOI] [PMC free article] [PubMed] [Google Scholar]
- 15.Osler T, Glance LG, Hosmer DW. Simplified estimates of the probability of death after burn injuries: extending and updating the baux score. J Trauma. 2010 Mar;68(3):690–7. doi: 10.1097/TA.0b013e3181c453b3. [DOI] [PubMed] [Google Scholar]


