

Abstract
Tumor dormancy is a condition in which tumor cells remain viable for a long period of time without significant growth, but retaining the potential to eventually regrow resulting in disease relapse after a long disease-free interval. Currently, due to limitations in existing avenues of study, little is known as to how tumor cells become dormant and how they leave dormancy to become full blown metastases. In this study, to explore the mechanisms of tumor dormancy, we used a lipophilic fluorescent dye, DiD, that rapidly and stably integrates into the phospholipid cell membrane. We cultured DiD-stained prostate cancer cell lines for 10 days and isolated cells by flow cytometry based on expression levels of DiD. We found that a decrease in DiD intensity was correlated to the reduction of EdU, where the DiD-high population proliferated more slowly than the DiD-low population and the DiD-low population exhibited a higher mitotic index. We also found that DiD was detected after 3 weeks of implantation in an in vivo setting. Importantly, DiD dye did not have any effect on normal cellular metabolism, including cell growth, migration, and apoptosis. Although further study is indicated, DiD can be useful for identifying the mechanisms underlying tumor dormancy.
Keywords: Tumor dormancy, DiD fluorescent dye, Prostate cancer, Proliferation, Flow Cytometry
Introduction
Tumor cells that spread from a primary tumor to distant sites are referred to as “disseminated tumor cells (DTCs)”. Recent studies have demonstrated that DTCs of several cancer types are generated at an early stage, and some become and stay dormant for a long period of time (1–3). Once DTCs become dormant, they are effectively resistant to cytotoxic treatments that target actively proliferating cells, and these dormant DTCs, if reactivated, can be the root of cancer recurrence. Interestingly, some solid tumors, including prostate cancer (PCa) and breast cancer, disseminate to the bone marrow using similar mechanisms as seen in hematopoietic stem cell (HSC) homing (4,5). More importantly, we discovered that disseminated PCa cells target the specific bone marrow microenvironment where HSCs reside, the “niche”, and may use the niche to maintain dormancy (6). However, due to the limitations of our current study methods, how dormancy occurs in DTCs and how dormant DTCs escape from that state to establish metastatic growth remains unknown.
To explore the mechanisms of cell dormancy, we must first evaluate cell proliferation. Unfortunately, most assays currently used to determine cell proliferation, such as MTT or XTT assays, BrdU assay, and gene expression analyses by PCR, require the permeabilization of cell membranes and/or the termination of cell culture. Although these assays allow us to analyze cell proliferation, their terminal nature prevents us from further dissecting the biology of tumor dormancy. There is, therefore, a need for a specific tool to analyze and recover live cells. Fluorescent dyes are commonly used to kinetically track cell proliferation with flow cytometry. In addition, incorporated fluorescent dyes enable isolation of live cells without damaging their functions, and allow analysis of phenotype in different populations using fluorescent dye-antibody combinations.
In the present study, we used a lipophilic fluorescent dye, DiD, that rapidly and stably integrates into the phospholipid membrane, to recover live dormant cells, while using the reduction in the amount of fluorescent dye per cell at each cell division as a measure of cell proliferation. First, we cultured DiD-stained PCa cell lines for 10 days and isolated cells expressing high levels of DiD (DiD-high) and low levels of DiD (DiD-low) by flow cytometry. Thereafter, we compared the cell proliferation profiles between DiD-high and DiD-low populations. As expected, DiD intensity was correlated to the level of incorporation of 5-ethynyl-2′-deoxyuridine (EdU), a new alternative to measuring 5-bromo-2′deoxyuridine (BrdU) incorporation into cellular DNA. DiD-low cells also proliferated faster than did DiD-high cells, and DiD-low cells exhibited a higher mitotic index. Moreover, in an in vivo subcutaneous implantation model, DiD was still detected after 3 weeks of implantation. Finally, DiD dye did not affect cell growth, migration, or apoptosis. Although further study is clearly needed, the proposed technique may open new avenues to the investigation of tumor dormancy.
Materials and methods
Cell culture
Human prostate cancer cell lines PC3 and DU145, and murine osteoblastic cell line MC3T3-E1 were obtained from the American Type Culture Collection. The metastatic subclone of LNCaP, C42B, was originally isolated from a lymph node of a prostate cancer patient with disseminated bony and lymph node involvement (7). All prostate cancer cell lines were routinely grown in RPMI 1640 (Life Technologies, Cat #: 11875-093), and MC3T3-E1 cells were grown in α-MEM (Life Technologies, Cat #: 12561-056). Cultures were supplemented with 10% (v/v) fetal bovine serum (GEMINI Bio-Products, Cat #: 900-208), 1% (v/v) penicillin-streptomycin (Life Technologies, Cat #: 15140-122) and maintained at 37°C, 5% CO2, and 100% humidity. Doubling time of PC3, DU145, and C4-2B are 36, 30, and 32 hours, respectively.
Flow cytometry
The flow cytometric analyses and fluorescence-activated cell sorting (FACS) were performed on a FACS Aria dual-laser flow cytometer (Becton Dickinson) and data were analyzed with DIVA software (Becton Dickinson). BD cytometer setup & tracking beads kit (BD Biosciences, Cat #: 642412) are used for the daily instrument standardization and validation procedure. Sorting calibration was performed before each sort by drop-delay using Accudrop beads (BD Biosciences, Cat #: 345249), populations for sorting were gated by forward and side scatter to eliminate the presence of doublets. Sorting of these gated cells was done using a 70μm nozzle at 70 psi in purity mode.
Cell labeling with DiD dye
PCa cell lines were stained with DiD dye (Molecular Probes, Cat #: v22887), according to manufacturer directions. Briefly, cells (1 × 10⁶ cells / ml) were incubated with DiD dye (0.5 μM) in serum-free conditions at 37°C for 20 min, and then were washed three times with serum-free medium. The intensity of DiD was analyzed on a FACS Aria dual-laser flow cytometer and data were analyzed with DIVA software. In some cases (Figure 1B and C), cells were co-stained with EdU (10 μM for 48h; Life Technologies, Cat #: c10425) and DiD to perform further examinations.
Figure 1. Tracking proliferation of PCa cells with DiD in vitro.

(A) The DiD flow cytometric dilution profiles of PCa cells. PCa cells were stained with DiD (0.5 μM) and cultured for 10 days. Representative histograms of DiD fluorescence on days 0 and 10 of culture. Data are representative of three replicate experiments. (B) PCa cells (PC3, DU145, C42B) were co-stained with EdU and DiD. At 7 days of culture, three distinct cell groups were isolated based on DiD fluorescence intensity (low intensity, mid intensity and high intensity), and (C) the retention of EdU was compared between the groups. Data are presented as mean ± standard deviation from triplicate determinations. *: P< 0.05 and #: P< 0.01 vs. low intensity group.
Cell labeling with CFSE dye
PCa cell lines were stained with carboxyfluorescein succinimidyl ester (CFSE) dye (Molecular Probes, Cat #: C34554) according to manufacturer directions. Briefly, cells (1 × 10⁶ cells / ml) were incubated with CFSE dye (5 μM) in Dulbecco’s phosphate buffered saline (DPBS, Life Technologies, Cat #: 14190-144) supplemented with 0.1% (w/v) bovine serum albumin (BSA, Sigma, Cat #: A2153) at 37°C for 10 min. Then, cells were transferred into ice-cold culture medium, were incubated on ice for another 5 min, and then were washed three times with culture medium.
Proliferation assay
PCa cells were plated into 96-well plates at a concentration of 4,000 cells / 100 μl / well in growth medium. In some cases (Figure 3A and B), cells were cultured in different serum conditions (1% FBS and 10% FBS). Proliferation was quantified using One Solution Cell Proliferation Assay kit (Promega, Cat #: G3580), which contains a tetrazolium compound [3-(4,5-dimethylthiazol-2-yl)-5-(3-carboxymethoxyphenyl)-2-(4-sulfophenyl)-2H-tetrazolium, inner salt; MTS]. At different time points (24h and 48h), optical intensities were read on a multiwell scanning spectrophotometer at OD 492 nm (Thermo Labsystems). An automatic blanking measurement was performed immediately before a measurement, and Performance Verification kit (Thermo Labsystems, Cat #: 24071960) was used to check the photometric accuracy. Cells cultured in medium with 10%FBS served as positive control. Cells cultured in serum-free medium served as negative control.
Figure 3. The correlation of DiD with cell division.

PCa cells (PC3, DU145, C42B) were stained with DiD and cultured in media with either 10% FBS or 1% FBS for 7 days. (A) The total cell number was counted using trypan blue exclusion and (B) the retention of DiD was measured by flow cytometry. Data are presented as mean ± standard deviation from triplicate determinations. #: P< 0.01 vs. 1% FBS condition.
Mitotic assay
After 10 days of incubation post DiD labeling, DiD-low and DiD-high sub-populations were sorted with a FACS Aria dual-laser flow cytometer, as described above. Cells were plated into 96-well plates at a concentration of 2×10⁴ cells / 100 μl / well and the cultures were incubated at 37°C overnight. Thereafter, the mitotic index of the cells was evaluated using a Mitotic Assay kit (Active Motif, Cat #: 18021), according to manufacturer directions. In this kit, phosphorylated-histone H3 (Ser28) is used as a mitosis marker. Data were normalized to cell number. According to manufacturer directions, cells treated with paclitaxel (1 mM, supplied in Mitotic assay kit, Active Motif, Cat#: 18021) served as positive control. Cells incubated with no primary antibodies served as negative control.
Wound-healing assay
To evaluate cell migration, a wound-healing assay was performed. Cells were grown to confluence in a 6-well plate. A wound scratch was made on the cell monolayer using a sterile 200 μl pipette tip. The monolayers were washed twice with DPBS and incubated for another 48h. At 24h and 48h, wound-healing cell migration was observed under a under a Nikon inverted microscope (Eclipse TS100). Cells cultured in medium with 10%FBS served as positive control. Cells cultured in serum-free medium served as negative control.
Apoptosis assay
PCa cells were labeled with DiD dye (0.5 μM and 2 μM) as described above, and after washing the culture was incubated at 37°C for 48h. The apoptosis of DiD-labeled cells was measured by flow cytometry using annexin V-PE/7-AAD staining kit (BD Biosciences, Cat #: 559763). Cells treated with docetaxel (1 μg/ml, NDC, Cat#: 0409-0201-10) served as positive control. Cells cultured in medium with 10%FBS served as negative control.
Co-culture
DiD-labeled (2 μM) PC3 cells (3 × 10⁵ cells) were co-cultured with murine osteoblast cell line MC3T3-E1 cells (3 × 10⁵ cells) in 10 cm dishes for 8 days. The resulting cells were incubated with a FITC-conjugated human specific HLA-ABC antibody (Biolegend, Cat #: 311404), where greater than 99% of the PC3 cells were positively stained, but not MC3T3-E1 cells. Thereafter, any transfer of DiD dye from PC3 cells to MC3T3-E1 cells was evaluated using flow cytometry.
In vivo subcutaneous implantation of DiD-stained PC3 cells
All experimental procedures were approved by the University of Michigan Committee for the Use and Care of Animals (UCUCA). Male 4- to 6-week-old severe combined immunodeficient (SCID) mice (Charles River, CB.17. SCID) were implanted subcutaneously with DiD-stained PC3 cells (2 × 10⁵ cells) within sterile collagen scaffolds (3 × 3 × 3 mm3; Gelfoam; Pfizer, Cat#: 09-0315-08) in the mid-dorsal region of each mouse (n = 3). Animals implanted with scaffolds alone during surgery were kept as negative controls (surgical control). After 3 weeks, primary tumors were collected and cells were filtered through a 40μm cell strainer (Fisher, Cat #: 22363547) to obtain single-cell suspensions. Thereafter, cells were incubated with a FITC-HLA-ABC antibody and the intensity of DiD dye in HLA-positive PC3 cells was analyzed with flow cytometry.
Controls
Biological positive and negative controls for assays performed in this study are provided in Supplemental Figure 1.
Primary data
Primary data for assays in which data are presented as fold change are provided in Supplemental Figure 2.
Statistical Methods
All numerical data are expressed as mean ± standard deviation unless specified otherwise. Two-tailed, unpaired Student’s t-test was used for data analysis, with P < 0.05 considered to be statistically significant.
Results
DiD can be used to indicate cell proliferation
To first determine if DiD is segregated into daughter cells after cell division or mitosis, as has been seen with other fluorescent dyes, PCa cell lines (PC3, DU145, C42B) were stained with DiD, and the intensity of fluorescent dye was analyzed by flow cytometry. As expected, all or nearly all PCa cells expressed DiD on their surfaces (Figure 1A). After 10 days of culture, the mean level of DiD fluorescence was significantly decreased, and a DiD-negative population was revealed (Figure 1A and Supplemental Figure 3). To determine the long-term retention capability of DiD dye, PCa cell lines were stained with either DiD dye or CFSE dye, which is a gold standard dye for monitoring cell proliferation, and then the levels of fluorescent intensity were compared over time. Surprisingly, cells containing DiD retained fluorescence longer than those with CFSE dye (Supplemental Figure 4). To determine if decrease in DiD intensity represented cell division, a separate experiment was performed measuring the coincident retention of EdU, an analog of BrdU, and DiD in dual labeled PCa cells was tracked over the course of culture. As expected, the intensity of DiD dye was well correlated to the retention of EdU (Figure 1B and C and Supplemental Figure 3).
To determine if DiD intensity correlates with cell proliferation, a DiD high intensity population and a DiD low intensity population were isolated using flow cytometric sorting, and proliferation in both populations was compared. Greater cell proliferation was detected in the DiD-low population compared to the DiD-high population by manually counting cell number (Figure 2A) and MTS proliferation assay (Figure 2B). In addition, a higher mitotic index was observed in the DiD-low population by measuring the level of a mitosis marker, phosphorylated-Histone H3 (Ser28) (Figure 2C). To determine whether the DiD intensity decreases as cells proliferate, DiD-stained cells were cultured in different serum condition (1% FBS vs. 10% FBS) to manipulate cell proliferation. As expected, cells cultured in 1% FBS proliferated more slowly than those cultured with 10% FBS (Figure 3A). Critically, the DiD intensity of cells cultured in 1% FBS remained high, while the DiD intensity of cells in 10% FBS dramatically decreased (Figure 3B).
Figure 2. Retention of DiD is correlated to PCa cell proliferation.

(A–C) PCa cells (PC3, DU145, C42B) were stained with DiD and cultured for 10 days. Thereafter, DiD-high and DiD-low cell subpopulations were isolated by fluorescence-activated cell sorting and cultured for 2 days. (A) The total cell number was counted using trypan blue exclusion; (B) Cell proliferation was measured by MTS assay; and (C) The mitotic index of cells was evaluated by measuring the mitosis marker phosphorylated-histone H3 (Ser28). Data are presented as mean ± standard deviation from triplicate determinations. *: P< 0.05 and #: P< 0.01 vs. DiD-high subpopulation.
DiD detection in vivo
As a preliminary to future studies of dormancy in tumors, we must first examine the duration of DiD intensity in an in vivo situation. To address this, DiD-stained PC3 cells were implanted into SCID mice subcutaneously. Surprisingly, more than 50% of PC3 cells still expressed DiD on their surface after 3 weeks of implantation, as compared to PC3 cells in in vitro culture, which expressed little or no DiD after 3 weeks (Figure 4A and B)
Figure 4. DiD detection in vivo.

To determine whether DiD is retained in cells in an in vivo situation, SCID mice were implanted with DiD-stained PC3 cells subcutaneously (n = 3 per group). After 3 weeks, the primary tumors were collected and cells were filtered through a 40μm cell strainer to obtain single-cell suspensions. The resulting cells were incubated first with a FITC-conjugated HLA-ABC antibody, where greater than 99% of the PC3 cells were positively stained. Thereafter, the intensity of DiD was analyzed with flow cytometry by gating on HLA-ABC. In vitro cultured PC3 cells served as a time control for tracking fluorescent intensity. (A) Representative flow cytometric analyses. (B) Quantification of (A). Data are presented as mean ± standard deviation from triplicate determinations. #: P< 0.01 vs. in vitro cultured cells.
DiD did not affect cell function or leak from the cells
As a prerequisite for long-term studies, labeling of cells for future dormancy investigations must not adversely affect cell viability or function. Therefore, to test whether DiD has adverse effects on normal cellular metabolism, several functional assays were performed, and to be sure of our ability to detect any adverse effects of DiD a dose four fold higher than that routinely used was included in these functional experiments. First, cell proliferation was compared between unstained cells, DiD-stained cells, and CFSE-stained cells. There were no significant differences between unstained cells and DiD-stained cells in cell proliferation as measured by MTS assay, even at higher levels of DiD (Figure 5A), while cell proliferation was inhibited in CFSE-stained cells (supplemental Figure 5A). Next, cell migration was assessed using an in vitro wound-healing assay. There was no effect of DiD on cell migration observed in this wound-healing model (Figure 5B), whereas CFSE suppressed cell migration (supplemental Figure 5B). Lastly, Annexin V assay and trypan blue exclusion revealed that DiD did not affect cell viability (Figure 5C, D), and neither did CFSE (Data now shown).
Figure 5. Effects of DiD on cell proliferation, migration, and apoptosis.

To determine possible adverse effects of DiD on cell function, PCa cells (PC3, DU145, C42B) were stained with DiD (0.5 μM and 2 μM), and a selection of functional assays were performed. (A) Cell proliferation was measured by MTS assay. (B) Cell migration was assessed using a wound-healing assay. Original magnification, 10x / 0.25 Ph1 ADL. Scale bars: 250 μm. After 2 days of DiD staining, (C) apoptosis was analyzed by flow cytometry with Annexin V staining and (D) the number of dead cells was counted by trypan blue staining. Data are presented as mean ± standard deviation from triplicate determinations.
Finally, to examine whether DiD leaks from the cells during cell culture and is taken up by unlabeled cells, direct cell-to-cell co-culture with a murine osteoblastic cell line, MC3T3-E1, was performed. Importantly, little or no DiD was detected in MC3T3-E1 cells even after 8 days of co-culture (Figure 6).
Figure 6. DiD is retained within the labeled cells in co-culture.
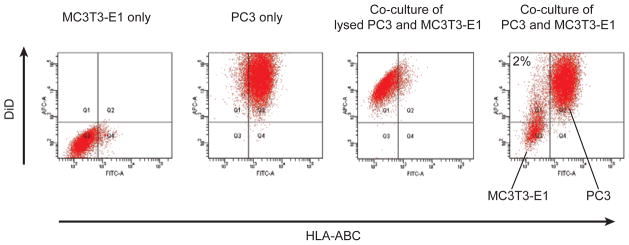
To determine whether DiD fluorescent dye transfers to neighboring cells, co-culture of DiD-labeled PC3 cells with non-labeled MC3T3-E1 cells was performed. At 8 days of co-culture, the resulting cells were incubated first with a FITC-conjugated HLA-ABC antibody to distinguish murine MC3T3-E1 cells (HLA-ABC negative) from human PCa cells (HLA-ABC positive). Greater than 99% of PC3 cells were positively stained. Thereafter, the DiD intensity of both PC3 cells and MC3T3-E1 cells was analyzed by flow cytometry, gating on HLA-ABC. The number indicated in the right dot plot represents the percentage of the DiD positive MC3T3-E1 cells. As a positive control, DiD-stained PC3 cells were lysed and added onto the MC3T3-E1 cells.
Discussion
In this study we demonstrated that DiD fluorescent dye can be a useful tool to trace the proliferation of cells by flow cytometry without requiring permeabilization or perturbing cellular functions. As expected, a marked decrease of fluorescent intensity was detected in DiD-stained PCa cells after 10 days of in vitro culture, compared to freshly stained cells. The EdU retention assay revealed that the decrease seen in DiD intensity correlates with cell division. Following this observation, determination of whether the distribution of fluorescence in cells is related to proliferative activity was performed. DiD-high and DiD-low cell populations were isolated using flow cytometry and then plated to evaluate any differences in proliferation. MTS assays revealed that the DiD-low population grew faster than the DiD-high population. In addition, a higher mitotic index was observed in the DiD-low population compared to the DiD-high population, as evaluated by phosphorylated-histone H3 (Ser28) expression. Conversely, DiD was retained for more than 3 weeks in vivo. Importantly, DiD staining did not cause any adverse effects on cell function, even when using a relatively high concentration of dye (2 μM): 1) MTS assay indicated that DiD did not affect proliferation of the cells; 2) trypan blue incorporation and Annexin V staining revealed that there was no difference in apoptosis between DiD-stained cells and unstained cells; and 3) a wound-healing assay provided evidence that DiD dye did not alter cell migration.
Tumor dormancy is a growing problem, however the mechanisms behind this transition to dormancy and how these cells then leave dormancy remain unknown. Therefore, to better understand the biology of tumor dormancy, there is a great need for a technology to track the proliferating fate of tumor cells both in vitro and in vivo. Fluorescent dye staining of cells is widely used to measure cell proliferation, since most of the dye is typically distributed equally between the daughter cells with each cell division, resulting in a reduction in intensity of fluorescence by half. Importantly, the stained cells can be recovered using flow cytometry without fixation and/or permeabilization. This is beneficial, since it allows us to isolate living cells, as well as to perform further analyses to address new research questions about tumor dormancy. In this study, DiD showed similar cell proliferation kinetics to that assessed by EdU, which is widely used to measure cell proliferation. However, labels like BrdU and EdU require cell fixation and permeabilization for the detection of cell proliferation, which limits the ability to perform other genetic or cell based analyses. In our study, the retention of DiD was inversely correlated to cell proliferation kinetics. Slowly dividing cells retained the high fluorescent intensity of DiD, while rapidly dividing cells lost DiD fluorescence over time. These findings suggest that DiD fluorescent dye is a powerful tool for the isolation of living cells, and enables the detection of cell proliferation ability over time, a marked advantage over the single time point methods.
Fluorescent dyes are classified into three major groups based on differences in affinity: (i) DNA-binding dye (e.g. Hoechst 33342); (ii) Cytoplasmic dye (e.g. Calcein, CFSE); and (iii) Membrane-bound dye (e.g. PKH26, DiD). DNA-binding dyes have been widely used for cell cycle analysis, since they provide information about DNA content distribution. These dyes are also useful tools for monitoring cell migration and trafficking both, in vitro and in vivo, because of their high retention (8). However, these dyes are not suitable for measuring long-term cell proliferation, since their intensity decreases in a short period of time (9) and they have potential direct effects on cell proliferation (10). Due to their longer retention ability, cytoplasmic dyes have been used for both cell migration and proliferation studies (11–13). However, these dyes exhibit high levels of toxicity to cells (14,15), since they affect the functions of cellular enzymes by binding to cytoplasmic proteins (16). Along this line, we found that CFSE inhibits cell proliferation and migration. Although further study would be needed, this suggests that cytoplasmic dyes are not appropriate tools for studying cell migration and proliferation. In contrast, membrane-bound dyes are likely to be less toxic (17,18), as is consistent with our findings. Even a high concentration of DiD (2 μM) had no effect on cell proliferation, migration, and apoptosis. Additionally, membrane-bound dyes are well recognized for their potential use in cell migration and proliferation assays, made possible by their long retention (19–21). PKH26 is one of the membrane-bound dyes widely used to assess cell proliferation, however it is relatively expensive. Using DiD dye, we found that a decrease of DiD intensity was seen with cell division, that the level of DiD intensity is correlated to cell proliferation, and that DiD did not affect cellular function. Furthermore, the cost of staining cells with DiD is significantly less than PKH26.
Bone marrow has been well established as a regulatory site for hematopoietic function. In the marrow, HSCs are believed to localize to a specific microenvironment, the “niche”, where they reside in a dormant state (25). Several studies have shown that DTCs shed from a primary tumor may lie dormant in distant tissues for long periods of time, retaining the potential for activation resulting in metastatic growth (22–24). Additionally, growing evidence has suggested that disseminated PCa also resides within the marrow niche (26). In fact, disseminated PCa uses similar mechanisms as HSCs to gain access to the marrow microenvironment (5,27–30), and DTCs target and displace HSCs, establishing metastatic foci within the hematopoietic niche (6). As a result, these cells parasitize the niche to become dormant, utilizing the mechanisms that keep HSCs in a dormant state. In addition, recent studies have demonstrated that the presence of DTCs is a major therapeutic challenge, since dormancy enables escape from the current cytotoxic treatments which target rapidly dividing cells, leaving the potential for later regrowth into full-blown metastases (31). In the current study, the intensity of DiD in cells implanted in animals was retained longer than that in in vitro cell culture. This finding follows the hypothesis that tumor cells become dormant in vivo. Although further study is clearly warranted, our in vivo finding suggests that the proposed technique may aid in addressing the biology of tumor dormancy.
In conclusion, our study demonstrated that DiD provides stable fluorescent labeling of live cells, which helps monitor cell proliferation over time both in vitro and in vivo without damaging cell functions, such as cell proliferation, migration, and apoptosis. Moreover, this system does not require any genetic manipulation. Although further analysis is necessary, our study indicates that DiD can be a safe, economical, and powerful tool for identifying cell proliferation, which may lead to a better understanding of the mechanisms underlying tumor dormancy.
Supplementary Material
Acknowledgments
Grant supports:
Contract grant sponsor: National Cancer Institute; Contract grant number: CA093900, CA163124.
Contract grant sponsor: Department of Defense.
Contract grant sponsor: Prostate Cancer Foundation.
We thank Dr. Stephanie Daignault-Newton for her excellent statistical assistance. This work is directly supported by the National Cancer Institute (CA093900, R.S. Taichman, CA163124, Y. Shiozawa and R.S. Taichman), the Department of Defense (R.S. Taichman), and the Prostate Cancer Foundation (Y. Shiozawa and R.S. Taichman).
References
- 1.Riethdorf S, Pantel K. Disseminated tumor cells in bone marrow and circulating tumor cells in blood of breast cancer patients: current state of detection and characterization. Pathobiology. 2008;75:140–8. doi: 10.1159/000123852. [DOI] [PubMed] [Google Scholar]
- 2.Hensel JA, Flaig TW, Theodorescu D. Clinical opportunities and challenges in targeting tumour dormancy. Nat Rev Clin Oncol. 2013;10:41–51. doi: 10.1038/nrclinonc.2012.207. [DOI] [PubMed] [Google Scholar]
- 3.Ranganathan AC, Adam AP, Aguirre-Ghiso JA. Opposing roles of mitogenic and stress signaling pathways in the induction of cancer dormancy. Cell Cycle. 2006;5:1799–807. doi: 10.4161/cc.5.16.3109. [DOI] [PMC free article] [PubMed] [Google Scholar]
- 4.Muller A, Homey B, Soto H, Ge N, Catron D, Buchanan ME, McClanahan T, Murphy E, Yuan W, Wagner SN, et al. Involvement of chemokine receptors in breast cancer metastasis. Nature. 2001;410:50–6. doi: 10.1038/35065016. [DOI] [PubMed] [Google Scholar]
- 5.Taichman RS, Cooper C, Keller ET, Pienta KJ, Taichman NS, McCauley LK. Use of the stromal cell-derived factor-1/CXCR4 pathway in prostate cancer metastasis to bone. Cancer Res. 2002;62:1832–7. [PubMed] [Google Scholar]
- 6.Shiozawa Y, Pedersen EA, Havens AM, Jung Y, Mishra A, Joseph J, Kim JK, Patel LR, Ying C, Ziegler AM, et al. Human prostate cancer metastases target the hematopoietic stem cell niche to establish footholds in mouse bone marrow. J Clin Invest. 2011;121:1298–312. doi: 10.1172/JCI43414. [DOI] [PMC free article] [PubMed] [Google Scholar]
- 7.Wu TT, Sikes RA, Cui Q, Thalmann GN, Kao C, Murphy CF, Yang H, Zhau HE, Balian G, Chung LW. Establishing human prostate cancer cell xenografts in bone: induction of osteoblastic reaction by prostate-specific antigen-producing tumors in athymic and SCID/bg mice using LNCaP and lineage-derived metastatic sublines. Int J Cancer. 1998;77:887–94. doi: 10.1002/(sici)1097-0215(19980911)77:6<887::aid-ijc15>3.0.co;2-z. [DOI] [PubMed] [Google Scholar]
- 8.Brenan M, Parish CR. Intracellular fluorescent labelling of cells for analysis of lymphocyte migration. J Immunol Methods. 1984;74:31–8. doi: 10.1016/0022-1759(84)90364-8. [DOI] [PubMed] [Google Scholar]
- 9.Ludowyk PA, Willenborg DO, Parish CR. Selective localisation of neuro-specific T lymphocytes in the central nervous system. J Neuroimmunol. 1992;37:237–50. doi: 10.1016/0165-5728(92)90008-9. [DOI] [PubMed] [Google Scholar]
- 10.Zhang X, Kiechle FL. Hoechst 33342-induced apoptosis is associated with intracellular accumulation of E2F-1 protein in BC3H-1 myocytes and HL-60 cells. Arch Pathol Lab Med. 2001;125:99–104. doi: 10.5858/2001-125-0099-HIAIAW. [DOI] [PubMed] [Google Scholar]
- 11.Lyons AB, Parish CR. Determination of lymphocyte division by flow cytometry. J Immunol Methods. 1994;171:131–7. doi: 10.1016/0022-1759(94)90236-4. [DOI] [PubMed] [Google Scholar]
- 12.Parish CR, Glidden MH, Quah BJ, Warren HS. Use of the intracellular fluorescent dye CFSE to monitor lymphocyte migration and proliferation. Curr Protoc Immunol. 2009;Chapter 4(Unit4 9) doi: 10.1002/0471142735.im0409s84. [DOI] [PubMed] [Google Scholar]
- 13.Matera G, Lupi M, Ubezio P. Heterogeneous cell response to topotecan in a CFSE-based proliferation test. Cytometry A. 2004;62:118–28. doi: 10.1002/cyto.a.20097. [DOI] [PubMed] [Google Scholar]
- 14.Quah BJ, Warren HS, Parish CR. Monitoring lymphocyte proliferation in vitro and in vivo with the intracellular fluorescent dye carboxyfluorescein diacetate succinimidyl ester. Nat Protoc. 2007;2:2049–56. doi: 10.1038/nprot.2007.296. [DOI] [PubMed] [Google Scholar]
- 15.Last’ovicka J, Budinsky V, Spisek R, Bartunkova J. Assessment of lymphocyte proliferation: CFSE kills dividing cells and modulates expression of activation markers. Cell Immunol. 2009;256:79–85. doi: 10.1016/j.cellimm.2009.01.007. [DOI] [PubMed] [Google Scholar]
- 16.Parish CR. Fluorescent dyes for lymphocyte migration and proliferation studies. Immunol Cell Biol. 1999;77:499–508. doi: 10.1046/j.1440-1711.1999.00877.x. [DOI] [PubMed] [Google Scholar]
- 17.Honig MG, Hume RI. Fluorescent carbocyanine dyes allow living neurons of identified origin to be studied in long-term cultures. J Cell Biol. 1986;103:171–87. doi: 10.1083/jcb.103.1.171. [DOI] [PMC free article] [PubMed] [Google Scholar]
- 18.Honig MG, Hume RI. Dil and diO: versatile fluorescent dyes for neuronal labelling and pathway tracing. Trends Neurosci. 1989;12:333–5. 340–1. [PubMed] [Google Scholar]
- 19.Boutonnat J, Muirhead KA, Barbier M, Mousseau M, Ronot X, Seigneurin D. PKH26 probe in the study of the proliferation of chemoresistant leukemic sublines. Anticancer Res. 1998;18:4243–51. [PubMed] [Google Scholar]
- 20.Ashley DM, Bol SJ, Waugh C, Kannourakis G. A novel approach to the measurement of different in vitro leukaemic cell growth parameters: the use of PKH GL fluorescent probes. Leuk Res. 1993;17:873–82. doi: 10.1016/0145-2126(93)90153-c. [DOI] [PubMed] [Google Scholar]
- 21.Allsopp CE, Nicholls SJ, Langhorne J. A flow cytometric method to assess antigen-specific proliferative responses of different subpopulations of fresh and cryopreserved human peripheral blood mononuclear cells. J Immunol Methods. 1998;214:175–86. doi: 10.1016/s0022-1759(98)00056-8. [DOI] [PubMed] [Google Scholar]
- 22.Pantel K, Alix-Panabieres C, Riethdorf S. Cancer micrometastases. Nat Rev Clin Oncol. 2009;6:339–51. doi: 10.1038/nrclinonc.2009.44. [DOI] [PubMed] [Google Scholar]
- 23.Morgan TM, Lange PH, Porter MP, Lin DW, Ellis WJ, Gallaher IS, Vessella RL. Disseminated tumor cells in prostate cancer patients after radical prostatectomy and without evidence of disease predicts biochemical recurrence. Clin Cancer Res. 2009;15:677–83. doi: 10.1158/1078-0432.CCR-08-1754. [DOI] [PMC free article] [PubMed] [Google Scholar]
- 24.Nash KT, Phadke PA, Navenot JM, Hurst DR, Accavitti-Loper MA, Sztul E, Vaidya KS, Frost AR, Kappes JC, Peiper SC, et al. Requirement of KISS1 secretion for multiple organ metastasis suppression and maintenance of tumor dormancy. J Natl Cancer Inst. 2007;99:309–21. doi: 10.1093/jnci/djk053. [DOI] [PMC free article] [PubMed] [Google Scholar]
- 25.Taichman RS. Blood and bone: two tissues whose fates are intertwined to create the hematopoietic stem-cell niche. Blood. 2005;105:2631–9. doi: 10.1182/blood-2004-06-2480. [DOI] [PubMed] [Google Scholar]
- 26.Shiozawa Y, Havens AM, Pienta KJ, Taichman RS. The bone marrow niche: habitat to hematopoietic and mesenchymal stem cells, and unwitting host to molecular parasites. Leukemia. 2008;22:941–50. doi: 10.1038/leu.2008.48. [DOI] [PMC free article] [PubMed] [Google Scholar]
- 27.Sun YX, Schneider A, Jung Y, Wang J, Dai J, Cook K, Osman NI, Koh-Paige AJ, Shim H, Pienta KJ, et al. Skeletal localization and neutralization of the SDF-1(CXCL12)/CXCR4 axis blocks prostate cancer metastasis and growth in osseous sites in vivo. J Bone Miner Res. 2005;20:318–29. doi: 10.1359/JBMR.041109. [DOI] [PubMed] [Google Scholar]
- 28.Shiozawa Y, Havens AM, Jung Y, Ziegler AM, Pedersen EA, Wang J, Lu G, Roodman GD, Loberg RD, Pienta KJ, et al. Annexin II/annexin II receptor axis regulates adhesion, migration, homing, and growth of prostate cancer. J Cell Biochem. 2008;105:370–80. doi: 10.1002/jcb.21835. [DOI] [PMC free article] [PubMed] [Google Scholar]
- 29.Sun YX, Wang J, Shelburne CE, Lopatin DE, Chinnaiyan AM, Rubin MA, Pienta KJ, Taichman RS. Expression of CXCR4 and CXCL12 (SDF-1) in human prostate cancers (PCa) in vivo. J Cell Biochem. 2003;89:462–73. doi: 10.1002/jcb.10522. [DOI] [PubMed] [Google Scholar]
- 30.Sun YX, Fang M, Wang J, Cooper CR, Pienta KJ, Taichman RS. Expression and activation of alpha v beta 3 integrins by SDF-1/CXC12 increases the aggressiveness of prostate cancer cells. Prostate. 2007;67:61–73. doi: 10.1002/pros.20500. [DOI] [PubMed] [Google Scholar]
- 31.Indraccolo S, Stievano L, Minuzzo S, Tosello V, Esposito G, Piovan E, Zamarchi R, Chieco-Bianchi L, Amadori A. Interruption of tumor dormancy by a transient angiogenic burst within the tumor microenvironment. Proc Natl Acad Sci U S A. 2006;103:4216–21. doi: 10.1073/pnas.0506200103. [DOI] [PMC free article] [PubMed] [Google Scholar]
Associated Data
This section collects any data citations, data availability statements, or supplementary materials included in this article.