

Abstract
Fanconi anemia (FA) is a genetically heterogeneous syndrome associated with increased cancer predisposition. The underlying genes govern the FA pathway which functions to protect the genome during the S-phase of the cell cycle. While upregulation of FA genes has been linked to chemotherapy resistance, little is known about their regulation in response to proliferative stimuli. The purpose of this study was to examine how FA genes are regulated, especially in relation to the cell cycle, in order to reveal their possible participation in biochemical networks. Expression of 14 FA genes was monitored in two human cell-cycle models and in two RB1/E2F pathway-associated primary cancers, retinoblastoma and basal breast cancer. In silico studies were performed to further evaluate coregulation and identify connected networks and diseases. Only FANCA was consistently induced over 2-fold; FANCF failed to exhibit any regulatory fluctuations. Two tools exploiting public data sets indicated coregulation of FANCA with BRCA1. Upregulation of FANCA and BRCA1 correlated with upregulation of E2F3. Genes coregulated with both FANCA and BRCA1 were enriched for MeSH-Term id(s) genomic instability, microcephaly, and Bloom syndrome, and enriched for the cellular component centrosome. The regulation of FA genes appears highly divergent. In RB1-linked tumors, upregulation of FA network genes was associated with reduced expression of FANCF. FANCA and BRCA1 may jointly act in a subnetwork - supporting vital function(s) at the subcellular level (centrosome) as well as at the level of embryonic development (mechanisms controlling head circumference).
Electronic supplementary material
The online version of this article (doi:10.1186/2193-1801-3-381) contains supplementary material, which is available to authorized users.
Keywords: Fanconi anemia, Functional genomics, Retinoblastoma, Breast cancer, FANCA, BRCA1
1 Background
Fanconi anemia (FA) is a rare, recessive, genetically heterogeneous, chromosomal instability disorder, characterized by developmental abnormalities, retarded growth, bone marrow failure, and a high risk for the development of cancer (Auerbach et al. 2001; Alter 2003; Rosenberg et al. 2003; Kutler et al. 2003). Fanconi anemia patient-derived cells are extremely sensitive to bifunctional alkylating or DNA interstrand cross-linking agents, such as mitomycin C and cisplatin (Ishida and Buchwald 1982; Wang 2007).
Currently, sixteen FA genes have been identified, each corresponding to a distinct ‘complementation group’: FA-A, -B, -C, -D1, -D2, -E, -F, -G, -I, -J, -L, -M, -N, -O, -P, and -Q (Strathdee et al. 1992; Pronk et al. 1995; Apostolou et al. 1996; Lo Ten Foe et al. 1996; de Winter et al. 1998, 2000a, b; Waisfisz et al. 1999; Timmers et al. 2001; Howlett et al. 2002; Meetei et al. 2003, 2004, 2005; Levitus et al. 2005; Levran et al. 2005a; Dorsman et al. 2007; Xia et al. 2007; Smogorzewska et al. 2007; Sims et al. 2007; Vaz et al. 2010; Kim et al. 2011; Stoepker et al. 2011; Bogliolo et al. 2013); the most common groups being FA-A, -C, and -G, together accounting for 85% of all FA patients (Levran et al. 2005b; de Winter and Joenje 2009).
To maintain genome integrity, the FA proteins function together in the so-called FA/BRCA-pathway to repair DNA damage, such as double strands breaks (DSBs). The FA/BRCA-pathway is divided into an upstream and a downstream branch in relation to the monoubiquitination of FANCD2 and FANCI, which is considered a central activating reaction. This reaction is catalyzed by the so-called core complex, which is thought to be assembled via subcomplexes. These complexes are FANC-A and -G; FANC-B and -L; FANC-E, -C, and -F. Together with FANCM these proteins constitute the core complex (Medhurst et al. 2006). The activation of FANCD2 and FANCI coordinates the activities of FA proteins that act downstream in the pathway leading to DNA repair: FANCD1/BRCA2, FANCJ/BRIP1, FANCN/PALB2, FANCO/RAD51C, FANCP/SLX4, FANCQ/ERCC4/XPF and XRCC2. Homozygous germ line mutations in BRCA1 can result in a Fanconi anemia-like phenotype (Domchek et al. 2013; D’Andrea 2013), BRCA1 may thus be considered an FA-like gene whose action may thus be closely connected to the FA pathway.
In addition to their involvement in the canonical FA/BRCA-pathway acting either in the upstream, central, or downstream part, additional protein complexes of FA proteins have been described that may serve distinct or related functions, such as FANCD1/BRCA2-FANCD2-FANCG-XRCC3 (Wilson et al. 2008), and FANCA-BRCA1 (Folias et al. 2002). Moreover, some FA proteins appear to function in additional, seemingly unrelated, processes such as oxidative metabolism, cell cycle progression, apoptosis, and transcriptional regulation, which may be relevant for some of the pathological features of FA (Kaddar and Carreau 2012).
Biallelic mutations in the genes underlying the FA/BRCA-pathway cause predisposition to malignancies in FA patients. On the other hand, there is evidence that a proportion of cancers arising in the (non-FA) general populations (‘sporadic cancers’) may possess a disrupted FA/BRCA pathway (Stecklein and Jensen 2012). The status of this pathway appears to be relevant for cancer treatment response. Repression has been associated with a favorable response against cross-linking drugs (Chen et al. 2005; Stecklein and Jensen 2012), whereas hyperactivation might be responsible for resistance to such drugs.
Upregulation of several FA genes, especially during S phase, has been linked to the RB1/E2F pathway (Tategu et al. 2007; Hoskins et al. 2008; Kim and D’Andrea 2012), which is known to control cell cycle progression (Nevins 2001; Chen et al. 2009; Knudsen and Wang 2010). This pathway plays an important role in transcriptional regulation during the cell cycle. Proteins of the RB1 family, pRb, p107 and p130 work together with the sequence-specific DNA-binding factors of the E2F family which consists of the activators E2F1-E2F3 and repressors E2F4-E2F8 (Chen et al. 2009; Di Fiore et al. 2013). During growth arrest, E2F activity can be repressed by the RB1 protein family via protein-protein interactions, while during progression to the cell cycle from G1 to S phase phosphorylation of the RB1 family members results into E2F activation (Henley and Dick 2012). Since disruption of the RB1/E2F pathway and upregulation of E2F target genes is frequently observed in human cancers (Nevins 2001; Chen et al. 2009; Knudsen and Wang 2010) upregulation of (a subset) of FA genes may be a common feature for tumors with a disrupted RB1 pathway.
In this study we monitored expression of 14 FA genes during the cell cycle and in cancers with a disrupted RB1/E2F pathway, in an attempt to identify gene expression patterns that characterize two important interconnected pathways, i.e. the FA and RB1/E2F pathways.
2 Results
2.1 Upregulation of the FA mRNA level upon progression through the cell cycle in two cell models
To study the expression of FA genes during the cell cycle, we used the established human cell-cycle model T98G derived from glioblastoma cells (Stein 1979). T98G cells can be efficiently arrested via serum deprivation, while after serum stimulation a synchronized progression through the cell cycle can be observed. T98G cells express abundant levels of E2F activity and possess a functional RB pathway (Takahashi et al. 2000). Fluorescent Activated Cell Sorting (FACS) analysis and CCNE2 expression confirmed the proper synchronization of the cells (Figure 1a - left and right panel).
Figure 1.
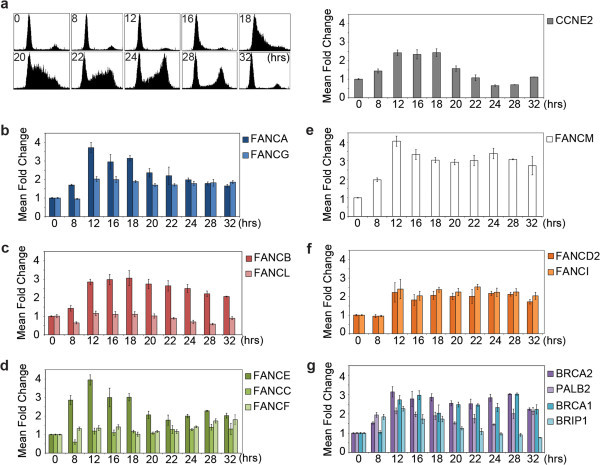
Differential cell cycle regulation of FA genes in human T98G cells. (a-left panel) FACS analysis of synchronized cells, the 0, 8, 12, 16, 18, 20, 22, 24, 28, and 32 hr time points are shown; S phase is most pronounced between 18–22 hrs. Data of FACS represents one representative synchronization (a-right panel) Control experiment: The mRNA levels of CCNE2 during the cell cycle are shown. Quantitative RT-PCR was performed on total RNA samples from different time points and mean fold changes (MFC) were calculated relative to time point zero. Data represents the average mean fold change of 2–3 independent synchronization each in duplicate qPCR measurement (except for time points: 28 and 32) (b-g) Relative gene expression during the cell cycle for genes encoding in the FA/BRCA-pathway.
The mRNA expression levels of the following endogenous FA genes (FANC-A, -B, -C, -E, -F, -G, -L, -M, -D2, -I, -D1, -N, -J, and BRCA1) were analyzed with RT-qPCR. Changes in mRNA levels were subsequently calculated relative to time point zero. Several of the FA genes turned out to be prominently induced during the cell cycle progression (Figure 1b-g), e.g. FANCA (Figure 1b) while other FA genes, like FANCL (Figure 1c) and FANCF (Figure 1d) showed a relatively constitutive expression pattern during the cell cycle.
We also compared the expression of endogenous FA genes during the cell cycle in human diploid fibroblasts (EVA-F) via serum deprivation (Additional file 1: Figure S1). FACS analysis (Additional file 1: Figure S1a - left panel) and expression analysis of CCNE2 confirmed the proper synchronization of the cells (Additional file 1: Figure S1a - right panel). In this instance, also a subset of the FA genes turned out to be prominently upregulated during the cell cycle relative to time point zero, again FANCA (Additional file 1: Figure S1b), but also FANCD2 (Additional file 1: Figure S1f) and BRIP1 (Additional file 1: Figure S1g); while other FA genes, like again FANCL (Additional file 1: Figure S1c) and FANCF (Additional file 1: Figure S1d), were less affected during the cell cycle progression.
2.2 Upregulation of FA gene expression in cancers associated with disrupted RB1/E2F pathway
To study the upregulation of the FA/BRCA-pathway in cancers with a disrupted RB1/E2F pathway, two different primary human tumors, retinoblastoma (Rb) and basal breast cancer were studied. The vast majority of retinoblastomas harbors mutations in RB1 (Dunn et al. 1988), while it has been recently recognized that functional loss of RB1 is a common event in basal like breast tumors (Herschkowitz et al. 2008). To discriminate between upregulation caused by altered regulation of expression or by DNA copy number alteration (CNA), we determined the correlation between CNA and mRNA expression of FA/BRCA genes (Henrichsen et al. 2009; Dear 2009; Kuiper et al. 2010).
2.2.1 Upregulation of FA genes in RB1-mutated retinoblastoma versus fetal retina
We analyzed the gene expression in a cohort of primary retinoblastoma tumors and compared that to healthy fetal retina samples. We found a significant upregulation in retinoblastoma tumors (most significant Fold Changes [FCs] indicated, for all probes and corresponding FCs see Table 1), for the core complex members: FANCA (FC = 3.54, P = 2.32E-06), FANCC (FC = 1.48, P = 3.25E-03), FANCE (FC = 1.93, P = 2.07E-02), FANCG (FC = 4.00, P = 1.52E-07), FANCL (FC = 2.65, P = 4.95E-09), FANCM (FC = 1.51, P = 2.08E-02); central players: FANCD2 (FC = 1.95, P = 4.68E-03) and FANCI (FC = 2.69, P = 1.55E-03); and for the downstream branch: FANCD1/BRCA2 (FC = 2.90, P = 4.65E-04), FANCN/PALB2 (FC = 2.18, P = 8.70E-09), and BRCA1 (FC = 2.05, P = 2.13E-04) compared to healthy fetal retina. For the core complex member FANCF we found a significant downregulation (FC = -1.81, P = 1.30E-04). For the core complex member FANCB and downstream branch member FANCJ/BRIP1 no significant differences were detected compared to healthy fetal retina. The upregulation of FANCE was driven by CNA since a linear statistical significant correlation was found between CNA and mRNA expression (FDR P-value cut-off 5.00E-02; Table 2).
Table 1.
Gene expression in Retinoblastoma tumors versus fetal retina
| Part | Gene symbol | Probe ID | Fold change | P-value* |
|---|---|---|---|---|
| Core complex | FANCA | 203805_PM_s_at | 2.20 | 6.06E-03 |
| FANCA | 203806_PM_s_at | 3.54 | 2.32E-06 | |
| FANCA | 236976_PM_at | 4.00 | 2.68E-06 | |
| FANCC | 242654_PM_at | 1.48 | 3.25E-03 | |
| FANCC | 205189_PM_s_at | 1.49 | 2.77E-02 | |
| FANCC | 1559513_PM_a_at | 1.52 | 6.28E-03 | |
| FANCE | 220255_PM_at | 1.93 | 2.07E-02 | |
| FANCF | 218689_PM_at | -1.81 | 1.30E-04 | |
| FANCF | 222713_PM_s_at | -1.37 | 2.65E-02 | |
| FANCG | 203564_PM_at | 4.00 | 1.52E-07 | |
| FANCL | 218397_PM_at | 2.65 | 4.95E-09 | |
| FANCM | 234733_PM_s_at | 1.51 | 2.08E-02 | |
| FANCM | 242711_PM_x_at | 1.56 | 2.27E-02 | |
| Central players | FANCD2 | 242560_PM_at | 1.95 | 4.68E-03 |
| FANCI | 223785_PM_at | 1.69 | 2.47E-02 | |
| FANCI | 213008_PM_at | 2.55 | 3.08E-03 | |
| FANCI | 213007_PM_at | 2.69 | 1.55E-03 | |
| Downstrem branch | BRCA2 | 214727_PM_at | 2.31 | 5.87E-03 |
| BRCA2 | 208368_PM_s_at | 2.90 | 4.65E-04 | |
| PALB2 | 219530_PM_at | 2.18 | 8.70E-09 | |
| BRCA1 | 204531_PM_s_at | 2.05 | 2.13E-04 | |
| Acitvating E2Fs | E2F1 | 204947_PM_at | 1.61 | 5.47E-03 |
| E2F1 | 2028_PM_s_at | 1.86 | 2.56E-03 | |
| E2F2 | 228361_PM_at | 2.84 | 2.31E-04 | |
| E2F3 | 203692_PM_s_at | 3.50 | 1.94E-08 | |
| E2F3 | 203693_PM_s_at | 3.72 | 2.18E-10 | |
| Control | CCNE2 | 211814_PM_s_at | 7.77 | 3.13E-10 |
| CCNE2 | 205034_PM_at | 8.88 | 1.22E-11 |
*Cutoff P-value < 0.05.
Table 2.
Significant correlation copy number variation and mRNA in retinoblastoma
| Gene symbol | Probe ID | Linear correlation | P-value | FDR P-value* |
|---|---|---|---|---|
| FANCE | 220255_PM_at | 2.25 | 2.03E-07 | 3.24E-05 |
| E2F3 | 203692_PM_s_at | 1.65 | 1.99E-08 | 5.78E-06 |
| E2F3 | 203693_PM_s_at | 1.50 | 1.81E-08 | 5.34E-06 |
*Cutoff FDR P-value < 0.05.
Interestingly, in MYCN-amplified (without RB1 mutations) retinoblastoma (Rushlow et al. 2013) compared to RB1-mutated retinoblastomas, we found a significant downregulation of the core complex members: FANCA (FC = -3.99, P = 3.69E-03), FANCC (FC = -1.91, P = 1.46E-02), FANCL (FC = -2.56, P = 2.72E-06), FANCM (FC = -2.07, P = 2.16E-02); central player: FANCI (FC = -3.74, P = 1.56E-02); and downstream branch member BRCA1 (FC = -2.36, P = 8.85E-03; Additional file 2: Table S1) compared to classic retinoblastoma (with RB1 mutations). This provided additional evidence that the disrupted RB1/E2F-pathway in the RB1-mutated retinoblastoma tumors may play a role in upregulation of the FA/BRCA-pathway members.
2.2.2 Upregulation of FA genes in basal versus not-basal breast tumors
We compared 41 basal breast tumors (27 BRCA1-mutated) and 79 not-basal breast tumors (8 BRCA1 mutated) for FA gene expression (Table 3). A significant upregulation in basal breast tumors compared to not-basal tumors was found for the core complex members: FANCA (FC = 3.40, P = 1.93E-13), FANCB (FC = 4.73, P = 5.18E-12), FANCC (FC = 1.38, P = 3.38E-04), FANCE (FC = 1.62, P = 2.80E-08), FANCG (FC = 1.39, P = 1.52E-06), FANCL (FC = 1.52, P = 3.79E-06); central players: FANCD2 (FC = 1.66, P = 4.57E-06) and FANCI (FC = 1.98, P = 1.46E-06); and for the downstream branch: FANCD1/BRCA2 (FC = 1.96, P = 3.45E-09), and FANCJ/BRIP1 (FC = 1.96, P = 5.75E-05). A significant downregulation was found for the core complex members FANCF (FC = -1.29, P = 2.60E-03), and FANCM (FC = -1.28, P = 1.26E-02). No significant differences were detected for the downstream branch member: FANCN/PALB2. The expression status of BRCA1 is influenced by mutation status therefore we consider it unknown.
Table 3.
Gene expression in basal breast tumors versus not-basal
| Part | Gene symbol | Probe ID | Fold change | P-value* |
|---|---|---|---|---|
| Core complex | FANCA | 215530_at | 1.51 | 6.41E-03 |
| FANCA | 236976_at | 2.07 | 7.57E-04 | |
| FANCA | 203806_s_at | 3.06 | 2.74E-12 | |
| FANCA | 203805_s_at | 3.40 | 1.93E-13 | |
| FANCB | 243597_at | 1.95 | 5.10E-05 | |
| FANCB | 1553244_at | 2.38 | 1.26E-05 | |
| FANCB | 1557217_a_at | 3.06 | 3.02E-07 | |
| FANCB | 1557218_s_at | 4.73 | 5.18E-12 | |
| FANCC | 205189_s_at | 1.38 | 3.38E-04 | |
| FANCE | 220255_at | 1.62 | 2.80E-08 | |
| FANCF | 218689_at | -1.29 | 2.60E-03 | |
| FANCG | 203564_at | 1.39 | 1.52E-06 | |
| FANCL | 218397_at | 1.52 | 3.79E-06 | |
| FANCM | 242711_x_at | -1.28 | 1.26E-02 | |
| Central players | FANCD2 | 242560_at | 1.66 | 4.57E-06 |
| FANCD2 | 223545_at | 1.74 | 2.22E-05 | |
| FANCI | 223785_at | 1.60 | 1.17E-05 | |
| FANCI | 213007_at | 1.80 | 1.53E-06 | |
| FANCI | 213008_at | 1.98 | 1.46E-06 | |
| Downstrem branch | BRCA2 | 208368_s_at | 1.96 | 3.45E-09 |
| BRCA2 | 214727_at | 1.76 | 6.74E-08 | |
| BRIP1 | 221703_at | 2.04 | 1.28E-03 | |
| BRIP1 | 221703_at | 2.04 | 1.28E-03 | |
| BRIP1 | 221703_at | 2.04 | 1.28E-03 | |
| BRIP1 | 235609_at | 1.96 | 5.75E-05 | |
| Acitvating E2Fs | E2F1 | 2028_s_at | 1.63 | 1.89E-05 |
| E2F1 | 204947_at | 2.01 | 8.72E-06 | |
| E2F2 | 235582_at | 1.55 | 2.28E-02 | |
| E2F2 | 228361_at | 1.98 | 2.97E-07 | |
| E2F3 | 203692_s_at | 1.95 | 8.13E-17 | |
| E2F3 | 203693_s_at | 2.21 | 1.12E-12 |
*Cutoff P-value < 0.05.
The correlation between CNA and mRNA expression of FA/BRCA genes was determined in the basal breast tumors (n = 41; Table 4). Statistical significant linear correlation (FDR P-value cut-off 5.00E-02) was found for FANCI and FANCF showing a strong linear correlation (> 0.60), suggesting that differences in gene expression are driven by CNAs.
Table 4.
Significant correlation copy number variation and mRNA in basal-like tumors
| Gene symbol | Probe ID | Linear correlation * | P-value | FDR P-value** |
|---|---|---|---|---|
| FANCI | 213007_at | 0.77 | 3.23E-09 | 1.61E-07 |
| FANCF | 222713_s_at | 0.73 | 4.93E-08 | 1.23E-06 |
| FANCI | 213008_at | 0.72 | 9.63E-08 | 1.61E-06 |
| E2F3 | 203693_s_at | 0.70 | 4.05E-07 | 5.06E-06 |
| FANCF | 218689_at | 0.68 | 1.19E-06 | 1.19E-05 |
| E2F3 | 203693_s_at | 0.66 | 3.04E-06 | 2.54E-05 |
| E2F3 | 203692_s_at | 0.60 | 3.75E-05 | 2.68E-04 |
*Cutoff > 0.60; **Cutoff FDR P-value < 0.05.
2.3 E2Finvolvement
To determine which E2F transcription factors could be associated with upregulation of FA genes, we studied also the mRNA expression levels of activating E2F genes (E2F1, E2F2, E2F3) in RB1-mutated retinoblastoma and in basal breast tumors.
In RB1-mutated retinoblastoma, all three activating E2Fs were significantly upregulated: E2F1 (FC = 1.86, P = 2.56E-03), E2F2 (FC = 2.84, P = 2.31E-04), and E2F3 (FC = 3.72, P = 2.18E-10; Table 1). Upregulation of the activating E2F genes was also found in basal versus not-basal breast cancer: E2F1 (FC = 2.01, P = 8.72E-06), E2F2 (FC = 1.98, P = 2.97E-07), and E2F3 (FC = 1.95, P = 8.13E-17; Table 3). Importantly, E2F3 upregulation was in both cases (retinoblastoma and basal breast cancer) driven by a CNA, since a strong correlation was found between CNA and mRNA expression (FDR P-value cut-off 5.00E-02; Tables 2 and 4).
2.4 Differential regulation of FA/BRCA genes
Established cell-cycle and E2F target genes, such as CCNE2 are commonly robustly regulated by proliferative stimuli (see also Figure 1 and Additional file 1: Figure S1). To further group FA/BRCA genes in relation to cell cycle regulation and induction by proliferative stimuli we used two decision trees (Figure 2). For each criterion in the decision trees, genes received points which are summarized in Table 5.
Figure 2.
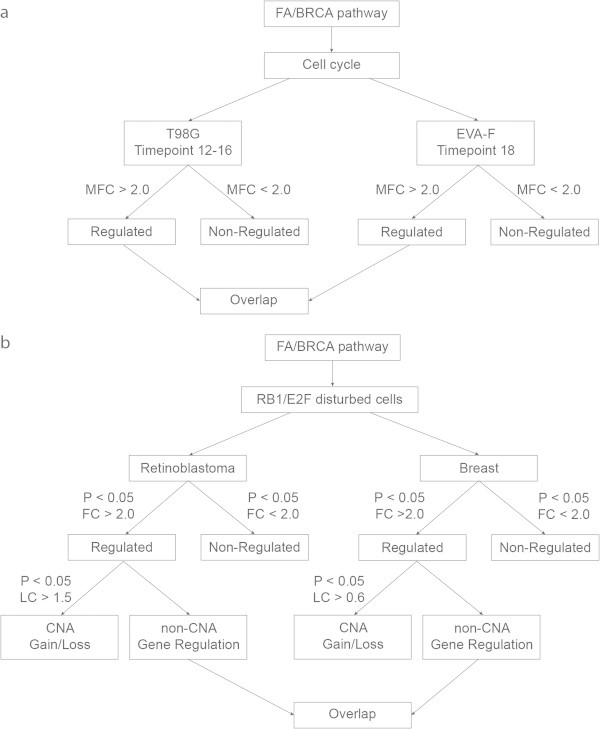
Decision tree(s) to select coregulated genes. (a) Decision tree for selecting FA/BRCA genes that are regulated through the cell cycle. (b) Decision tree to select FA/BRCA genes in RB1/E2F disturbed cells. Two cell models: retinoblastoma and breast cancer cells are screened. In both models a selection is made for “Regulated” or “Non-Regulated”. In case of “Regulated” a selection is made on the possible influence of copy number alterations (CNA). Abbreviations: P = P-value; MFC = mean fold change; FC = fold change; LC = linear correlation; CNA = copy number alteration.
Table 5.
Scoring scheme regulated expression FA/BRCA genes
| Cell cycle model | RB1/E2F disturbed cancers | |||||
|---|---|---|---|---|---|---|
| Part | Gene symbol | T98G | EVA-F | Retinoblastoma | Basal breast tumors | Total |
| Core complex | FANCA | 1 | 1 | 1 | 1 | 4 |
| FANCB | 1 | 1 | 0 | 1 | 3 | |
| FANCC | 0 | 1 | 0 | 0 | 1 | |
| FANCE | 1 | 0 | 0 | 0 | 1 | |
| FANCF | 0 | 0 | 0 | 0 | 0 | |
| FANCG | 1 | 1 | 1 | 0 | 3 | |
| FANCL | 0 | 1 | 1 | 0 | 2 | |
| FANCM | 1 | 1 | 0 | 0 | 2 | |
| Central players | FANCD2 | 1 | 1 | 0 | 0 | 2 |
| FANCI | 1 | 1 | 1 | 0 | 3 | |
| Downstream branch | FANCD1/BRCA2 | 1 | 1 | 1 | 0 | 3 |
| FANCN/PALB2 | 1 | 1 | 1 | 0 | 3 | |
| BRCA1 | 1 | 1 | 1 | 0 | 3 | |
| FANCJ/BRIP1 | 1 | 1 | 1 | 0 | 3 | |
1 point = regulated; 0 = not regulated.
In the first approach, cell cycle regulated genes were selected based on their behaviour in the human cell models. In the T98G model the average value of time point 12–16 should have a MFC > 2.0, while in the diploid fibroblasts time point 18 should have a MFC > 2.0 (Figure 2a). This approach allows to interrogate induction prior to entry of S phase; the usual pattern for regulation at the mRNA level for genes playing a role in S phase. Based on these criteria, “regulated” genes turned out to be the core complex members: FANCA, FANCB, FANCG, and FANCM; central players: FANCD2 and FANCI; and for the downstream branch: FANCD1/BRCA2, FANCN/PALB2, FANCJ/BRIP1, and BRCA1 (Additional file 2: Table S2). The core complex member FANCE was only considered regulated in the T98G cell line, whereas FANCC and FANCL only in the EVA-F fibroblasts. The core complex member FANCF was in both cell types considered not regulated.
In the second approach, to select for proliferation stimulated genes, we used the criterion ‘fold change > 2’ in combination with significant P-values (Figure 2b) based on their behaviour in RB1-linked cancers. Upregulation of FA genes was found in both the retinoblastoma as well as in basal breast tumors. Only a few expression differences were possibly driven by CNA (FANCE, FANCF, and FANCI). The only gene that was consistently upregulated in both retinoblastoma as well as in basal breast tumors was FANCA (Additional file 2: Table S3).
The results of the combined scoring (Figure 2) are summarized in Table 5; a gene can have maximal 4 points, reflecting induction in all 4 contexts. Only FANCA turned out to have 4 points. The following genes obtained all 3 points: FANCB, FANCG, FANCI, FANCD1/BRCA2, FANCN/PALB2, BRCA1, and FANCJ/BRIP1. FANCF turned out not to be upregulated in both cell models and in the primary tumors its expression was also low which was correlated with CNA. The results indicate differential regulation of FA genes in response to proliferative stimuli, with FANCA the most regulated.
2.4.1 In silicoanalysis to determine coregulation of FA/BRCA genes
To further study coregulation, we performed in silico studies using the most regulated gene, i.e. FANCA, as the starting point. Firstly, we analyzed the correlation of FANCA with other genes with help of two online annotation tools, BioGPS (Wu et al. 2009) and GeneFriends (http://genefriends.org/microArray/) (van Dam et al. 2012). With the first tool BioGPS the dataset GeneAtlas U133A, gcrma was analyzed (Su et al. 2004). This allowed us to interrogate the overall gene expression profile of a panel of 79 different human tissues, including several cell lines from the NCI-60 cancer cell panel. The analysis of the gene expression pattern of FANCA indicated a strong correlation (> 0.7) with BRCA1 (0.7851), and FANCE (0.7402; Table 6).
Table 6.
Gene correlation mRNA expression pattern with FANCA
| Symbol | Reporter | Correlation* |
|---|---|---|
| FANCA | 203806_S_AT | 1.0000 |
| CCDC85A | GNF1H07976_AT | 0.9214 |
| SUSD3 | GNF1H08030_AT | 0.8978 |
| NLRP11 | GNF1H07113_AT | 0.8752 |
| RPAIN | 216962_AT | 0.8719 |
| WDR43 | 214662_AT | 0.8525 |
| PNPT1 | GNF1H09065_S_AT | 0.8510 |
| AICDA | 219841_AT | 0.8462 |
| C3orf37 | 201678_S_AT | 0.8370 |
| PRAMEF24P | GNF1H08246_AT | 0.8104 |
| E2F5 | 221586_S_AT | 0.8014 |
| BACH2 | 221234_S_AT | 0.7903 |
| RFC1 | 208021_S_AT | 0.7869 |
| MRPL48 | GNF1H02267_S_AT | 0.7864 |
| 217464_AT | 0.7853 | |
| BRCA1 | 204531_S_AT | 0.7851 |
| BFSP2 | 207399_AT | 0.7657 |
| RMI2 | GNF1H08947_AT | 0.7636 |
| TCF3 | 209152_S_AT | 0.7603 |
| LRMP | 204674_AT | 0.7549 |
| GCSAM | GNF1H07830_AT | 0.7536 |
| GNF1H03417_S_AT | 0.7525 | |
| ELL3 | 219518_S_AT | 0.7523 |
| SHMT2 | 214095_AT | 0.7442 |
| FANCE | 220255_AT | 0.7402 |
| ZNF804A | 215767_AT | 0.7352 |
| ALDH5A1 | 203608_AT | 0.7301 |
| ZNF232 | 219123_AT | 0.7244 |
| LRMP | 35974_AT | 0.7173 |
| MTHFD1L | GNF1H02482_S_AT | 0.7126 |
| ISG15 | 205483_S_AT | 0.7115 |
| PRDM15 | GNF1H10126_AT | 0.7032 |
*Correlation Cutoff: > 0.7; Bold: Genes of interest.
The second tool GeneFriends identifies co-expressed genes in a genome wide co-expression map over 4,000 human microarray datasets. The underlying datasets were derived from a variety of conditions. Searching GeneFriends with FANCA returns in the top list FANCA itself with a co-expressed value of 1.0 as expected. Intriguingly, only co-expression of FANCA with BRCA1 was found and not with other FA/BRCA genes in the top 50 list. The co-expression value of FANCA with BRCA1 was 0.708 indicating that FANCA is increased in expression (≥2 fold) in 70.8% of the cases when BRCA1 is increased in expression (≥2 fold; Additional file 2: Table S4). The strong correlation of FANCA with BRCA1 found with two different approaches, suggest that these two genes are frequently co-expressed. With GeneFriends, we further analyzed which genes are frequently coregulated with both FANCA and BRCA1 (Additional file 2: Table S5). Enrichment analysis of this gene set revealed Medical Subject Heading Terms (MeSH; top 3; Additional file 2: Table S6) genomic instability (P-value: 4.42E-04), microcephaly (P-value: 8.33E-04), and Bloom syndrome (P-value: 3.33E-03) and an enrichment for the cellular component centrosome (GO:0005813; P-value: 3.55E-08; Additional file 2: Table S7).
2.4.2 Coregulation of FANCAand BRCA1
Combining the results of the studies in the cell models and the tumors with the in silico data (Figure 2; Table 5; and Additional file 2: Table S4), reveals a high degree of coregulation of FANCA and BRCA1, with E2F3 as a possible important driver for cell-cycle regulated expression. To evaluate the degree of FANCA-BRCA1 co-expression, we measured the correlation coefficient of FANCA and BRCA1 expression in the Rb-tumor cohort (Figure 3). A strong linear correlation was found for co-expression of FANCA and BRCA1 (Pearson: 0.72). Interestingly, when adding the E2F3 expression to the FANCA and BRCA1 gene expression correlation, tumor samples with relatively low expression of FANCA and BRCA1 had also low E2F3 and vice versa (Figure 3). This suggests a possible role for E2F3 as a key driver for the gene regulation of the studied genes, and in particularly FANCA and BRCA1. Three established E2F3 target genes, CCNE1, FEN1, and PCNA, displayed a similar pattern (results not shown). As noted above, the Rb samples with MYCN amplifications have relative low level of expression for both genes.
Figure 3.
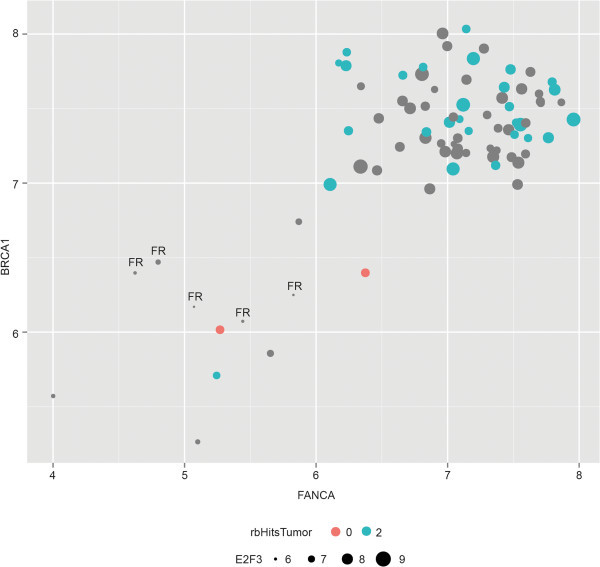
FANCA and BRCA1 are coexpressed in Retinoblastoma tumors. Correlation of normalized intensities of the most significant probe sets of FANCA (x-axis: 203806_PM_s_at, P = 2.32E-06) and BRCA1 (y-axis: 204531_PM_s_at, P = 2.13E-04) demonstrates a strong correlation (Pearson = 0.72). Retinoblastoma with no RB1 mutations but with high MYCN amplification (orange/red dots) have relatively low expression of FANCA and BRCA1. Dot sizes indicate levels of E2F3 expression. Retinoblastoma linked to RB1; blue dots: RB1 mutation determined in tumor; grey dots: RB1 mutation not determined in tumor. FR = Fetal Retina.
3 Discussion and conclusion
We found evidence for highly divergent cell cycle regulation of FA pathway genes, with FANCA being the only gene upregulated ≥ 2-fold in all four assayed conditions. Cell cycle upregulation is associated with the E2F/RB1 network; inactivation of RB1 due to mutation results in higher levels of specific FA genes. Importantly, our studies also indicate that RB1-mutated retinoblastoma are not characterized by a general upregulation of the canonical FA pathway, since the important core complex member FANCF turned out to be lower expressed associated with low DNA copy numbers; a finding with direct therapeutic implications. Surprisingly, two tools exploiting public data sets indicated coregulation of FANCA (acting in the upstream branch of the FA network) with BRCA1 (acting downstream).
The encoded proteins of coregulated genes often participate in the same pathway. When we characterized the expression of genes of the FA/BRCA-pathway, we found evidence for highly divergent cell type and stimulus-dependent regulation of mRNA levels for the FA pathway, which only can become apparent by in parallel comparisons as done in this study. Especially, the genes encoding for proteins which build up the core complex show strikingly different levels of cell cycle regulation. When comparing the individual subcomplexes from the core complex, one member of a subcomplex turned out to be stronger cell cycle regulated than the other member(s), e.g. FANCA versus FANCG (Figure 1b). Interestingly, the more strongly cell cycle regulated gene of each subcomplex contains Nuclear Localization Signal (NLS)-encoding sequences, while the other partner(s) lacks a positive motif score (Haitjema et al. 2013). It could be hypothesized that the FA genes/proteins of the core complex bearing NLSs constitute the driving forces for nuclear complex assembly. Overall, in our assays, FANCA turned out to be most affected by proliferative stimuli. In line with this, FANCA induction had also been observed employing two other cell-cycle approaches (Whitfield et al. 2002; Hoskins et al. 2008). Together, this provides evidence for strong cell cycle regulation of especially FANCA.
As could be expected, there is an involvement of the RB1/E2F pathway in the regulation of FA genes, as had already been noted for selected FA genes (Tategu et al. 2007; Hoskins et al. 2008). Here, we focused on the FA/BRCA gene expression in cancers with disrupted RB1/E2F pathway, which further underscored the interplay of both pathways. Moreover, we showed that in MYCN-amplified retinoblastoma, with an intact RB1/E2F pathway, FANCA (and also BRCA1) are downregulated compared to RB1-mutated retinoblastoma. FANCA was also found to be upregulated in basal breast tumors compared to not-basal breast tumors.
We as well show that activating E2F genes are associated with upregulation of FA genes. Intriguingly, overexpression of E2F3 strongly correlates with a high expression of FANCA and BRCA1 in RB1-mutated retinoblastoma, while in MYCN-amplified retinoblastoma all three genes show relatively low expression. FANCA and BRCA1 had already been denoted as E2F3-target genes in two other settings, while importantly no other FA/BRCA genes were identified (Polager et al. 2002; Bild et al. 2006). However, also other E2F genes likely contribute to the activation of FA genes (Tategu et al. 2007; Hoskins et al. 2008).
In all, no evidence was found for coordinate upregulation of the canonical FA pathway in response to proliferative stimuli. Due to low levels of the FANCF gene, the FA/BRCA-pathway may in fact be hypo-activated in full-blown retinoblastoma. Downregulation of FANCF mRNA levels in primary RB1-mutated retinoblastoma had been noted before (Ganguly and Shields 2010). Hyperactivation of the FA/BRCA-pathway has been associated with resistance against certain drugs including melphalan, while repression of the FA/BRCA-pathway has been linked with sensitivity. The combination of upregulation of specific FA genes with low FANCF expression and therefore likely low FANCF protein might explain the intermediate melphalan sensitivity observed in retinoblastoma cell lines [unpublished data], and why melphalan treatment can be successful in a subset of retinoblastoma patients (Venturi et al. 2013). Low levels of FANCF gene expression correlated with low levels of DNA was also found in basal breast cancer. Downregulation of FANCF due to hypermethylation of the FANCF promoter has also been reported in other tumors (Tischkowitz et al. 2003; Narayan et al. 2004; Wreesmann et al. 2007). The inactivation and/or low levels of FANCF which therefore disrupts the canonical FA pathway might also enhance alternative routes/functions of FA proteins, such as e.g. a FANCA-BRCA1 subcomplex (Folias et al. 2002).
In retinoblastoma upregulation of FA genes is an early event, since the first and second hit evolves mutations in the RB1 gene. In addition, gain in copy numbers of E2F3 have already been found in retinoma, which is currently regarded as the precursor of retinoblastoma (Sampieri et al. 2008). It could be hypothesized, that in early stages FA pathway activation may aid tumorigenesis. The low FANCF levels observed in full-blown tumors, nevertheless, suggest that at later stages there may be a selection against hyperactivation of the FA pathway. This order is in accordance with a recent model described for the action of the transforming human papillomavirus (HPV) E7 protein. The FA pathway has been shown to be upregulated upon HPV infection (the transforming HPV protein E7 binds to RB1 releasing E2F to transactivate its targets), though the same activated FA pathway limits the accumulation of E7 - and thereby infection or transformation - via an unknown mechanism (Hoskins et al. 2012). Therefore, both in viral and non-viral RB1-linked cancers, an early general upregulation of the FA network may be followed by a dampening of the same network via other mechanisms (Figure 4). Upregulation of FA genes could be related to prevention of replication stress in which the FA/BRCA pathway plays a role (Schlacher et al. 2012). Reduction of replication stress at certain times of tumorigenesis might reduce DNA-damage induced apoptosis thereby facilitating tumorigenesis (Hills and Diffley 2014).
Figure 4.
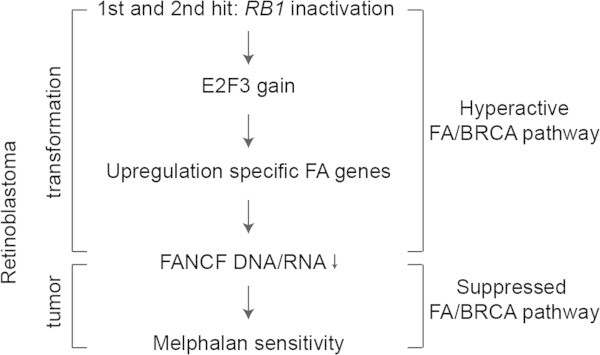
Retinoblastoma and FA/BRCA pathway transformation model. First and second hits in retinoblastoma are the inactivation of the RB1 alleles. Gain of E2F3 copy numbers aids to the upregulation of specific FA genes. In later stage inactivation of the FA/BRCA-pathway may be accomplished via low levels of the FANCF DNA/RNA, resulting in melphalan sensitivity.
Our analysis suggests also the possible relevance of subnetworks of the FA pathway in pathology. Two tools exploiting public data sets indicated coregulation of FANCA - functioning in the upstream branch of the classic FA network - with BRCA1 functioning in the downstream branch. In fact, coregulation of FANCA and BRCA1 was also observed in studies on the transcription factor SMAD4 (Bornstein et al. 2009; Meier and Schindler 2011). In our previous published prioritization approach based on FA protein properties, BRCA1 and FANCA were number one and three, respectively (Haitjema et al. 2013); resembling also each other on multiple intrinsic protein properties.
Additional analysis of genes co-expressed with FANCA and BRCA1, showed enrichment for the cellular component centrosome. In line with this, FANCA and BRCA1, but also the inducing transcription factor E2F3, have all three been associated with centrosome function (Saavedra et al. 2003; Kais et al. 2012; Kim et al. 2013); loss gives rise to aberrant centrosomes. Importantly, in BRCA1 this function could be separated from its function in homologous recombination. In accordance with this, in uterine leiomyomas FANCA and BRCA1 are both lowly expressed (Cirilo et al. 2013), and these tumors display centrosome dysfunction (Shan et al. 2012). Intriguingly, centrosome amplification causes microcephaly (Marthiens et al. 2013), a MeSH term we find enriched in the co-expressed genes.
BRCA1 has not been considered an FA gene, until recently, when a female patient diagnosed with ovarian cancer appeared to harbour biallelic mutations in BRCA1 and should be regarded as a FA patient (Domchek et al. 2013). The affected individual presented with microcephaly and, as expected, was extremely sensitive to cross-linking drugs. Since BRCA1 and FANCA have been shown to interact (Folias et al. 2002), this warrants further study to explore how precisely FANCA and BRCA1 interact.
In summary, FA genes show a variable level of cell cycle regulation. Upregulation of a subset of genes of the FA network may be a common theme in RB1-mutated tumors. There may be a selection, however, against hyperactivation of the classic FA pathway in certain tumors. Furthermore, this study warrants further molecular studies of subcomplexes containing specific FA proteins, besides the canonical FA pathway, and their relevance for pathology, carcinogenesis and therapy response.
4 Methods
4.1 Cell and culture conditions
T98G glioblastoma cells (obtained from ATCC®) were cultured in Dulbecco’s modified Eagle medium (DMEM) containing 1 g/L D-Glucose supplemented with 10% foetal bovine serum (FBS). EVA-F primary diploid fibroblasts (obtained from a 23-year old female control; established and propagated at VUmc) were cultured in DMEM containing 4.5 g/L D-Glucose supplemented with 10% foetal bovine serum (FBS). To induce growth arrest, subconfluent cells were grown for 72 h in DMEM supplemented with 0.2% FBS. Cells were harvested at specific time points after restimulation with 10% FBS. Cell cycle analysis was performed as described previously (Stoepker et al. 2011). For EVA-F fibroblast, the karyotype was determined (EVA-F: 45.18 ± SEM 0.25 chromosomes, n = 40 metaphases).
4.2 RT-PCR and quantitative real-time PCR
Total RNA was extracted (High Pure Isolation Kit; Roche) and cDNA was prepared (iScriptcDNA Synthesis Kit; Biorad). The mRNA levels were quantified by real-time quantitative polymerase chain reactions (SYBR Green reaction kit; LightCycler 480, Roche). Relative gene expression, in terms of mean fold changes (MFC), was calculated via the 2-ΔΔCT method (Livak and Schmittgen 2001). Primer design was optimized for quantitative mRNA profiling. The primers generated amplicons of ~100 to 250 bp with a minimum GC content of 40%; forward and reverse primers were on different exons to avoid genomic products (except for FANCF which has only on exon). As controls, primer sets for the established cell cycle marker gene CCNE2 and for the housekeeping gene TBP were used. Specific primer pairs were designed using the Primer3 program (Primer3 Version 0.4.0; http://bioinfo.ut.ee/primer3-0.4.0/primer3/) for the genes as follows:
FANCA: 5′-CACACGCTTGGCAGTGTAAT-3′ and 5′-CGCAAAGCTCCACTCTCTCT-3′;
FANCB: 5′-CGCTGCGTTGAGTTTCATAA-′3 and 5′-TGGGACAATAGGCATCACAA-3′;
FANCC: 5′-ATTCCGGGTTGTTGATGAGA-3′and 5′-TGCTTGCTTGCTTTCTCCAG-3′;
BRCA2/FANCD1: 5′-ATGGCTCATACCCTCCAATG-3′ and 5′-TTCCATAGCTGCCAGTTTCC-3′;
FANCD2: 5′-TCCGACTTGACCCAAACTTC-3′ and 5′-GTGATGGCAAAACACAATGC-3′;
FANCE: 5′-TGATCTCAGCCTCAGCAATG-3′ and 5′-GGAGGTCAGGGCAGTTGTAA-3′;
FANCF: 5′-CTAACTGCCCTGGAGACCTG-3′ and 5′-CGCTGAGACCCAAAACTTGT-3′;
FANCG: 5′-CGCCCTAATTAGTCGTGGAC-3′ and 5′-TCCCTCCGATCTAGCCTCTT-3′;
FANCI: 5′-AAGCGGGTAAAGCCAAAACT-3′ and 5′-CGCATAAACTCATTGCTGGA-3′;
BRIP1/FANCJ: 5′-GCTCTCAGAAGTCGGTTTCC-3′ and 5′-AGCAAGCTGTGACGGGTAAG-3′;
FANCL: 5′-GAAATTGATTTTCCAGCTCGTG-3′ and 5′-TGGTACCGTCAAGTTGATAAGC-3′;
FANCM: 5′-CACGAAGGGTTTTACCCAGA-3′ and 5′-ACCTTCTTCACCCACACAGG-3′;
PALB2/FANCN: 5′-CTTGGCCTGACAAAGAGGAG-3′ and 5′-AAGCAGAGCTTCTTGCATCC-3′;
BRCA1: 5′-GAGTGAACCCGAAAATCCTTC-3′ and 5′-ACTGATTTCATCCCTGGTTCC-3′;
CCNE2: 5′-ACTGACTGCTGCTGCCTTGTGC-3′ and 5′-TCGGTGGTGTCATAATGCCTCC-3′;
TBP: 5′-TGCACAGGAGCCAAGAGTGAA-3′and 5′-CACATCACAGCTCCCCACCA-3′.
4.3 Gene expression profiling
4.3.1 Primary retinoblastoma tumors
Total RNA was isolated from 77 primary retinoblastoma tumors and 3 healthy fetal retina tissues (including 2 biological duplicates adding up to 5 control RNA-extracts). Biotinylated targets were prepared by published methods (Lipshutz et al. 1999) and hybridized to Affymetrix HT HG-U133 Plus PM arrays. Resulting raw CEL-files were normalized by robust multi-array average implementated by Bioconductor package affy (Gautier et al. 2004). To identify genes differentially expressed between the retinoblastoma tumors and healthy fetal retina, empirical Bayes moderated t-statistics were calculated, implemented by the limma package (Smyth 2005) and p-values were adjusted by Benjamini and Hochberg multiple testing correction (Benjamini and Hochberg 1995).
4.3.2 Basal and not-basal breast tumors
Total RNA was isolated from 41 basal breast tumors (27 BRCA1 mutated) and 79 not-basal breast tumors (8 BRCA1 mutated) and cryostat sections using RNAzol B (Campro Scientific, Veenendaal, The Netherlands) and RNA quality and quantity was evaluated on a Agilent Bioanalyzer. Antisense biotinylated RNA was prepared and hybridized to Affymetrix HGU133_Plus_2.0 GeneChips, according to the manufacturer’s guidelines (Affymetrix, Santa Clara, CA, USA). Gene expression signals were calculated using AffymetrixGeneChip analysis software MAS 5.0. Global scaling normalization was performed to bring the average signal intensity of the chips to a target of 100 before data analysis. The data was imported in Partek Genomics Suite 6.5 and Log2 transformed before analysis. ANOVA was then used to determine differentially expressed probe-sets.
4.4 Analysis of public data sets and gene set enrichment analysis
Two online annotation tools were used for in silico coregulation analysis: BioGPS (Wu et al. 2009) and GeneFriends (http://genefriends.org/microArray/) (van Dam et al. 2012). With BioGPS the data set GeneAtlas U133A, gcrma was analyzed, with the cut-off: >0.7 (Su et al. 2004). The human co-expression network was screened in GeneFriends. Enrichment analysis was performed with Genomatix GeneRanker (Genomatix Software GmbH, version 2013).
4.5 Ethical standards
Retinoblastoma and breast cancer specimens were processed and analyzed in accordance with local ethics (VUmc).
Electronic supplementary material
Additional file 1: Figure S1: Differential cell cycle regulation of FA genes in human EVA-F cells. (a - left panel) Cells were placed on medium with low serum (0.2% FBS) for 3 days resulting in cell cycle arrest. The addition of high serum medium (10% FBS) released cells resulting in synchronous progression through the cell cycle. Sampled cells at different time points were divided for Fluorescent Activated Cell Sorting (FACS) analysis. Data represents one representative synchronization experiment. Quantitative RT-PCR was performed on RNA samples from different time points and mean fold changes (MFC) were calculated relative to time point zero. Data represents duplo qPCR measurements of one representative synchronization experiment, SEM is indicated. (a - right panel) Cell cycle control CCNE2 (b) FANCA and FANCG (c) FANCB and FANCL (d) FANCE, FANCC, and FANCF (e) FANCM (f) FANCD2 and FANCI (g) BRCA2, PALB2, BRCA1, and BRIP1. (TIFF 612 KB)
Additional file 2: Table S1: Expression in retinoblastoma tumors with MYCN amplification versus retinoblastoma tumors with RB1 mutations. Table S2 Summary regulation FA/BRCA-pathway genes cell model. Table S3 Summary results FA/BRCA-pathway genes “RB1/E2F disturbed cells”. Table S4 Co-expressed genes with input gene FANCA. Table S5 Co-expressed genes with input gene FANCA and BRCA1. Table S6 Medical Subject Headings (MeSH) enrichment of 50 genes co-expressed with FANCA and BRCA1. Table S7 Cellular Components (GO) enrichment of 50 genes co-expressed with FANCA and BRCA1. (DOC 210 KB)
Acknowledgments
We express gratitude to all members of the Oncogenetics section and members of the Retinoblastoma team of the VU University Medical Center for useful discussions. We are grateful to the children affected with FA and their families who have donated tissues allowing the responsible FA genes to be cloned and the discovery of the FA pathway. We thank KiKa for supporting the retinoblastoma study.
Abbreviations
- CNA
Copy Number Alteration
- DMEM
Dulbecco’s modified Eagle medium
- DSB
Double strand break
- FA
Fanconi anemia
- FACS
Fluorescent Activated Cell Sorting
- FBS
Foetal bovine serum
- FC
Fold Change
- FDR
False Discovery Rate
- MeSH
Medical Subject Heading
- MFC
Mean Fold Change
- RB
Retinoblastoma
- SEM
Standard Error of the Mean.
Footnotes
Competing interests
The authors declare that they have no competing interests.
Authors’ contributions
This study was conceived and designed by JCD and AH. The experiments were performed by AH, BMM, JALJ, DAPR and MAR. Analyzes of gene expression profiling was performed by BMM, IEK and MPGM. The manuscript was written by AH and JCD. The manuscript was reviewed and edited by JPdW (deceased), HM-H and HJ. All authors read and approved the final manuscript.
Contributor Information
Anneke Haitjema, Email: a.haitjema@vumc.nl.
Berber M Mol, Email: b.mol@vumc.nl.
Irsan E Kooi, Email: ei.kooi@vumc.nl.
Maarten PG Massink, Email: m.massink@vumc.nl.
Jens AL Jørgensen, Email: Jens.Andreas.Jorgensen@rr-research.no.
Davy AP Rockx, Email: rockx@vumc.nl.
Martin A Rooimans, Email: m.rooimans@vumc.nl.
Hanne Meijers-Heijboer, Email: h.meijers@vumc.nl.
Hans Joenje, Email: h.joenje@vumc.nl.
Josephine C Dorsman, Email: jc.dorsman@vumc.nl.
References
- Alter BP. Cancer in Fanconi anemia, 1927-2001. Cancer. 2003;97:425–440. doi: 10.1002/cncr.11046. [DOI] [PubMed] [Google Scholar]
- Apostolou S, Whitmore SA, Crawford J, Lennon G, Sutherland GR, Callen DF, Lanzano L, Savino M, D’Apolito M, Notarangeio A, Memeo E, Piemontese MR, Zelante L, Savoia A, Gibson RA, Tipping AJ, Morgan NV, Hassock S, Jansen S, de Ravel TJ, Van Berkell C, Pronk JC, Easton DF, Mathew CG, Levran O, Verlander PC, Batish SD, Erlich T, Auerbach AD, Cleton-Jansen A-M, Moerland EW, Cornelisse CJ, Doggett NA, Deaven LL, Moyzis RK. Positional cloning of the Fanconi anaemia group A gene. Nat Genet. 1996;14:324–328. doi: 10.1038/ng1196-324. [DOI] [PubMed] [Google Scholar]
- Auerbach A, Buchwald M, Joenje H. Fanconi anemia. The metabolic and molecular bases of inherited disease. 8. New York: McGraw-Hill; 2001. pp. 753–768. [Google Scholar]
- Benjamini Y, Hochberg Y. Controlling the False Discovery Rate: A Practical and Powerful Approach to Multiple Testing. Journal of the Royal Statistical Society Series B (Methodological) 1995;57:289–300. [Google Scholar]
- Bild AH, Yao G, Chang JT, Wang Q, Potti A, Chasse D, Joshi M-B, Harpole D, Lancaster JM, Berchuck A, Olson JA, Jr, Marks JR, Dressman HK, West M, Nevins JR. Oncogenic pathway signatures in human cancers as a guide to targeted therapies. Nature. 2006;439:353–357. doi: 10.1038/nature04296. [DOI] [PubMed] [Google Scholar]
- Bogliolo M, Schuster B, Stoepker C, Derkunt B, Su Y, Raams A, Trujillo JP, Minguillón J, Ramírez MJ, Pujol R, Casado JA, Baños R, Rio P, Knies K, Zúñiga S, Benítez J, Bueren JA, Jaspers NGJ, Schärer OD, de Winter JP, Schindler D, Surrallés J. Mutations in ERCC4, Encoding the DNA-Repair Endonuclease XPF, Cause Fanconi Anemia. Am J Hum Genet. 2013;92:800–806. doi: 10.1016/j.ajhg.2013.04.002. [DOI] [PMC free article] [PubMed] [Google Scholar]
- Bornstein S, White R, Malkoski S, Oka M, Han G, Cleaver T, Reh D, Andersen P, Gross N, Olson S, Deng C, Lu S-L, Wang X-J. Smad4 loss in mice causes spontaneous head and neck cancer with increased genomic instability and inflammation. J Clin Invest. 2009;119:3408–3419. doi: 10.1172/JCI38854. [DOI] [PMC free article] [PubMed] [Google Scholar]
- Chen Q, der Sluis PCV, Boulware D, Hazlehurst LA, Dalton WS. The FA/BRCA pathway is involved in melphalan-induced DNA interstrand cross-link repair and accounts for melphalan resistance in multiple myeloma cells. Blood. 2005;106:698–705. doi: 10.1182/blood-2004-11-4286. [DOI] [PMC free article] [PubMed] [Google Scholar]
- Chen H-Z, Tsai S-Y, Leone G. Emerging roles of E2Fs in cancer: an exit from cell cycle control. Nat Rev Cancer. 2009;9:785–797. doi: 10.1038/nrc2696. [DOI] [PMC free article] [PubMed] [Google Scholar]
- Cirilo PDR, Marchi FA, de Camargo Barros Filho M, Rocha RM, Domingues MAC, Jurisica I, Pontes A, Rogatto SR. An integrative genomic and transcriptomic analysis reveals potential targets associated with cell proliferation in uterine leiomyomas. PLoS ONE. 2013;8:e57901. doi: 10.1371/journal.pone.0057901. [DOI] [PMC free article] [PubMed] [Google Scholar]
- D’Andrea AD. BRCA1: A Missing Link in the Fanconi Anemia/BRCA Pathway. Cancer Discovery. 2013;3:376–378. doi: 10.1158/2159-8290.CD-13-0044. [DOI] [PMC free article] [PubMed] [Google Scholar]
- De Winter JP, Joenje H. The genetic and molecular basis of Fanconi anemia. Mutat Res. 2009;668:11–19. doi: 10.1016/j.mrfmmm.2008.11.004. [DOI] [PubMed] [Google Scholar]
- De Winter JP, Waisfisz Q, Rooimans MA, van Berkel CG, Bosnoyan-Collins L, Alon N, Carreau M, Bender O, Demuth I, Schindler D, Pronk JC, Arwert F, Hoehn H, Digweed M, Buchwald M, Joenje H. The Fanconi anaemia group G gene FANCG is identical with XRCC9. Nat Genet. 1998;20:281–283. doi: 10.1038/3093. [DOI] [PubMed] [Google Scholar]
- De Winter JP, Léveillé F, van Berkel CG, Rooimans MA, van Der Weel L, Steltenpool J, Demuth I, Morgan NV, Alon N, Bosnoyan-Collins L, Lightfoot J, Leegwater PA, Waisfisz Q, Komatsu K, Arwert F, Pronk JC, Mathew CG, Digweed M, Buchwald M, Joenje H. Isolation of a cDNA representing the Fanconi anemia complementation group E gene. Am J Hum Genet. 2000;67:1306–1308. doi: 10.1016/S0002-9297(07)62959-0. [DOI] [PMC free article] [PubMed] [Google Scholar]
- De Winter JP, Rooimans MA, van Der Weel L, van Berkel CG, Alon N, Bosnoyan-Collins L, de Groot J, Zhi Y, Waisfisz Q, Pronk JC, Arwert F, Mathew CG, Scheper RJ, Hoatlin ME, Buchwald M, Joenje H. The Fanconi anaemia gene FANCF encodes a novel protein with homology to ROM. Nat Genet. 2000;24:15–16. doi: 10.1038/71626. [DOI] [PubMed] [Google Scholar]
- Dear PH. Copy-number variation: the end of the human genome? Trends in Biotechnology. 2009;27:448–454. doi: 10.1016/j.tibtech.2009.05.003. [DOI] [PubMed] [Google Scholar]
- Di Fiore R, D’Anneo A, Tesoriere G, Vento R. RB1 in cancer: different mechanisms of RB1 inactivation and alterations of pRb pathway in tumorigenesis. J Cell Physiol. 2013;228:1676–1687. doi: 10.1002/jcp.24329. [DOI] [PubMed] [Google Scholar]
- Domchek SM, Tang J, Stopfer J, Lilli DR, Hamel N, Tischkowitz M, Monteiro AN, Messick TE, Powers J, Yonker A, Couch FJ, Goldgar DE, Davidson HR, Nathanson KL, Foulkes WD, Greenberg RA. Biallelic deleterious BRCA1 mutations in a woman with early-onset ovarian cancer. Cancer Discov. 2013;3(4):399–405. doi: 10.1158/2159-8290.CD-12-0421. [DOI] [PMC free article] [PubMed] [Google Scholar]
- Dorsman JC, Levitus M, Rockx D, Rooimans MA, Oostra AB, Haitjema A, Bakker ST, Steltenpool J, Schuler D, Mohan S, Schindler D, Arwert F, Pals G, Mathew CG, Waisfisz Q, de Winter JP, Joenje H. Identification of the Fanconi anemia complementation group I gene, FANCI. Cell Oncol. 2007;29:211–218. doi: 10.1155/2007/151968. [DOI] [PMC free article] [PubMed] [Google Scholar]
- Dunn JM, Phillips RA, Becker AJ, Gallie BL. Identification of germline and somatic mutations affecting the retinoblastoma gene. Science. 1988;241:1797–1800. doi: 10.1126/science.3175621. [DOI] [PubMed] [Google Scholar]
- Folias A, Matkovic M, Bruun D, Reid S, Hejna J, Grompe M, D’Andrea A, Moses R. BRCA1 interacts directly with the Fanconi anemia protein FANCA. Hum Mol Genet. 2002;11:2591–2597. doi: 10.1093/hmg/11.21.2591. [DOI] [PubMed] [Google Scholar]
- Ganguly A, Shields CL. Differential gene expression profile of retinoblastoma compared to normal retina. Mol Vis. 2010;16:1292–1303. [PMC free article] [PubMed] [Google Scholar]
- Gautier L, Cope L, Bolstad BM, Irizarry RA. affy–analysis of Affymetrix GeneChip data at the probe level. Bioinformatics. 2004;20:307–315. doi: 10.1093/bioinformatics/btg405. [DOI] [PubMed] [Google Scholar]
- Haitjema A, Brandt BW, Ameziane N, May P, Heringa J, de Winter JP, Joenje H, Dorsman JC. A Protein Prioritization Approach Tailored for the FA/BRCA Pathway. PLoS ONE. 2013;8:e62017. doi: 10.1371/journal.pone.0062017. [DOI] [PMC free article] [PubMed] [Google Scholar]
- Henley SA, Dick FA. The retinoblastoma family of proteins and their regulatory functions in the mammalian cell division cycle. Cell Div. 2012;7:10. doi: 10.1186/1747-1028-7-10. [DOI] [PMC free article] [PubMed] [Google Scholar]
- Henrichsen CN, Chaignat E, Reymond A. Copy number variants, diseases and gene expression. Hum Mol Genet. 2009;18:R1–8. doi: 10.1093/hmg/ddp011. [DOI] [PubMed] [Google Scholar]
- Herschkowitz JI, He X, Fan C, Perou CM. The functional loss of the retinoblastoma tumour suppressor is a common event in basal-like and luminal B breast carcinomas. Breast Cancer Res. 2008;10:R75. doi: 10.1186/bcr2142. [DOI] [PMC free article] [PubMed] [Google Scholar]
- Hills SA, Diffley JFX. DNA Replication and Oncogene-Induced Replicative Stress. Curr Biol. 2014;24:R435–R444. doi: 10.1016/j.cub.2014.04.012. [DOI] [PubMed] [Google Scholar]
- Hoskins EE, Gunawardena RW, Habash KB, Wise-Draper TM, Jansen M, Knudsen ES, Wells SI. Coordinate regulation of Fanconi anemia gene expression occurs through the Rb/E2F pathway. Oncogene. 2008;27:4798–4808. doi: 10.1038/onc.2008.121. [DOI] [PMC free article] [PubMed] [Google Scholar]
- Hoskins EE, Morreale RJ, Werner SP, Higginbotham JM, Laimins LA, Lambert PF, Brown DR, Gillison ML, Nuovo GJ, Witte DP, Kim M-O, Davies SM, Mehta PA, Butsch Kovacic M, Wikenheiser-Brokamp KA, Wells SI. The fanconi anemia pathway limits human papillomavirus replication. J Virol. 2012;86:8131–8138. doi: 10.1128/JVI.00408-12. [DOI] [PMC free article] [PubMed] [Google Scholar]
- Howlett NG, Taniguchi T, Olson S, Cox B, Waisfisz Q, De Die-Smulders C, Persky N, Grompe M, Joenje H, Pals G, Ikeda H, Fox EA, D’Andrea AD. Biallelic inactivation of BRCA2 in Fanconi anemia. Science. 2002;297:606–609. doi: 10.1126/science.1073834. [DOI] [PubMed] [Google Scholar]
- Ishida R, Buchwald M. Susceptibility of Fanconi’s anemia lymphoblasts to DNA-cross-linking and alkylating agents. Cancer Res. 1982;42:4000–4006. [PubMed] [Google Scholar]
- Kaddar T, Carreau M. Fanconi anemia proteins and their interacting partners: a molecular puzzle. Anemia. 2012;2012:425814. doi: 10.1155/2012/425814. [DOI] [PMC free article] [PubMed] [Google Scholar]
- Kais Z, Chiba N, Ishioka C, Parvin JD. Functional differences among BRCA1 missense mutations in the control of centrosome duplication. Oncogene. 2012;31:799–804. doi: 10.1038/onc.2011.271. [DOI] [PMC free article] [PubMed] [Google Scholar]
- Kim H, D’Andrea AD. Regulation of DNA cross-link repair by the Fanconi anemia/BRCA pathway. Genes Dev. 2012;26:1393–1408. doi: 10.1101/gad.195248.112. [DOI] [PMC free article] [PubMed] [Google Scholar]
- Kim Y, Lach FP, Desetty R, Hanenberg H, Auerbach AD, Smogorzewska A. Mutations of the SLX4 gene in Fanconi anemia. Nat Genet. 2011;43:142–146. doi: 10.1038/ng.750. [DOI] [PMC free article] [PubMed] [Google Scholar]
- Kim S, Hwang SK, Lee M, Kwak H, Son K, Yang J, Kim SH, Lee C-H. Fanconi anemia complementation group A (FANCA) localizes to centrosomes and functions in the maintenance of centrosome integrity. Int J Biochem Cell Biol. 2013;45:1953–1961. doi: 10.1016/j.biocel.2013.06.012. [DOI] [PubMed] [Google Scholar]
- Knudsen ES, Wang JYJ. Targeting the RB-pathway in Cancer Therapy. Clin Cancer Res. 2010;16:1094–1099. doi: 10.1158/1078-0432.CCR-09-0787. [DOI] [PMC free article] [PubMed] [Google Scholar]
- Kuiper RP, Ligtenberg MJL, Hoogerbrugge N, Geurts van Kessel A. Germline copy number variation and cancer risk. Curr Opin Genet Dev. 2010;20:282–289. doi: 10.1016/j.gde.2010.03.005. [DOI] [PubMed] [Google Scholar]
- Kutler DI, Singh B, Satagopan J, Batish SD, Berwick M, Giampietro PF, Hanenberg H, Auerbach AD. A 20-year perspective on the International Fanconi Anemia Registry (IFAR) Blood. 2003;101:1249–1256. doi: 10.1182/blood-2002-07-2170. [DOI] [PubMed] [Google Scholar]
- Levitus M, Waisfisz Q, Godthelp BC, de Vries Y, Hussain S, Wiegant WW, Elghalbzouri-Maghrani E, Steltenpool J, Rooimans MA, Pals G, Arwert F, Mathew CG, Zdzienicka MZ, Hiom K, De Winter JP, Joenje H. The DNA helicase BRIP1 is defective in Fanconi anemia complementation group J. Nat Genet. 2005;37:934–935. doi: 10.1038/ng1625. [DOI] [PubMed] [Google Scholar]
- Levran O, Attwooll C, Henry RT, Milton KL, Neveling K, Rio P, Batish SD, Kalb R, Velleuer E, Barral S, Ott J, Petrini J, Schindler D, Hanenberg H, Auerbach AD. The BRCA1-interacting helicase BRIP1 is deficient in Fanconi anemia. Nat Genet. 2005;37:931–933. doi: 10.1038/ng1624. [DOI] [PubMed] [Google Scholar]
- Levran O, Diotti R, Pujara K, Batish SD, Hanenberg H, Auerbach AD. Spectrum of sequence variations in the FANCA gene: An International Fanconi Anemia Registry (IFAR) study. Human Mutation. 2005;25:142–149. doi: 10.1002/humu.20125. [DOI] [PubMed] [Google Scholar]
- Lipshutz RJ, Fodor SP, Gingeras TR, Lockhart DJ. High density synthetic oligonucleotide arrays. Nat Genet. 1999;21:20–24. doi: 10.1038/4447. [DOI] [PubMed] [Google Scholar]
- Livak KJ, Schmittgen TD. Analysis of relative gene expression data using real-time quantitative PCR and the 2(-Delta Delta C(T)) Method. Methods. 2001;25:402–408. doi: 10.1006/meth.2001.1262. [DOI] [PubMed] [Google Scholar]
- Lo Ten Foe JR, Rooimans MA, Bosnoyan-Collins L, Alon N, Wijker M, Parker L, Lightfoot J, Carreau M, Callen DF, Savoia A, Cheng NC, van Berkel CG, Strunk MH, Gille JJ, Pals G, Kruyt FA, Pronk JC, Arwert F, Buchwald M, Joenje H. Expression cloning of a cDNA for the major Fanconi anaemia gene, FAA. Nat Genet. 1996;14:320–323. doi: 10.1038/ng1196-320. [DOI] [PubMed] [Google Scholar]
- Marthiens V, Rujano MA, Pennetier C, Tessier S, Paul-Gilloteaux P, Basto R. Centrosome amplification causes microcephaly. Nat Cell Biol. 2013;15:731–740. doi: 10.1038/ncb2746. [DOI] [PubMed] [Google Scholar]
- Medhurst AL, Laghmani EH, Steltenpool J, Ferrer M, Fontaine C, de Groot J, Rooimans MA, Scheper RJ, Meetei AR, Wang W, Joenje H, de Winter JP. Evidence for subcomplexes in the Fanconi anemia pathway. Blood. 2006;108:2072–2080. doi: 10.1182/blood-2005-11-008151. [DOI] [PMC free article] [PubMed] [Google Scholar]
- Meetei AR, de Winter JP, Medhurst AL, Wallisch M, Waisfisz Q, van de Vrugt HJ, Oostra AB, Yan Z, Ling C, Bishop CE, Hoatlin ME, Joenje H, Wang W. A novel ubiquitin ligase is deficient in Fanconi anemia. Nat Genet. 2003;35:165–170. doi: 10.1038/ng1241. [DOI] [PubMed] [Google Scholar]
- Meetei AR, Levitus M, Xue Y, Medhurst AL, Zwaan M, Ling C, Rooimans MA, Bier P, Hoatlin M, Pals G, de Winter JP, Wang W, Joenje H. X-linked inheritance of Fanconi anemia complementation group B. Nat Genet. 2004;36:1219–1224. doi: 10.1038/ng1458. [DOI] [PubMed] [Google Scholar]
- Meetei AR, Medhurst AL, Ling C, Xue Y, Singh TR, Bier P, Steltenpool J, Stone S, Dokal I, Mathew CG, Hoatlin M, Joenje H, de Winter JP, Wang W. A human ortholog of archaeal DNA repair protein Hef is defective in Fanconi anemia complementation group M. Nat Genet. 2005;37:958–963. doi: 10.1038/ng1626. [DOI] [PMC free article] [PubMed] [Google Scholar]
- Meier D, Schindler D. Fanconi anemia core complex gene promoters harbor conserved transcription regulatory elements. PLoS ONE. 2011;6:e22911. doi: 10.1371/journal.pone.0022911. [DOI] [PMC free article] [PubMed] [Google Scholar]
- Narayan G, Arias-Pulido H, Nandula SV, Basso K, Sugirtharaj DD, Vargas H, Mansukhani M, Villella J, Meyer L, Schneider A, Gissmann L, Dürst M, Pothuri B, Murty VVVS. Promoter hypermethylation of FANCF: disruption of Fanconi Anemia-BRCA pathway in cervical cancer. Cancer Res. 2004;64:2994–2997. doi: 10.1158/0008-5472.CAN-04-0245. [DOI] [PubMed] [Google Scholar]
- Nevins JR. The Rb/E2F pathway and cancer. Hum Mol Genet. 2001;10:699–703. doi: 10.1093/hmg/10.7.699. [DOI] [PubMed] [Google Scholar]
- Polager S, Kalma Y, Berkovich E, Ginsberg D. E2Fs up-regulate expression of genes involved in DNA replication, DNA repair and mitosis. Oncogene. 2002;21:437–446. doi: 10.1038/sj.onc.1205102. [DOI] [PubMed] [Google Scholar]
- Pronk JC, Gibson RA, Savoia A, Wijker M, Morgan NV, Melchionda S, Ford D, Temtamy S, Ortega JJ, Jansen S. Localisation of the Fanconi anaemia complementation group A gene to chromosome 16q24.3. Nat Genet. 1995;11:338–340. doi: 10.1038/ng1195-338. [DOI] [PubMed] [Google Scholar]
- Rosenberg PS, Greene MH, Alter BP. Cancer incidence in persons with Fanconi anemia. Blood. 2003;101:822–826. doi: 10.1182/blood-2002-05-1498. [DOI] [PubMed] [Google Scholar]
- Rushlow DE, Mol BM, Kennett JY, Yee S, Pajovic S, Thériault BL, Prigoda-Lee NL, Spencer C, Dimaras H, Corson TW, Pang R, Massey C, Godbout R, Jiang Z, Zacksenhaus E, Paton K, Moll AC, Houdayer C, Raizis A, Halliday W, Lam WL, Boutros PC, Lohmann D, Dorsman JC, Gallie BL. Characterisation of retinoblastomas without RB1 mutations: genomic, gene expression, and clinical studies. Lancet Oncol. 2013;14:327–334. doi: 10.1016/S1470-2045(13)70045-7. [DOI] [PubMed] [Google Scholar]
- Saavedra HI, Maiti B, Timmers C, Altura R, Tokuyama Y, Fukasawa K, Leone G. Inactivation of E2F3 results in centrosome amplification. Cancer Cell. 2003;3:333–346. doi: 10.1016/S1535-6108(03)00083-7. [DOI] [PMC free article] [PubMed] [Google Scholar]
- Sampieri K, Mencarelli MA, Epistolato MC, Toti P, Lazzi S, Bruttini M, De Francesco S, Longo I, Meloni I, Mari F, Acquaviva A, Hadjistilianou T, Renieri A, Ariani F. Genomic differences between retinoma and retinoblastoma. Acta Oncol. 2008;47:1483–1492. doi: 10.1080/02841860802342382. [DOI] [PubMed] [Google Scholar]
- Schlacher K, Wu H, Jasin M. A Distinct Replication Fork Protection Pathway Connects Fanconi Anemia Tumor Suppressors to RAD51-BRCA1/2. Cancer Cell. 2012;22:106–116. doi: 10.1016/j.ccr.2012.05.015. [DOI] [PMC free article] [PubMed] [Google Scholar]
- Shan W, Akinfenwa PY, Savannah KB, Kolomeyevskaya N, Laucirica R, Thomas DG, Odunsi K, Creighton CJ, Lev DC, Anderson ML. A small-molecule inhibitor targeting the mitotic spindle checkpoint impairs the growth of uterine leiomyosarcoma. Clin Cancer Res. 2012;18:3352–3365. doi: 10.1158/1078-0432.CCR-11-3058. [DOI] [PMC free article] [PubMed] [Google Scholar]
- Sims AE, Spiteri E, Sims RJ, 3rd, Arita AG, Lach FP, Landers T, Wurm M, Freund M, Neveling K, Hanenberg H, Auerbach AD, Huang TT. FANCI is a second monoubiquitinated member of the Fanconi anemia pathway. Nat Struct Mol Biol. 2007;14:564–567. doi: 10.1038/nsmb1252. [DOI] [PubMed] [Google Scholar]
- Smogorzewska A, Matsuoka S, Vinciguerra P, McDonald ER, 3rd, Hurov KE, Luo J, Ballif BA, Gygi SP, Hofmann K, D’Andrea AD, Elledge SJ. Identification of the FANCI protein, a monoubiquitinated FANCD2 paralog required for DNA repair. Cell. 2007;129:289–301. doi: 10.1016/j.cell.2007.03.009. [DOI] [PMC free article] [PubMed] [Google Scholar]
- Smyth GK. limma: Linear Models for Microarray Data. In: Gentleman R, Carey VJ, Huber W, Irizarry RA, Dudoit S, editors. Bioinformatics and Computational Biology Solutions Using R and Bioconductor. New York: Springer; 2005. pp. 397–420. [Google Scholar]
- Stecklein SR, Jensen RA. Identifying and exploiting defects in the Fanconi anemia/BRCA pathway in oncology. Transl Res. 2012;160:178–197. doi: 10.1016/j.trsl.2012.01.022. [DOI] [PubMed] [Google Scholar]
- Stein GH. T98G: an anchorage-independent human tumor cell line that exhibits stationary phase G1 arrest in vitro. J Cell Physiol. 1979;99:43–54. doi: 10.1002/jcp.1040990107. [DOI] [PubMed] [Google Scholar]
- Stoepker C, Hain K, Schuster B, Hilhorst-Hofstee Y, Rooimans MA, Steltenpool J, Oostra AB, Eirich K, Korthof ET, Nieuwint AWM, Jaspers NGJ, Bettecken T, Joenje H, Schindler D, Rouse J, de Winter JP. SLX4, a coordinator of structure-specific endonucleases, is mutated in a new Fanconi anemia subtype. Nat Genet. 2011;43:138–141. doi: 10.1038/ng.751. [DOI] [PubMed] [Google Scholar]
- Strathdee CA, Duncan AM, Buchwald M. Evidence for at least four Fanconi anaemia genes including FACC on chromosome 9. Nat Genet. 1992;1:196–198. doi: 10.1038/ng0692-196. [DOI] [PubMed] [Google Scholar]
- Su AI, Wiltshire T, Batalov S, Lapp H, Ching KA, Block D, Zhang J, Soden R, Hayakawa M, Kreiman G, Cooke MP, Walker JR, Hogenesch JB. A gene atlas of the mouse and human protein-encoding transcriptomes. Proc Natl Acad Sci USA. 2004;101:6062–6067. doi: 10.1073/pnas.0400782101. [DOI] [PMC free article] [PubMed] [Google Scholar]
- Takahashi Y, Rayman JB, Dynlacht BD. Analysis of promoter binding by the E2F and pRB families in vivo: distinct E2F proteins mediate activation and repression. Genes Dev. 2000;14:804–816. [PMC free article] [PubMed] [Google Scholar]
- Tategu M, Arauchi T, Tanaka R, Nakagawa H, Yoshida K. Systems biology-based identification of crosstalk between E2F transcription factors and the Fanconi anemia pathway. Gene Regul Syst Bio. 2007;1:1–8. [PMC free article] [PubMed] [Google Scholar]
- Timmers C, Taniguchi T, Hejna J, Reifsteck C, Lucas L, Bruun D, Thayer M, Cox B, Olson S, D’Andrea AD, Moses R, Grompe M. Positional cloning of a novel Fanconi anemia gene, FANCD2. Mol Cell. 2001;7:241–248. doi: 10.1016/S1097-2765(01)00172-1. [DOI] [PubMed] [Google Scholar]
- Tischkowitz M, Ameziane N, Waisfisz Q, De Winter JP, Harris R, Taniguchi T, D’Andrea A, Hodgson SV, Mathew CG, Joenje H. Bi-allelic silencing of the Fanconi anaemia gene FANCF in acute myeloid leukaemia. Br J Haematol. 2003;123:469–471. doi: 10.1046/j.1365-2141.2003.04640.x. [DOI] [PubMed] [Google Scholar]
- van Dam S, Cordeiro R, Craig T, van Dam J, Wood SH, de Magalhães JP. GeneFriends: An online co-expression analysis tool to identify novel gene targets for aging and complex diseases. BMC Genomics. 2012;13:535. doi: 10.1186/1471-2164-13-535. [DOI] [PMC free article] [PubMed] [Google Scholar]
- Vaz F, Hanenberg H, Schuster B, Barker K, Wiek C, Erven V, Neveling K, Endt D, Kesterton I, Autore F, Fraternali F, Freund M, Hartmann L, Grimwade D, Roberts RG, Schaal H, Mohammed S, Rahman N, Schindler D, Mathew CG. Mutation of the RAD51C gene in a Fanconi anemia-like disorder. Nat Genet. 2010;42:406–409. doi: 10.1038/ng.570. [DOI] [PubMed] [Google Scholar]
- Venturi C, Bracco S, Cerase A, Cioni S, Galluzzi P, Gennari P, Vallone IM, Tinturini R, Vittori C, De Francesco S, Caini M, D’Ambrosio A, Toti P, Renieri A, Hadjistilianou T. Superselective ophthalmic artery infusion of melphalan for intraocular retinoblastoma: preliminary results from 140 treatments. Acta Ophthalmol. 2013;91:335–342. doi: 10.1111/j.1755-3768.2011.02296.x. [DOI] [PubMed] [Google Scholar]
- Waisfisz Q, Saar K, Morgan NV, Altay C, Leegwater PA, de Winter JP, Komatsu K, Evans GR, Wegner RD, Reis A, Joenje H, Arwert F, Mathew CG, Pronk JC, Digweed M. The Fanconi anemia group E gene, FANCE, maps to chromosome 6p. Am J Hum Genet. 1999;64:1400–1405. doi: 10.1086/302385. [DOI] [PMC free article] [PubMed] [Google Scholar]
- Wang W. Emergence of a DNA-damage response network consisting of Fanconi anaemia and BRCA proteins. Nat Rev Genet. 2007;8:735–748. doi: 10.1038/nrg2159. [DOI] [PubMed] [Google Scholar]
- Whitfield ML, Sherlock G, Saldanha AJ, Murray JI, Ball CA, Alexander KE, Matese JC, Perou CM, Hurt MM, Brown PO, Botstein D. Identification of genes periodically expressed in the human cell cycle and their expression in tumors. Mol Biol Cell. 2002;13:1977–2000. doi: 10.1091/mbc.02-02-0030.. [DOI] [PMC free article] [PubMed] [Google Scholar]
- Wilson JB, Yamamoto K, Marriott AS, Hussain S, Sung P, Hoatlin ME, Mathew CG, Takata M, Thompson LH, Kupfer GM, Jones NJ. FANCG promotes formation of a newly identified protein complex containing BRCA2, FANCD2 and XRCC3. Oncogene. 2008;27:3641–3652. doi: 10.1038/sj.onc.1211034. [DOI] [PubMed] [Google Scholar]
- Wreesmann VB, Estilo C, Eisele DW, Singh B, Wang SJ. Downregulation of Fanconi anemia genes in sporadic head and neck squamous cell carcinoma. ORL J Otorhinolaryngol Relat Spec. 2007;69:218–225. doi: 10.1159/000101542. [DOI] [PubMed] [Google Scholar]
- Wu C, Orozco C, Boyer J, Leglise M, Goodale J, Batalov S, Hodge CL, Haase J, Janes J, Huss JW, Su AI. BioGPS: an extensible and customizable portal for querying and organizing gene annotation resources. Genome Biology. 2009;10:R130. doi: 10.1186/gb-2009-10-11-r130. [DOI] [PMC free article] [PubMed] [Google Scholar]
- Xia B, Dorsman JC, Ameziane N, de Vries Y, Rooimans MA, Sheng Q, Pals G, Errami A, Gluckman E, Llera J, Wang W, Livingston DM, Joenje H, de Winter JP. Fanconi anemia is associated with a defect in the BRCA2 partner PALB2. Nat Genet. 2007;39:159–161. doi: 10.1038/ng1942. [DOI] [PubMed] [Google Scholar]
Associated Data
This section collects any data citations, data availability statements, or supplementary materials included in this article.
Supplementary Materials
Additional file 1: Figure S1: Differential cell cycle regulation of FA genes in human EVA-F cells. (a - left panel) Cells were placed on medium with low serum (0.2% FBS) for 3 days resulting in cell cycle arrest. The addition of high serum medium (10% FBS) released cells resulting in synchronous progression through the cell cycle. Sampled cells at different time points were divided for Fluorescent Activated Cell Sorting (FACS) analysis. Data represents one representative synchronization experiment. Quantitative RT-PCR was performed on RNA samples from different time points and mean fold changes (MFC) were calculated relative to time point zero. Data represents duplo qPCR measurements of one representative synchronization experiment, SEM is indicated. (a - right panel) Cell cycle control CCNE2 (b) FANCA and FANCG (c) FANCB and FANCL (d) FANCE, FANCC, and FANCF (e) FANCM (f) FANCD2 and FANCI (g) BRCA2, PALB2, BRCA1, and BRIP1. (TIFF 612 KB)
Additional file 2: Table S1: Expression in retinoblastoma tumors with MYCN amplification versus retinoblastoma tumors with RB1 mutations. Table S2 Summary regulation FA/BRCA-pathway genes cell model. Table S3 Summary results FA/BRCA-pathway genes “RB1/E2F disturbed cells”. Table S4 Co-expressed genes with input gene FANCA. Table S5 Co-expressed genes with input gene FANCA and BRCA1. Table S6 Medical Subject Headings (MeSH) enrichment of 50 genes co-expressed with FANCA and BRCA1. Table S7 Cellular Components (GO) enrichment of 50 genes co-expressed with FANCA and BRCA1. (DOC 210 KB)