Abstract
Čerenkov emission is generated from ionizing radiation in tissue above 264keV energy. This study presents the first examination of this optical emission as a surrogate for the absorbed superficial dose. Čerenkov emission was imaged from the surface of flat tissue phantoms irradiated with electrons, using a range of field sizes from 6cm×6cm to 20cm×20cm, incident angles from 0 to 50 degrees, and energies from 6 to 18 MeV. The Čerenkov images were compared with estimated superficial dose in phantoms from direct diode measurements, as well as calculations by Monte Carlo and the treatment planning system. Intensity images showed outstanding linear agreement (R2=0.97) with reference data of the known dose for energies from 6MeV to 18MeV. When orthogonal delivery was done, the in-plane and cross-plane dose distribution comparisons indicated very little difference (±2~4% differences) between the different methods of estimation as compared to Čerenkov light imaging. For an incident angle 50 degrees, the Čerenkov images and Monte Carlo simulation show excellent agreement with the diode data, but the treatment planning system (TPS) had at a larger error (OPT=±1~2%, Diode=±2~3%, TPS=±6~8% differences) as would be expected. The sampling depth of superficial dosimetry based on Čerenkov radiation has been simulated in layered skin model, showing the potential of sampling depth tuning by spectral filtering. Taken together, these measurements and simulations indicate that Čerenkov emission imaging might provide a valuable way to superficial dosimetry imaging from incident radiotherapy beams of electrons.
Keywords: Čerenkov, Surface dosimetry, Imaging, LIANC, External beam radiotherapy
1.0 Introduction
Knowledge of skin dose would be beneficial in a range of treatments if it could be measured accurately and within the acceptable workflow of patient throughput for fractionated therapy. Depending on clinical goals, skin may be included in the intended treatment volume or may be a dose limiting organ at risk. Many factors such as SSD (Yadav et al., 2009, Saw et al., 1994, Butson et al., 2003), beam types (electron or photon), beam energy (Bilge et al., 2010, Klein et al., 2003), field size, beam modifying devices (Bilge et al., 2010, Butson et al., 1996, Ling and Biggs, 1979, Spezi et al., 2001, Vatanen et al., 2009a, Vatanen et al., 2009b, Wang et al., 2012, Yadav et al., 2009), angle of incidence (Butson et al., 1996, Gerbi et al., 1987, Chow and Grigorov, 2007, Dogan and Glasgow, 2003)(Butson et al., 1996, Gerbi et al., 1987, Chow and Grigorov, 2007, Dogan and Glasgow, 2003)(Butson et al., 1996, Gerbi et al., 1987, Chow and Grigorov, 2007, Dogan and Glasgow, 2003), complexities and deformation of the patients’ surface profiles and heterogeneities of the internal tissue (Chung et al., 2005, Court et al., 2008, Higgins et al., 2007b, Qi et al., 2009, Shiau et al., 2012, Nakano et al., 2012, Quach et al., 2000) lead to the difficulty in achieving accurate surface dosimetry estimates or measurements. In all of these factors, the incident angle with respect to the normal direction of the surface is one of the more complex issues which affects skin dose. Irregular surface profiles of the treatment region decrease the accuracy of superficial dose prediction and may result in under-dosing or over-dosing in the delivered dose for specified treatment plans. Conventional surface dosimetry methods such as radiochromic film (Butson et al., 2004, Chiu-Tsao and Chan, 2009, Devic et al., 2006, Klein et al., 2003, Nakano et al., 2012, Roberson et al., 2008), ionization chamber (Apipunyasopon et al., 2012, Chen et al., 2010, Klein et al., 2003, Wang et al., 2012), MOSFETs (Gladstone and Chin, 1995, Gladstone et al., 1994, Qi et al., 2009, Quach et al., 2000, Xiang et al., 2007) and TLDs (Kron et al., 1996, Kron et al., 1993, Lin et al., 2001, Nilsson and Sorcini, 1989) have been proven to be able to measure superficial dose, however these techniques require clinical intervention and additional personnel time for use. Each are limited by small fixed region measurements and sensitivity is often a function of angular orientation of the detector with respect to the incident beam. Film and TLDs have longer offline processing procedures which prevent superficial dose monitoring in real time. In this study, the ability to directly image light emission from the tissue phantoms was examined as a potential method of real time, in-vivo surface dosimetry in patients.
Although treatment planning systems can be used to calculate the superficial dose, factors such as patient motion, deformation and weight loss during fractionated radiotherapy potentially contribute to errors between calculated superficial dose and the superficial dose actually delivered. Also, the treatment planning system (TPS) algorithms provide their least accurate predictions at the patient surface (Chung et al., 2005, Court et al., 2008, Devic et al., 2006, Fraass et al., 1998). Commercial treatment planning systems have recently included Monte Carlo algorithms with the potential of more accurate superficial dose. For practical reasons, these algorithms have been optimized for calculation speed rather than accuracy near the surface. Furthermore the models are fit to measured dosimetry data which may introduce uncertainties or inaccuracies at the surface due to measurement instrumentation. Thus, an accurate, real time, superficial dose measurement method such as the one explored in this paper is needed to address these issues.
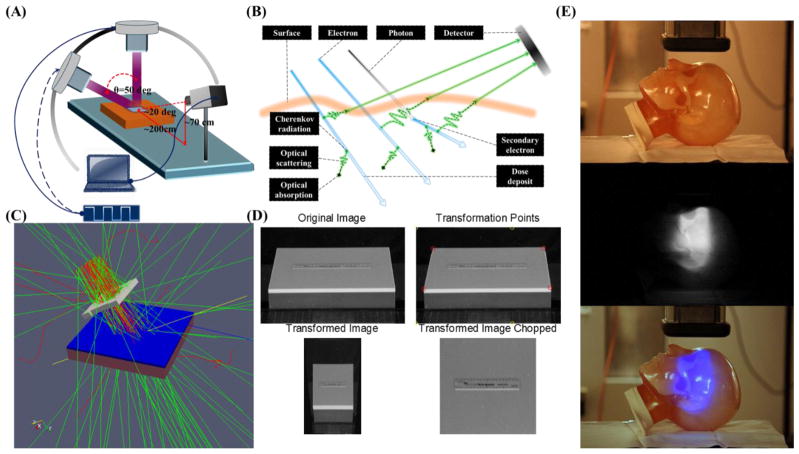
It is well known that Čerenkov radiation emission occurs when charged particles move in dielectric medium, such as water and biological tissue, with a phase speed greater than the speed of light in that medium (Cherenkov, 1938). The Čerenkov effect induces continuous wavelengths of emission from the ultraviolet down to the near-infrared. Frank-Tamm’s formula shows that the spectral intensity emitted varies as the inverse square of the wavelength, and thus Čerenkov light is observed as highly weighted to the blue wavelength ranges (Cherenkov, 1938, Jelley, 1955). Recently, Čerenkov radiation was measured from megavoltage external photon and electron beams during radiotherapy in both water and tissue (Glaser et al., 2013a, Zhang et al., 2012, Axelsson et al., 2011). Furthermore, it has been shown that, above the threshold energy for Čerenkov radiation (approximately 264KeV in water), under the approximation of charged particle equilibrium, the dose deposited by megavoltage radiotherapy radiation, and the number of Čerenkov photons released locally are directly proportional to each other (Glaser et al., 2013a). Simulation showed the CSDA range of electrons, with kinetic energy below the threshold energy in the medium (such as water or tissue) is around 0.1 mm. Due to scattering of electrons, the absolute detoured distance of travel below the threshold energy of Čerenkov radiation is actually smaller than the CSDA range. This means that, to a resolution of 0.1 mm, with the approximation of charged particle equilibrium, the dose contributed by those charged particles below the threshold energy will simply be a constant offset of the dose contributed by charged particles above the threshold energy. As shown in Figure 1B, high energy particles deposit energy to the environment through interactions (soft and hard collisions) with the environment during their transport. Čerenkov photons are emitted along the path of primary and secondary charged particles and the intensity of Čerenkov radiation emission is proportional to the locally deposited dose. Depending on the optical properties of the phantom or tissue, Čerenkov photons generated in a thin layer at the surface will be scattered and finally escape the surface to be detected. Thus the superficial dose distribution can be assessed by imaging.
Figure 1.
(A) The geometry of the measurement system. CMOS camera was supported 2 meters away and 0.7 meter above the surface of the water equivalent phantom (300mm×300mm×40mm) and a computer was connected to the camera to remote control. (B) High energy particles deposit energy to the environment during transportation. Čerenkov photons will be emitted along the path of primary and secondary charged particles and the intensity of Čerenkov radiation emission is proportional to the deposited energy locally. Depending on the optical properties of the phantom or tissue, Čerenkov photons generated in a thin layer of surface will be scattered and finally escape the surface to be detected by the camera. (C) The geometry of Monte Carlo simulation in GAMOS. Dose has been scored in a 300mm×300mm×10mm water phantom with voxel size of 0.5mm×0.5mm×0.1mm. (D) Image transformation process to correct the perspective aberration. (E) Čerenkov emission image of phantom with complex surface profile.
In this study, direct imaging of Čerenkov radiation emission resulting from external beam radiotherapy of tissue phantoms was utilized to compare superficial dose using a range of calculated and measured estimates. The light emission was imaged with a commercial CMOS camera in a darkened radiation treatment room, avoiding issues of light contamination, although it is also possible to gate imaging in a room with ambient lighting (Glaser et al., 2012). Different integration times were studied to quantify the signal to noise ratio (SNR) achievable. Electron beams were imaged in this study, since they are routinely used for superficial radiotherapy treatments, and energies in the 6MeV~18MeV range were studied, with field sizes from 6cm×6cm to 20cm×20cm. A range of incident angles were used from 0 to 50 degrees, to show how the superficial dose varies with incident angle and to explore a regime where measurements are known to disagree with most treatment planning system predictions. Sampling depth of superficial dosimetry based Čerenkov emission for 9 MeV electron beam has been investigated in layered skin model with typical optical properties.
2.0 Materials & Methods
2.1 Phantom Surface Imaging
The experiments were performed with a linear accelerator (Varian Clinic 2100CD, Varian Medical Systems, Palo Alto, USA) at the Norris Cotton Cancer Center in the Dartmouth-Hitchcock Medical Center. As shown in Figure 1A, a solid water equivalent phantom (Plastic Water, CNMC, USA) of 300mm by 300mm by 40 mm was irradiated by electron beams at SSD = 110cm to allow an unobstructed view of the surface by the camera. The measurement system consisted of CMOS camera (Rebel T3i, Canon, Japan) which was mounted 2 meters away and 0.7 meter above the surface center of the phantom and a computer which was used to remotely control the camera outside the radiotherapy room. Images of the phantom surface were taken during irradiation of the phantom for different integration times, field sizes, energies and incident angles. Integration time varied from 1 sec to 30 sec. The essentials parameters adopted in this study has been listed in Table 1. SNR of the images for different integration time was calculated. Beam field size from 6cm×6cm to 20cm×20cm were investigated. To investigate how the superficial dose distribution varies with incident angle, a 10cm×10cm electron beam was directed towards the surface with incident angles from 0 to 50 degrees in 10 degrees increments. For the proof of concept, an anthropomorphic head phantom with complex surface profiles was imaged while irradiating with a 9MeV electron beam. The dose rate was 1000MU/min for all measurements.
Table 1.
Essentials parameters of the camera adopted in this study.
| Dimensions (W×H×D) | Weight (body only) | Shutter speed | Resolution | Number of Pixels | ISO | f number | Focal length |
|---|---|---|---|---|---|---|---|
| 133.1×99.5×79.7mm | 515g | 1 to 30 sec | 5184×3456 | 17.90 Megapixels | 6400 | 5.6 | 116mm |
2.2 Monte Carlo Simulation
2.2.1 Radiation Dose
This study used the GEANT4 based toolkit GAMOS for Monte Carlo modeling to stochastically simulate radiation transport and dose calculation in order to objectively compare measurements with theoretical predictions. As shown in Figure 1C, the physical measurements were modeled in GAMOS using water as the medium. Since we were primarily concerned with the dose deposited in a thin layer of the phantom a 10mm thick layer of the phantom was voxelised into 0.5×0.5×0.1mm3 rectangular cubes. A phase space file of the 9MeV electron beam for Varian Clinic 2100CD had been generated elsewhere (Capote, 2012) and adopted as the source of the simulation. Primary particles were initialized from the phase space file and propagated through the defined phantom. Both primary and secondary particles have been included in the dose calculation. For each voxel, the dose deposited has been calculated by the built-in dose scorer of GAMOS. One hundred million primary particles were generated from the phase space file and transport was simulated in the phantom. The simulated dose for 1mm thickness in depth was integrated and compared with the Čerenkov emission images and TPS data from experiments for incident angles of 0 and 50 degrees.
2.2.2 Sampling Depth in a Layered Skin Model
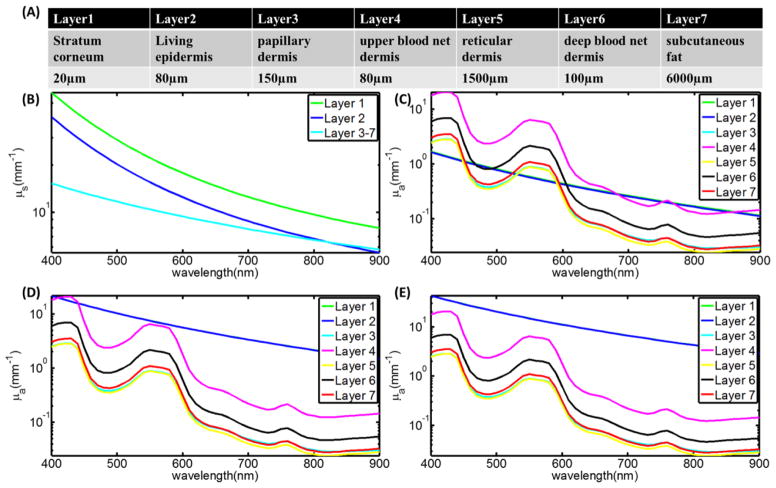
Thickness and optical properties of layers of the skin have been reported in several papers, and here we used the well characterized model by Meglinski et al (Meglinski and Matcher, 2002). This layered skin model (flat phantom with size of 300×300×40 mm3) was built in GAMOS with each layer having the corresponding thickness and optical properties (refractive index, absorption and scattering coefficient). Three kinds of skin (skin 1: lightly pigmented skin (~1% melanin in epidermis), skin 2: moderately pigmented (~12% melanin in epidermis), skin 3: darkly pigmented (~30% melanin in epidermis)) have been investigated. The thickness of each layer of the skin and corresponding optical properties are shown in Figure 2. Figure 2A lists the name and thickness of each layer of human skin. Figure 2B shows the scattering coefficient of each layer and Figure 2(C–E) shows the absorption coefficient of each layer for the three types of skin. The same phase space file (10cm×10cm, 9 MeV electron beam) was adopted to simulate the irradiation of this model phantom. Čerenkov photons were generated and tracked through processes including Mie scattering, absorption, reflection and refraction at the boundary. The generation of Čerenkov photons and transport of optical photons have been explained in detail by previous studies (Zhang et al., 2012, Glaser et al., 2013b). For any Čerenkov photon escaping the entrance surface of the phantom, initial positions and final energy were recorded. The depth of all the Čerenkov photons escaping the entrance surface was logged in a histogram and then this shape was fitted by a single exponential decay. The effective sampling depth (depth where the detection sensitivity drops to 1/e) was calculated. Sampling depth tuning based on spectral filtering can be discerned from the results of this simulation.
Figure 2.
(A) Name and thickness of each layer of human skin. (B) The scattering coefficient of each layer. (C–E) The absorption coefficient of each layer for the three types of skins.
2.3 Treatment planning system (TPS) prediction
The geometry used in the Monte Carlo simulations was defined here, with a water phantom 300×300×40 mm3 simulated in the treatment plan system (Varian Medical Systems, Eclipse electron Monte Carlo algorithm EMC1028). The phantom was placed at source to surface distance (SSD) = 110cm and had voxels of size of 0.5×0.5×1mm3. A 10cm×10cm 9MeV electron beam was defined in the TPS and phantom irradiation was modeled with 0 and 50 degrees incident angles. Dose was calculated for each voxel and exported as DICOM files for further processing. The Eclipse Monte Carlo based dose algorithm was used for these studies.
2.4 Water tank diode scan
Both cross plane (CP) and in plane (IP) diode scans (IBA EDF 3G) for 10cm×10cm 9MeV electron beam with incident angles of 0 and 50 degrees were measured in a water tank beam scanning system (Blue Phantom, IBA, Bartlett, USA). The silicon diode used for scanning was 2mm diameter. The diode was placed at the surface of the water and scanned for both CP and IP with step size of 0.3mm.
2.5 Image processing
Background images were taken when the beam was off. All raw images were converted to grayscale images and then median filtered by a 15 pixels × 15 pixels kernel in MATLAB 2011a (The MathWorks Inc., Natick, MA). As shown in Figure 1A and Figure 1D, perspective distortion exists in the images since the camera was at an angle about 20 degrees with respect to the phantom surface. Due to the perspective distortion, the square shape phantom looks like ladder-shaped. Figure 1D shows how the perspective distortion has been corrected. In the reference white light image, four corner points (Q) of the surface of the phantom and four corresponding objective points (P) were chosen, positions of the four corners of the flat phantom (ladder-shaped in the image, indicated by red circles in Fig. 1D) has been transformed to four corners of a pre-defined square (indicated by yellow circles in Fig. 1D). A transformation matrix (T) was calculated based on those four pairs of points by 2-D optimal affine transformation (Eq. 1) and applied to transform the images. Since we know what we imaged is the surface of a flat phantom, all the transformation of the image only needs to be done on the plane of the surface of the flat phantom. Thus, only (x, y) coordinates on the plane is needed, z will not provide any information since what we imaged is not a 3-D surface profile. After the transformation, the background image of the phantom was subtracted from the transformed images. The size of the background corrected, transformed image was 3456×3456 and with resolution of sub-millimeter.
| (Eq. 1) |
3.0 Results
3.1 Čerenkov emission images of head phantom
As shown in Figure 1E, a white light image of the phantom was taken with ambient light on. One side of the head phantom with complex surface profile was imaged while irradiating by a 10cm×10cm 9MeV electron beam with ambient light off for 10 sec. For a proof of concept, the Čerenkov emission image of the phantom was added to the blue channel of the white light image to show how superficial dose distribution could be potentially affected by the complex surface profile and imaged based on Čerenkov emission.
3.2 Different integration time and SNR
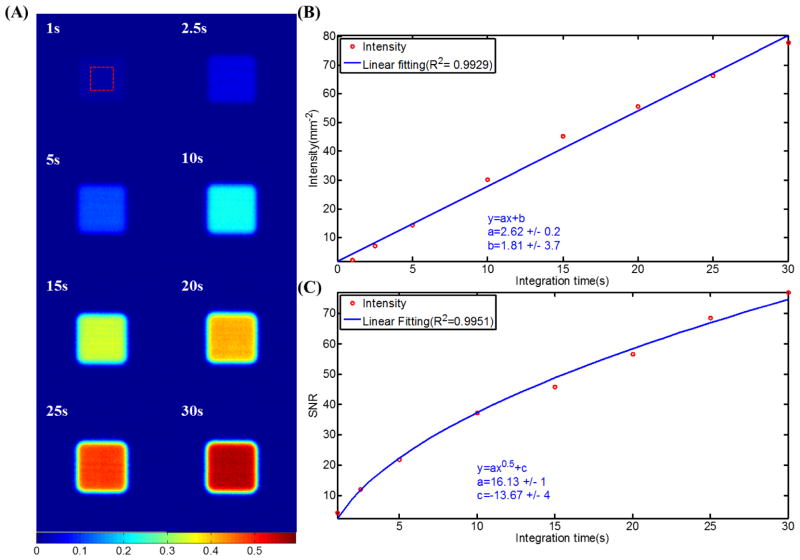
Čerenkov emission images of 10cm×10cm 9MeV electron beams for integration time from 1 sec to 30 sec are shown in Figure 3A. Intensity of each image was calculated by summing up all the pixel values. Figure 3B shows that the normalized intensity is proportional to integration time with R2=0.99. SNR was calculated by the ratio of the mean value of a 400 pixels square region in the center and the standard deviation of that region. Figure 3C shows that the SNR increases from approximately 2 to 75 for integration time from 1 sec to 30 sec. Fitting of the SNR with integration time showed that SNR increases with the square root of integration time with R2>0.99.
Figure 3.
(A) Čerenkov emission images of 10cm×10cm 9MeV electron beams for integration time from 1 sec to 30 sec. (B) Intensities of the images plot with integration time and linear fitting. (C) SNR of the images plot with integration time and fitting.
3. 3 Different field size
Figure 4A shows the images of 9 MeV electron beams of field size from 6cm×6cm to 20cm×20cm for 30 sec integration time. The intensity of each image was calculated by summing up all the pixel values in the beam. Figure 4B shows that the intensity (normalized by the intensity of the 20cm×20cm beam) was simply directly proportional to the area of the beam with R2>0.99, as would be expected.
Figure 4.
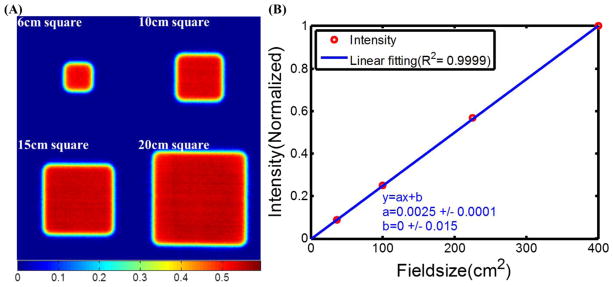
(A) Čerenkov emission images of 9MeV electron beams of field sizes from 6cm×6cm to 20cm×20cm. (B) Intensities of the images plot with field size and linear fitting.
3.4 Different energies
Čerenkov emission images of 10cm×10cm electron beams with energies from 6 MeV to 18 MeV are shown in Figure 5A, using a 30 second integration for each. The intensity of a chosen 400 pixels square region in the center of each image was calculated by summing up all the pixel values belonging to the chosen region. Superficial dose reference data (the fraction of superficial dose with respect to the dose at dmax) has been extracted from the depth dose profiles measured by ionization chamber scanning under the same experimental conditions (Field size = 10cm×10cm, SSD = 110cm). Figure 5B shows that the normalized intensity was proportional to the reference superficial dose data of corresponding energies with R2=0.97.
Figure 5.
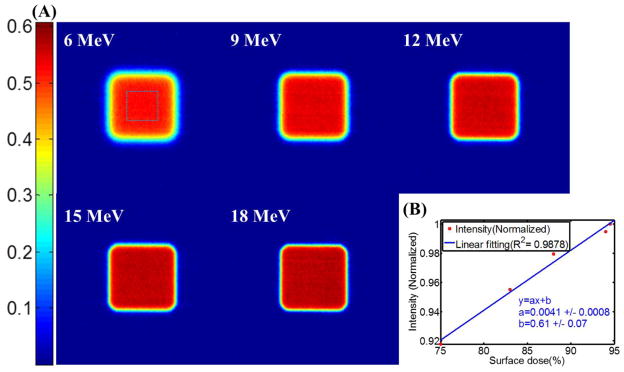
(A) Čerenkov emission images of 10cm×10cm electron beams of energies from 6MeV to 18MeV. (B) Intensities of the images plot with superficial dose reference data.
3.5 Different incident angles and comparison
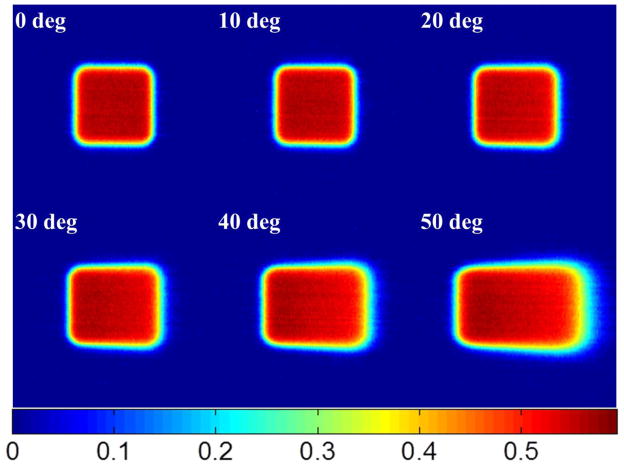
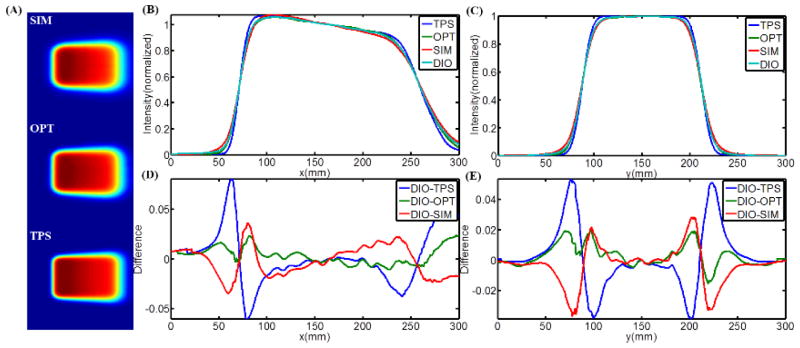
Čerenkov emission images of a 10cm×10cm beam are shown in Figure 6, with incident angles from 0 to 50 degrees with respect to the normal of the phantom surface. To quantify how accurate the images are in assessing the distribution of superficial dose, these images were directly compared with each of 1) Monte Carlo simulation data, 2) TPS data, and 3) water tank diode scanning measurements. The 2-D superficial dose distributions from Monte Carlo simulation, Čerenkov emission imaging and TPS were smoothed by a bilateral filter (Lee et al., 2008) and the data are shown in Figure 7A. The CP and IP profiles of the Monte Carlo simulations, TPS data and water tank diode scanning have been aligned to match the middle points of full width half max (FWHM) of the profiles of Čerenkov images. All the profiles were normalized to the values of the middle points of their own FWHM and are plotted in Figure 7B and Figure 7C. For the convenience of comparison, all the CP and IP profiles have been interpolated to be a step size of 0.5mm between 0 and 300mm. In Figure 7D and Figure 7E, the difference between diode scanning data and data from other three techniques has been calculated by subtracting and plotted for both CP and IP scanning. Similar data processing and plots are shown for 50 degrees incident angle in Figure 8. Maximum and average (average of the absolute values of disagreements) disagreements between diode scanning data and data from other three techniques has been listed in Table 2.
Figure 6.
Čerenkov emission images of 10cm×10cm electron beams with incident angles from 0 to 50 degrees.
Figure 7.
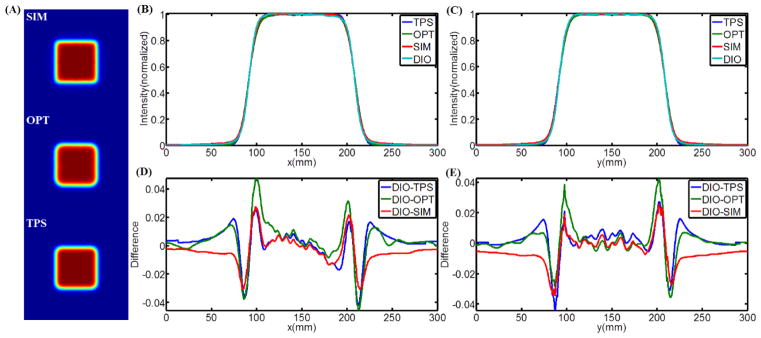
(A) 2-D superficial dose distribution from Monte Carlo simulation, Čerenkov emission imaging and TPS for 0 incident angle. (B–C) CP and IP superficial dose profiles of the results from Monte Carlo simulation, Čerenkov emission imaging, TPS and water tank diode scanning. (D–E) CP and IP difference between the profiles from water tank diode scanning and other three techniques.
Figure 8.
(A) 2-D superficial dose distribution from Monte Carlo simulation (SIM), Čerenkov emission imaging (OPT) and TPS for 50 degrees incident angle. (B–C) CP and IP superficial dose profiles of the results from Monte Carlo simulation, Čerenkov emission imaging, TPS and water tank diode scanning. (D–E) CP and IP difference between the profiles from water tank diode scanning and other three techniques.
Table 2.
Maximum and average disagreements for CP/IP scanned profiles.
| Incident angle (degree) | Scan directions | Maximum difference (%) | Average difference (%) | ||||
|---|---|---|---|---|---|---|---|
| DIO-OPT | DIO-SIM | DIO-TPS | DIO-OPT | DIO-SIM | DIO-TPS | ||
| 0 | CP | +4.6/−4.6 | +2.7/−3.1 | +2.5/−4.2 | 0.8 | 0.7 | 0.8 |
| IP | +4.3/−3.6 | +2.6/−3.4 | +2.7/−4.4 | 0.6 | 0.8 | 0.6 | |
| 50 | CP | +2.3/−1.1 | +3.6/−3.4 | +8.0/−6.0 | 0.7 | 1.3 | 2.0 |
| IP | +2.0/−1.6 | 2.8/−3.7 | +5.4/−3.9 | 0.5 | 0.8 | 1.3 | |
3.6 Sampling Depth in Layered Skin Model
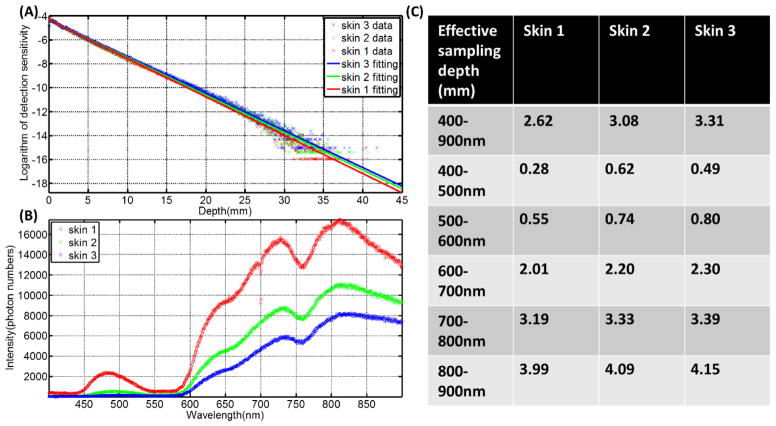
The sampling depth distribution of Čerenkov photons and corresponding exponential fitting for average emission depth of origin is shown in Figure 9A for the three types of increasing skin pigment. Figure 9B shows the spectrum of Čerenkov emission on the surface, with the predominant emissions in the red and infrared wavelengths, and increasing overall emission for decreasing skin pigment, as might be expected. Effective sampling depth for different wavelength ranges (400 nm to 900 nm (overall), 400 nm to 500 nm, 500 nm to 600 nm, 600 nm to 700 nm, 700 nm to 800 nm and 800 nm to 900 nm) are listed in Figure 9C, illustrating that the sampling depth changes substantially with wavelength range. In fact, wavelength range changes affect the emission sensitivity depth by more than an order of magnitude, whereas skin pigment changes alter this value by less than a factor of 2.
Figure 9.
(A) The sampling depth distribution of Čerenkov photons and corresponding exponential fitting for the three types of skin. (B) The spectrum of Čerenkov emission from the surface. (C) Effective sampling depth for different wavelength ranges.
4.0 Discussion
Unlike conventional superficial dose measurement techniques such as radiochromic film, ionization chamber, MOSFET, diodes, or TLDs, superficial dose assessment based on Čerenkov emission imaging does not require anything to be put on or near the surface of the patient, and is implicitly being emitted from every patient already undergoing radiation therapy. The significant value of this approach is that, the spatial resolution of Čerenkov images is sub-millimeter, which is much higher than any other conventional superficial dose measurement techniques. While film has similar spatial resolution, it clearly does not have the rapid and repeated ability to image that Čerenkov imaging have. Additionally, real time superficial dose assessment during radiotherapy could be realized by this technique and could be potentially adopted to monitor the treatment. Thus, while the imaging examined here is in a very early phase, the potential value of adding this imaging into conventional radiation therapy monitoring could be quite important. The goal of this work was simply to examine the methodology for its potential value.
A key figure of merit is if the imaging can be quantitatively correlated to superficial dose. To test this, Figure 1E shows that, for a complex surface profile, the Čerenkov imaging technique could potentially image the superficial dose distribution. However, limited by the fact that the phantom is not optically tissue equivalent and there is a lack of information about the complex surface profile in 3-D, quantitative result cannot be gained from the testing Figure 1E at this point. However, for real tissue or tissue equivalent phantom, due to the internal highly scattering effect of optical photons, the angular distribution of Čerenkov photons escaped the surface will be close to Lambertian distribution exists in perfect diffusive medium(Lambert, 1760). Under the approximation of Lambertian distribution, intensity change of each pixel due to viewing angle and distance will be compensated exactly by the corresponding changes of solid angle and area of emission contributing signal to the pixel. Therefore, the radiance emitted will be independent of viewing angle and positions(Lambert, 1760). In other words, angular and distance (such as inverse square) corrections of Čerenkov images of tissue surface are not necessary for the first order of approximation, which greatly simplifies image correction especially for flat and complex surface profiles. For flat and regular region, like the flat phantom investigated in this study, Čerenkov images could be transformed by the affine transformation to correct perspective distortion. For complex surface profiles, this problem becomes registration of 2-D Čerenkov images to the corresponding 3-D surface profiles. Radiotherapy monitoring system (e.g. AlignRT®, Vision RT; Catalyst™, C-Rad) incorporating optical 3-D surface imaging techniques(Geng, 2011) are able to measure the complex surface profiles of the treatment region accurately. By transform the coordinate systems of the 3D surface profiles and the 2D Čerenkov images to share the same x-y plane, pixels in the 2D Čerenkov images could potentially be registered to the corresponding small region on the 3D surface profiles.
Tissue optical properties (absorption and scattering) could be measured to estimate the emissivity of Čerenkov emission. Figure 3B shows that the intensity of the image is linear with the integration time with R2=0.97, indicating that for a fixed geometry the reliability is outstanding. Thus, given the right tissue curvature and emissivity corrections, the imaging could be quite quantitative. The effects of field size and beam energy would be of interest, in particular to ensure that the imaging quantifies the effects in terms of dose accurately. Figure 4A shows the ability of Čerenkov imaging technique for radiotherapy beams with different field sizes (6cm×6cm to 20cm×20cm). From Figure 4B, the linearity between the field size and integrated intensity (summing up all the pixel values in the beam) is outstanding (R2>0.99). In Figure 5, Čerenkov images for 10cm×10cm electron beams of energies from 6MeV to 18MeV indicates that the intensities are proportional (R2=0.97) to the corresponding superficial dose reference data. Thus in this controlled geometry, there is outstanding reliability to quantify superficial dose in the situation of changing beam size and energy.
Another important feature of this type of dosimetry is the ability to image quickly with high spatial resolution. To test this, the data in Figure 3C shows that for integration times from 1 sec to 30 sec, the SNR of the images varies from 2 to 75. Most importantly, for a relatively short integration such as 5 sec, the SNR is above 20. The image processing (median filtering and perspective view transformation by not thoroughly optimized algorithms) takes less than 1 sec on a reasonable configured laptop, which further proves that superficial dose monitoring could be realized in real time or short time post therapy by this technique, with updated images on the second timescale.
Perhaps the most important potential advantage for superficial dose imaging is to quantify the values when the incident beam is tangential or at high oblique angle to the tissue. This was tested using a 10cm×10cm 9MeV electron beam with incident angles from 0 to 50 degrees (Figure 6). As seen here, the superficial dose distribution was highly sensitive to incident angle, with variation especially for large angles with respect to the normal direction of the surface. Thus, for treatment plans including beams incident at large angles such as tangential beam for breast or chest wall treatment (Hong et al., 1997, Hong et al., 1999, Li et al., 2004), monitoring the surface is important. However it is not obvious which method of estimating superficial dose is most accurate in this setting. To quantify how accurate the Čerenkov imaging technique was, it was compared to superficial dose estimates from Monte Carlo simulation, TPS predication and water tank diode scan measurements. The difference of the CP and IP profiles were calculated with the data compared to diode measurement data. For an incident angle of 0 degrees, Figures 6D and 6E show that the difference of Čerenkov images, TPS data and Monte Carlo simulation with diode scanning are ±4%, ±3~4% and ±2~3% approximately (Table 2). Yet for incidence of 50 degrees, Figures 7D and Figure 8E show that the corresponding differences are ±1~2%, ±6~8% and ±2~3% (Table 2). It is known that TPS based on Monte Carlo algorithm may compromise the accuracy for calculation speed and also that the TPS is tuned to reproduce the input measurements (Van Dyk, 2008, Jamema et al., 2008), typically made with cylindrical ionization chambers. Secondly, in TPS, dose is generally calculated in voxelised volume from the CT scan. However, the voxelised phantom does not render the surface profiles well (a more accurate way is mesh based surface profiles) and thus the transport and interaction of radiation near the surface will not be simulated to high accuracy. Even assuming that treatment planning systems can be used to calculate the superficial dose accurately, factors such as patient setting up and motion, deformation and weight loss during fractionated radiotherapy potentially contribute to errors between calculated superficial dose and superficial dose actually delivered. Dose prediction errors have been found in TPS when the region of interest is near the surface (Chung et al., 2005, Court et al., 2008, Devic et al., 2006, Fraass et al., 1998, Court and Tishler, 2007, Higgins et al., 2007a), which explains why Čerenkov images and Monte Carlo simulation have shown better agreement with the diode scanning than the TPS, especially for large incident angles.
Although the Čerenkov imaging has shown certain advantages for superficial dose assessment, several important issues exist which needs to be clarified by further investigation and validation. At first, the ambient light was shut off completely in this study through darkening the room, and blocking off all indicator lights. However, in real radiotherapy treatments, a minimum amount of ambient is essential for the patient comfort and for the radiation therapy technicians to do their job. To solve this problem, temporal-gating of image acquisition was demonstrated in a previous study, and could be adopted in the future clinical use (Glaser et al., 2012, Zhang et al., 2012). This gated camera was not available at the time of this preliminary study, and so was not utilized, but it is sufficient to image Čerenkov in the presence of a low level room light (Glaser et al., 2012).
A second issue is that the optical properties of the patients’ skin need to be considered to correct for the emissivity of the Čerenkov light, sampling depth and finally correlation of the intensity of the Čerenkov image with absolute dose value. If the optical properties of region of interest (ROI) are homogenous, the superficial dose distribution will not be affected. However, if heterogeneities exist in ROI, information of optical properties of ROI are needed for correction of the image. Optical properties will also affect the sampling depth of Čerenkov images. As shown in Figure 9A, the sampling depth distribution is sensitive to optical properties of the skin model. For skin types that are more pigmented (more melanin in the epidermis (layer 2)), the sampling depth distribution spreads slightly wider, which means that the sampling region is a bit deeper for more pigmented skin. This observation might be a bit counter intuitive, but is caused by the presence of the absorber melanin being present in the superficial layer of the skin, meaning that as this pigment increases in concentration, it preferentially absorbs the light generated in the top layers of the skin.
As mentioned before, the spectral emission of Čerenkov intensity is proportional to the inverse-square of the wavelength and weighed more highly in the short wavelength ranges. However, Čerenkov photons with short wavelengths are generally more likely to be absorbed in tissue which leads to the spectrum of emission from the surface being weighted more to the NIR region (700 nm to 900 nm) (Figure 9B). The sensitivity of sampling depth depends on optical properties, increasing the complexity of superficial dosimetry based on Čerenkov radiation. In practice, optical properties of skin can be measured non-invasively and accurately by techniques such as reflectance spectroscopy (Vishwanath et al., 2011) and thus sampling depth could be estimated. An interesting observation from the simulations done here is that the sampling depth could be tuned by spectral filtering (Figure 9C). As the spectral filtering range is varied from 400~500 nm to 800~900 nm, the effective sampling depth increases from 0.28 mm to 3.99 mm, 0.62 mm to 4.09 mm and 0.49 mm to 4.15 mm for the three types of skin. This spectral filtering could limit the number of photons detected, thus comprising the image quality, but methods to compensate for this could be through the use of more sensitive imaging cameras, such as an Intensified CCD camera or longer acquisition times if possible. This is a topic for following studies, in which biological phantoms with different optical properties will be imaged while irradiating to determine how the optical properties and spectral filtering will affect the Čerenkov imaging.
In this study, we have focused on comparing the relative dose values because of the challenges of calibrating Čerenkov intensity to absolute dose for different optical properties. Within this context, the diode is a better choice than ionization chamber, because the diode is the smallest detector (diameter about 2mm) and thus can measure the dose distribution with a higher spatial resolution, more closely matching what can be achieved with the Čerenkov imaging. Absolute values of dose are optimally measured with ionization chamber, albeit at coarser spatial resolution, but in this study the Čerenkov images are normalized to peak values anyway, and this would be the likely usage. Ionization chamber measurements would be much coarser resolution and potentially would not match because of the large mismatch in sampling volume. This is especially important in regions of beam edges where the field changes rapidly with location. The sampling depth of the diode used in this study is about 1~2 mm. From the simulated results in layered skin model, for typical tissue optical properties, most of the detected Čerenkov photons generated within 2 mm underneath the surface. Thus, comparing the Čerenkov images with diode scanning and simulated dose within 1 mm underneath the surface (Figure 7 and Figure 8) should be a reasonable approximation. Another reason we use diode is that the stopping power of silicon is very similar to water, unlike ionization chamber where correction due to stopping power difference between air and water is needed.
The camera system used in this study has high resolution, and can capture changes with sub-millimeter resolution. While most Čerenkov and dose variations are slow functions of space, there are instances where this is not the case, such as in tissue folds or edges, and this is exactly where imaging can help. More abstractly, dose has likely never been imaged with this high level of spatial resolution, so advancing this technology to the point where it can be utilized to determine where there are high resolution changes in dose would be a worthy effort. However, when it comes to complex surface profiles such as whole breast cancer radiotherapy and head and neck treatment, the curvature of the surface will varies dramatically even with in several millimeters. Since superficial dose is highly dependent on the curvature of the surface, higher resolution is very useful to provide more detailed dose distribution, especially for complex surface profiles. Plus, even for a flat phantom, higher resolution could potentially reveal small hot or cold spots which may be blind to conventional measurement methods due to the resolution issue. Pixel binning may benefit the acquisition speed and SNR of the image. However, higher acquisition speed and SNR could also be achieved by imaging with more sensitive devices such as an Intensified CCD without compromising the resolution.
Finally, this study has focused on using electron beams instead of photon beams because electrons are frequently used to treat tumors near the skin. However, it has been shown that megavoltage X-ray beam generate secondary charged particles which emits Čerenkov radiation and can be detected directly by imaging techniques (Glaser et al., 2013a). Recently, Čerenkov radiation generated in fiber arrays has been applied for megavoltage X-ray imaging (Teymurazyan and Pang, 2012). Future studies will investigate use of Čerenkov emission to monitor superficial dose in X-ray beams for entrance and exit dosimetry. Image transformation and registration algorithms need to be designed to map the 2-D projected images to the 3-D surface profiles obtained by complimentary techniques such as CT, MRI, or optical stereotactic technologies. It is also possible, that Čerenkov emission might ultimately be better used to detect other features during radiation therapy such as variations in flatness and symmetry, or changes in output at the center of the beam with field size. These would require different measures of utility, and would have to be the focus of future studies that required these applications.
5.0 Conclusions
This work presents the first demonstration of Čerenkov emission surface imaging in a therapeutic radiation therapy beam, and demonstrates a high degree of correlation to superficial dose. While the work is a preliminary study in phantoms, and does not have all the nuance of problems associated with patient imaging, it is clear that this signal is emitted from all patients, and in-vivo dosimetry via quantitative imaging should be possible with further development. This study demonstrates that surface Čerenkov emission is linear with dose, and quantitative optical imaging estimates the superficial dose accurately with variation in beam energy, size, and angle of incidence, to a level of error which appears suitable for practical monitoring of patients. Superficial dose can be imaged directly with a camera, and presented in real time to the radiation therapist control area. Simulation results in layered skin model shows the sensitivity of sampling depth depending on typical skin optical properties and suggested the potential of sampling depth tuning based on spectral filtering. The phenomenon is in an early stage of discovery, but has significant potential for real time patient monitoring.
Acknowledgments
This work has been funded in part by the Norris Cotton Cancer Center Developmental Pilot Project Funds, and by the NIH grant R01CA109544.
7.0 References
- APIPUNYASOPON L, SRISATIT S, PHAISANGITTISAKUL N. An investigation of the depth dose in the build-up region, and surface dose for a 6-MV therapeutic photon beam: Monte Carlo simulation and measurements. J Radiat Res. 2012 doi: 10.1093/jrr/rrs097. [DOI] [PMC free article] [PubMed] [Google Scholar]
- AXELSSON J, DAVIS SC, GLADSTONE DJ, POGUE BW. Čerenkov emission induced by external beam radiation stimulates molecular fluorescence. Med Phys. 2011;38:4127–32. doi: 10.1118/1.3592646. [DOI] [PMC free article] [PubMed] [Google Scholar]
- BILGE H, OZBEK N, OKUTAN M, CAKIR A, ACAR H. Surface dose and build-up region measurements with wedge filters for 6 and 18 MV photon beams. Jpn J Radiol. 2010;28:110–6. doi: 10.1007/s11604-009-0393-5. [DOI] [PubMed] [Google Scholar]
- BUTSON MJ, CHEUNG T, YU PK. Variations in 6MV x-ray radiotherapy build-up dose with treatment distance. Australas Phys Eng Sci Med. 2003;26:88–90. [PubMed] [Google Scholar]
- BUTSON MJ, CHEUNG T, YU PK, CURRIE M. Surface dose extrapolation measurements with radiographic film. Phys Med Biol. 2004;49:N197–201. doi: 10.1088/0031-9155/49/13/n03. [DOI] [PubMed] [Google Scholar]
- BUTSON MJ, PEREZ MD, MATHUR JN, METCALFE PE. 6MV x-ray dose in the build up region: empirical model and the incident angle effect. Australas Phys Eng Sci Med. 1996;19:74–82. [PubMed] [Google Scholar]
- CAPOTE R. Phase-space database for external beam radiotherapy. 2012 http://www-nds.iaea.org/phsp/phsp.htmlx.
- CHEN FQ, GUPTA R, METCALFE P. Intensity modulated radiation therapy (IMRT) surface dose measurements using a PTW advanced Markus chamber. Australas Phys Eng Sci Med. 2010;33:23–34. doi: 10.1007/s13246-010-0004-x. [DOI] [PubMed] [Google Scholar]
- CHERENKOV PA. The spectrum of visible radiation produced by fast electrons. Comptes Rendus De L Academie Des Sciences De L Urss. 1938;20:651–655. [Google Scholar]
- CHIU-TSAO ST, CHAN MF. Photon beam dosimetry in the superficial buildup region using radiochromic EBT film stack. Medical Physics. 2009;36:2074–2083. doi: 10.1118/1.3125134. [DOI] [PMC free article] [PubMed] [Google Scholar]
- CHOW JC, GRIGOROV GN. Effect of electron beam obliquity on lateral buildup ratio: a Monte Carlo dosimetry evaluation. Phys Med Biol. 2007;52:3965–77. doi: 10.1088/0031-9155/52/13/020. [DOI] [PubMed] [Google Scholar]
- CHUNG H, JIN H, DEMPSEY JF, LIU C, PALTA J, SUH TS, KIM S. Evaluation of surface and build-up region dose for intensity-modulated radiation therapy in head and neck cancer. Med Phys. 2005;32:2682–9. doi: 10.1118/1.1992067. [DOI] [PubMed] [Google Scholar]
- COURT LE, TISHLER R, XIANG H, ALLEN AM, MAKRIGIORGOS M, CHIN L. Experimental evaluation of the accuracy of skin dose calculation for a commercial treatment planning system. J Appl Clin Med Phys. 2008;9:2792. doi: 10.1120/jacmp.v9i1.2792. [DOI] [PMC free article] [PubMed] [Google Scholar]
- COURT LE, TISHLER RB. Experimental evaluation of the impact of different head and-neck intensity-modulated radiation therapy planning techniques on doses to the skin and shallow targets. International Journal of Radiation Oncology Biology Physics. 2007;69:607–613. doi: 10.1016/j.ijrobp.2007.03.004. [DOI] [PubMed] [Google Scholar]
- DEVIC S, SEUNTJENS J, ABDEL-RAHMAN W, EVANS M, OLIVARES M, PODGORSAK EB, VUONG T, SOARES CG. Accurate skin dose measurements using radiochromic film in clinical applications. Med Phys. 2006;33:1116–24. doi: 10.1118/1.2179169. [DOI] [PubMed] [Google Scholar]
- DOGAN N, GLASGOW GP. Surface and build-up region dosimetry for obliquely incident intensity modulated radiotherapy 6 MV x rays. Med Phys. 2003;30:3091–6. doi: 10.1118/1.1625116. [DOI] [PubMed] [Google Scholar]
- FRAASS B, DOPPKE K, HUNT M, KUTCHER G, STARKSCHALL G, STERN R, VAN DYKE J. American Association of Physicists in Medicine Radiation Therapy Committee Task Group 53: quality assurance for clinical radiotherapy treatment planning. Med Phys. 1998;25:1773–829. doi: 10.1118/1.598373. [DOI] [PubMed] [Google Scholar]
- GENG J. Structured-light 3D surface imaging: a tutorial. Adv Opt Photon. 2011;3:128–160. [Google Scholar]
- GERBI BJ, MEIGOONI AS, KHAN FM. Dose buildup for obliquely incident photon beams. Med Phys. 1987;14:393–9. doi: 10.1118/1.596055. [DOI] [PubMed] [Google Scholar]
- GLADSTONE DJ, CHIN LM. Real-time, in vivo measurement of radiation dose during radioimmunotherapy in mice using a miniature MOSFET dosimeter probe. Radiat Res. 1995;141:330–5. [PubMed] [Google Scholar]
- GLADSTONE DJ, LU XQ, HUMM JL, BOWMAN HF, CHIN LM. A miniature MOSFET radiation dosimeter probe. Med Phys. 1994;21:1721–8. doi: 10.1118/1.597214. [DOI] [PubMed] [Google Scholar]
- GLASER AK, DAVIS SC, MCCLATCHY DM, ZHANG RX, POGUE BW, GLADSTONE DJ. Projection imaging of photon beams by the Čerenkov effect. Medical Physics. 2013a:40. doi: 10.1118/1.4770286. [DOI] [PMC free article] [PubMed] [Google Scholar]
- GLASER AK, KANICK SC, ZHANG R, ARCE P, POGUE BW. A GAMOS plug-in for GEANT4 based Monte Carlo simulation of radiation-induced light transport in biological media. Biomedical Optics Express. 2013b;4:741–759. doi: 10.1364/BOE.4.000741. [DOI] [PMC free article] [PubMed] [Google Scholar]
- GLASER AK, ZHANG R, DAVIS SC, GLADSTONE DJ, POGUE BW. Time-gated Cherenkov emission spectroscopy from linear accelerator irradiation of tissue phantoms. Opt Lett. 2012;37:1193–5. doi: 10.1364/OL.37.001193. [DOI] [PMC free article] [PubMed] [Google Scholar]
- HIGGINS PD, HAN EY, YUAN JL, HUI S, LEE CK. Evaluation of surface and superficial dose for head and neck treatments using conventional or intensity-modulated techniques. Physics in Medicine and Biology. 2007a;52:1135–1146. doi: 10.1088/0031-9155/52/4/018. [DOI] [PubMed] [Google Scholar]
- HIGGINS PD, HAN EY, YUAN JL, HUI S, LEE CK. Evaluation of surface and superficial dose for head and neck treatments using conventional or intensity-modulated techniques. Phys Med Biol. 2007b;52:1135–46. doi: 10.1088/0031-9155/52/4/018. [DOI] [PubMed] [Google Scholar]
- HONG L, HUNT M, CHUI C, FORSTER K, LEE H, LUTZ W, YAHALOM J, KUTCHER GJ, MCCORMICK B. Intensity modulated tangential beam irradiation of the intact breast. International Journal of Radiation Oncology Biology Physics. 1997;39:187–187. doi: 10.1016/s0360-3016(99)00132-7. [DOI] [PubMed] [Google Scholar]
- HONG L, HUNT M, CHUI C, SPIROU S, FORSTER K, LEE H, YAHALOM J, KUTCHER GJ, MCCORMICK B. Intensity-modulated tangential beam irradiation of the intact breast. International Journal of Radiation Oncology Biology Physics. 1999;44:1155–1164. doi: 10.1016/s0360-3016(99)00132-7. [DOI] [PubMed] [Google Scholar]
- JAMEMA SV, UPRETI RR, SHARMA S, DESHPANDE DD. Commissioning and Comprehensive Quality Assurance of commercial 3D Treatment Planning System using IAEA Technical Report Series—430. Australasian Physics & Engineering Sciences in Medicine. 2008;31:207–215. doi: 10.1007/BF03179346. [DOI] [PubMed] [Google Scholar]
- JELLEY JV. Čerenkov Radiation and Its Applications. British Journal of Applied Physics. 1955;6:227–232. [Google Scholar]
- KLEIN EE, ESTHAPPAN J, LI Z. Surface and buildup dose characteristics for 6, 10, and 18 MV photons from an Elekta Precise linear accelerator. J Appl Clin Med Phys. 2003;4:1–7. doi: 10.1120/jacmp.v4i1.2537. [DOI] [PMC free article] [PubMed] [Google Scholar]
- KRON T, BUTSON M, HUNT F, DENHAM J. TLD extrapolation for skin dose determination in vivo. Radiother Oncol. 1996;41:119–23. doi: 10.1016/s0167-8140(96)01795-1. [DOI] [PubMed] [Google Scholar]
- KRON T, ELLIOT A, WONG T, SHOWELL G, CLUBB B, METCALFE P. X-ray surface dose measurements using TLD extrapolation. Med Phys. 1993;20:703–11. doi: 10.1118/1.597019. [DOI] [PubMed] [Google Scholar]
- LAMBERT JH. Photometria: sive de mensvra et gradibvs lvminis, colorvm et vmbrae. 1760. [Google Scholar]
- LEE JA, GEETS X, GREGOIRE V, BOL A. Edge-preserving filtering of images with low photon counts. IEEE Trans Pattern Anal Mach Intell. 2008;30:1014–27. doi: 10.1109/TPAMI.2008.16. [DOI] [PubMed] [Google Scholar]
- LI JS, FREEDMAN GM, PRICE R, WANG L, ANDERSON P, CHEN L, XIONG W, YANG J, POLLACK A, MA CM. Clinical implementation of intensity-modulated tangential beam irradiation for breast cancer. Medical Physics. 2004;31:1023–1031. doi: 10.1118/1.1690195. [DOI] [PubMed] [Google Scholar]
- LIN JP, CHU TC, LIN SY, LIU MT. Skin dose measurement by using ultra-thin TLDs. Appl Radiat Isot. 2001;55:383–91. doi: 10.1016/s0969-8043(01)00082-3. [DOI] [PubMed] [Google Scholar]
- LING CC, BIGGS PJ. Improving the buildup and depth-dose characteristics of high energy photon beams by using electron filters. Med Phys. 1979;6:296–301. doi: 10.1118/1.594585. [DOI] [PubMed] [Google Scholar]
- MEGLINSKI IV, MATCHER SJ. Quantitative assessment of skin layers absorption and skin reflectance spectra simulation in the visible and near-infrared spectral regions. Physiological Measurement. 2002;23:741–753. doi: 10.1088/0967-3334/23/4/312. [DOI] [PubMed] [Google Scholar]
- NAKANO M, HILL RF, WHITAKER M, KIM JH, KUNCIC Z. A study of surface dosimetry for breast cancer radiotherapy treatments using Gafchromic EBT2 film. J Appl Clin Med Phys. 2012;13:3727. doi: 10.1120/jacmp.v13i3.3727. [DOI] [PMC free article] [PubMed] [Google Scholar]
- NILSSON B, SORCINI B. Surface dose measurements in clinical photon beams. Acta Oncol. 1989;28:537–42. doi: 10.3109/02841868909092265. [DOI] [PubMed] [Google Scholar]
- QI ZY, DENG XW, HUANG SM, ZHANG L, HE ZC, LI XA, KWAN I, LERCH M, CUTAJAR D, METCALFE P, ROSENFELD A. In vivo verification of superficial dose for head and neck treatments using intensity-modulated techniques. Med Phys. 2009;36:59–70. doi: 10.1118/1.3030951. [DOI] [PubMed] [Google Scholar]
- QUACH KY, MORALES J, BUTSON MJ, ROSENFELD AB, METCALFE PE. Measurement of radiotherapy x-ray skin dose on a chest wall phantom. Med Phys. 2000;27:1676–80. doi: 10.1118/1.599035. [DOI] [PubMed] [Google Scholar]
- ROBERSON PL, MORAN JM, KULASEKERE R. Radiographic film dosimetry for IMRT fields in the nearsurface buildup region. J Appl Clin Med Phys. 2008;9:2782. doi: 10.1120/jacmp.v9i4.2782. [DOI] [PMC free article] [PubMed] [Google Scholar]
- SAW CB, PAWLICKI T, KORB LJ, WU A. Effects of extended SSD on electron-beam depth-dose curves. Med Dosim. 1994;19:77–81. doi: 10.1016/0958-3947(94)90075-2. [DOI] [PubMed] [Google Scholar]
- SHIAU AC, CHIU MC, CHEN TH, CHIOU JF, SHUENG PW, CHEN SW, CHEN WL, KUAN WP. Surface and superficial dose dosimetric verification for postmastectomy radiotherapy. Med Dosim. 2012 doi: 10.1016/j.meddos.2012.03.005. [DOI] [PubMed] [Google Scholar]
- SPEZI E, LEWIS DG, SMITH CW. Monte Carlo simulation and dosimetric verification of radiotherapy beam modifiers. Phys Med Biol. 2001;46:3007–29. doi: 10.1088/0031-9155/46/11/316. [DOI] [PubMed] [Google Scholar]
- TEYMURAZYAN A, PANG G. Megavoltage X-Ray Imaging Detector Based on Čerenkov Effect. Medical Physics. 2012;39:4644–4644. doi: 10.1118/1.4740205. [DOI] [PubMed] [Google Scholar]
- VAN DYK J. Quality assurance of radiation therapy planning systems: Current status and remaining challenges. International Journal of Radiation Oncology Biology Physics. 2008;71:S23–S27. doi: 10.1016/j.ijrobp.2007.04.095. [DOI] [PubMed] [Google Scholar]
- VATANEN T, TRANEUS E, LAHTINEN T. Enhancement of electron-beam surface dose with an electron multi-leaf collimator (eMLC): a feasibility study. Phys Med Biol. 2009a;54:2407–19. doi: 10.1088/0031-9155/54/8/010. [DOI] [PubMed] [Google Scholar]
- VATANEN T, TRANEUS E, VAANANEN A, LAHTINEN T. The effect of electron collimator leaf shape on the build-up dose in narrow electron MLC fields. Phys Med Biol. 2009b;54:7211–26. doi: 10.1088/0031-9155/54/23/012. [DOI] [PubMed] [Google Scholar]
- VISHWANATH K, CHANG K, KLEIN D, DENG YF, CHANG V, PHELPS JE, RAMANUJAM N. Portable, Fiber-Based, Diffuse Reflection Spectroscopy (DRS) Systems for Estimating Tissue Optical Properties. Appl Spectrosc. 2011;62:206–215. doi: 10.1366/10-06052. [DOI] [PMC free article] [PubMed] [Google Scholar]
- WANG Y, KHAN MK, TING JY, EASTERLING SB. Surface dose investigation of the flattening filter-free photon beams. Int J Radiat Oncol Biol Phys. 2012;83:e281–5. doi: 10.1016/j.ijrobp.2011.12.064. [DOI] [PubMed] [Google Scholar]
- XIANG HF, SONG JS, CHIN DWH, CORMACK RA, TISHLER RB, MAKRIGIORGOS GM, COURT LE, CHIN LM. Build-up and surface dose measurements on phantoms using micro-MOSFET in 6 and 10 MV x-ray beams and comparisons with Monte Carlo calculations. Med Phys. 2007;34:1266–1273. doi: 10.1118/1.2710951. [DOI] [PubMed] [Google Scholar]
- YADAV G, YADAV RS, KUMAR A. Skin dose estimation for various beam modifiers and source-to-surface distances for 6MV photons. J Med Phys. 2009;34:87–92. doi: 10.4103/0971-6203.51935. [DOI] [PMC free article] [PubMed] [Google Scholar]
- ZHANG R, GLASER A, ESIPOVA TV, KANICK SC, DAVIS SC, VINOGRADOV S, GLADSTONE D, POGUE BW. Čerenkov radiation emission and excited luminescence (CREL) sensitivity during external beam radiation therapy: Monte Carlo and tissue oxygenation phantom studies. Biomed Opt Express. 2012;3:2381–94. doi: 10.1364/BOE.3.002381. [DOI] [PMC free article] [PubMed] [Google Scholar]


