

Abstract
Proteins fluctuate between alternative conformations, which presents a challenge for ligand discovery because such flexibility is difficult to treat computationally owing to problems with conformational sampling and energy weighting. Here, we describe a flexible-docking method that samples and weights protein conformations using experimentally-derived conformations as a guide. The crystallographically refined occupancies of these conformations, which are observable in an apo receptor structure, define energy penalties for docking. In a large prospective library screen, we identified new ligands that target specific receptor conformations of a cavity in Cytochrome c Peroxidase, and we confirm both ligand pose and associated receptor conformation predictions by crystallography. The inclusion of receptor flexibility led to ligands with new chemotypes and physical properties. By exploiting experimental measures of loop and side chain flexibility, this method can be extended to the discovery of new ligands for hundreds of targets in the Protein Data Bank where similar experimental information is available.
In their native states, proteins fluctuate among multiple conformations, and recent evidence from NMR1,2 and crystallography3–7 suggests apo proteins may transiently populate the conformations adopted in ligand complexes. It is tempting to wonder whether these conformations may be used prospectively to address two longstanding problems in exploiting protein flexibility in ligand discovery8: sampling protein states and weighting these states relative to one another9,10.
Sampling protein conformations for ligand discovery is challenging because of the many degrees of freedom available to folded proteins. Conformational changes often involve not only rotamer transitions but also coordinated loop and main chain movements. The different internal energies of these conformations affect ligand binding affinity, and if unaccounted for, high-energy decoy conformations may dominate the docking.
Two strategies have been introduced to model protein flexibility in docking screens for new ligands. “Soft docking”11 reduces the steric component of the scoring function, and can identify ligands that might be accommodated by certain protein rearrangements. This, however, can increase docking false positives9. A related method averages several structures to represent multiple conformations12. This also reduces the number of states, but suffers from an unphysical averaging of energies, reducing predictive success12.
A second strategy explicitly represents, and docks into, multiple receptor conformations13–16. These conformations may be sampled in different ligand complexes12,17–21, or calculated using molecular dynamics (MD)22–26, elastic network models, and related techniques27. Whereas the restriction to experimentally-determined conformations ensures accessible states, it limits their number and remains biased to known structures. Calculating alternative conformations from simulations escapes from such biases but struggles to access states separated by higher energy barriers. Neither approach easily assigns energy penalties to the different conformations, and several studies have found that using too many conformations in flexible docking can reduce the enrichment of known ligands over decoy molecules9,28–32.
Recent advances in crystallographic refinement offer the opportunity to model higher-energy conformational states using direct experimental observations3–5,33–35. Such alternate conformations can be discovered in weak electron density features and reliably modeled at lower occupancies than the dominant conformation3,34,35. A liability of this approach is its inability to confidently identify conformations present at less than ~10% of the ground state, or no more than about 2 kcal/mol higher in energy at room temperature. It can represent coordinated transitions as easily as changes in side-chain rotamers, and the relative conformational energies emerge directly from crystallographic occupancies.
Here we explore the use of multiple conformations present in the electron density map of an apo cavity site in Cytochrome c Peroxidase (CcP)36–39 in docking screens. The substitution Trp191→Gly in CcP creates an enclosed, anionic cavity of about 200 Å3, which has been studied as a model site for ligand binding. In the variant studied here, residues 192–3 have been deleted, and the substitution Pro190→Gly introduced, increasing the flexibility of the cavity’s gating loop. In the room temperature structure that we determine to 1.57 Å resolution, one loop and three side chains of this “gateless” cavity occupy multiple states in the electron density., We docked 583,363 compounds against 16 energy-weighted conformations of the cavity. To limit the calculation cost, we modified the treatment of ligand-protein electrostatic interaction energies, decomposing them into an additive function40. This allowed us to sample 16 receptor states with only a 2.4 fold speed cost compared to a single structure. From the flexible docking screen, 15 new compounds were chosen to test, and ten of these were confirmed to bind. The crystal structures of nine of them were determined, allowing us to compare predicted and observed ligand poses and loop structures. Potentials for broad application of this method are considered.
RESULTS
From crystallographic occupancies to Boltzmann-weighted energy penalties
Our first goal was to convert crystallographic occupancies for the flexible 186–194 loop into Boltzmann-weighted energy penalties for docking (Figure 1 and Suppl. Figure 2). This loop adopts three conformations in previously determined ligand-bound structures39. These three states, which we designate as A, B, and C, were combined into a multi-conformer loop model. Occupancy refinement of these conformations, using the apo structure electron density, improved the agreement between model and the experimental data as judged by Rfree values ranging from 0.1639 to 0.1695 (Suppl. Table 2) and qualitatively fit the density (Figure 1C).
Figure 1. Experimental occupancies of Apo loop conformations set penalties for docking.

(a) From experimental loop occupancies to docking penalties.
Flexible loop (in colors) and side-chain conformations of the Apo CcP Gateless protein are assigned Boltzmann-weighted energy penalties based on their crystallographic occupancy; kB – Boltzmann constant, T – temperature in K, occ. – occupancy, m – flexible weighting multiplier (here m = 2).
(b) From docking energies to loop propensities.
The Boltzmann sum of the energies of all x poses for a ligand to different loops A, B, C are calculated. The result is expressed as a percentage, indicating the predicted preference of the ligand to bind to a particular loop conformation, that can be compared to the experimental occupancies.
(c) Electron density shows evidence for 3 conformations of the apo loop.
Electron density showing missing conformation of loops A (purple sticks) and B (grey lines) when only loop C (orange sticks) is included in the refinement is shown as blue (2mFo-DFc, 1sigma) and cyan (Fo-Fc, +1.5sigma). Stick radius according to relative occupancies (cf. Figure 2A). See Suppl. Figure 13 for more pronounced difference cyan density for loop B when including A in addition to C in refinement.
We used the refined apo occupancies of each loop conformation to assign energy penalties to each conformation (cf. Figure 1) using equation 1:
| (equation 1) |
with kB = Boltzmann constant, T = temperature in K, occ = occupancy, m = flexible weighting multiplier (below). Note that the occupancy of loop B dropped below 10% (Figure 1), which we consider the imprecision of the refinement approach. Although refinement parameters can affect the occupancy, our procedure converged to 4% after 10 refinement cycles, remained stable thereafter (Suppl. Figure 2), and could be reproduced from another dataset (Suppl. Figure 3). Also the loop can move freely and is unobstructed by crystal contacts (Suppl. Figure 11). We will address the robustness and dependence of the results on the exact numerical occupancy value in supplementary information.
Retrospective testing and integration of conformational weights and docking scores
To test the usefulness of these energy penalties, we retrospectively docked five known cavity ligands with the new scoring function (compounds 1–5; structures in table 1) and recovered experimental poses for three of them with an average RMSD of 0.4 Å (Suppl. Figure 4).
Table 1.
CcP ligands: previously discovered (1 to 5) and found by flexible docking (6 to 20).
| Rank | ZINC | # | Compound | Ligand RMSD (Å)1 | Loop State3 Xtal/DOCK PCC4) |
Affinity (µM)/ Ligand Efficiency (kcal/mol/hac)) |
Max Tc to known ligands2 |
Closest known ligand2 |
Closest known affinity* (µM) |
|---|---|---|---|---|---|---|---|---|---|
| n.a. | 01583444 | 1 | 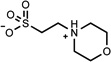 |
n.a. | C (n.a.) | n.d. | 1 | is known | n.a |
| n.a. | 00331902 | 2 |  |
n.a. | A (n.a.) | 33* (0.68) | 1 | is known | n.a |
| n.a. | 00331945 | 3 |  |
n.a. | AB(n.a.) | 3* (0.69) | 1 | is known | n.a |
| n.a. | 00036634 | 4 |  |
n.a. | A (n.a.) | 9* (0.77) | 1 | is known | n.a |
| n.a. | 08652421 | 5 | n.a. | B (n.a.) | 106* (0.78) | 1 | is known | n.a | |
| 8 | 06656163 | 6 | 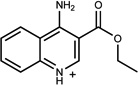 |
0.88 | C/B (−0.78) | 71 ±10 (0.35) | 0.48 | 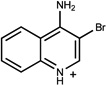 |
1937 |
| 38 | 04962659 | 7 | 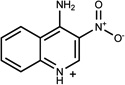 |
0.48 | B/B (0.85) | 8* 37 (0.35) | 1 | was known* 37 | 837 |
| 70 | 00331160 | 8 |  |
0.48 | B/B (1.00) | 19* 37(0.54) | 1 | was known* 37 | 1937 |
| 163 | 13739037 | 9 | 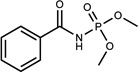 |
0.98 | C/C (0.88) | n.b.d. <4mM | 0.29 | 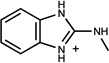 |
28837 |
| 322 | 01596053 | 10 | 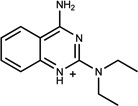 |
0.79 | AC/A (0.41) | 22±10 (0.4) | 0.53 | 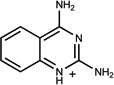 |
4139 |
| 330 | 34979991 | 11 | 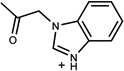 |
1.19 | A/A (0.99) | 46±8 (0.46) | 0.28 |  |
3339 |
| 433 | 00203341 | 12 | 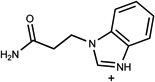 |
1.49 | A/A (0.62) | 28±7 (0.44) | 0.30 | 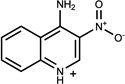 |
837 |
| 526 | 00519712 | 13 | 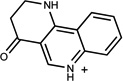 |
0.54 | AC/A (0.61) | 7±0.6 (0.47) | 0.36 | 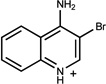 |
1937 |
| 556 | 00388812 | 14 | 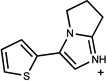 |
0.55 | BC/C (0.49) | 23±4 (0.49) | 0.23 | 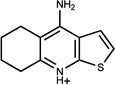 |
6437 |
| 67 | 70974074 | 15 |  |
n.a. | /C | n.r. | 0.27 | 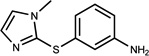 |
20337 |
| 84 | 16210033 | 16 | 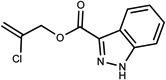 |
n.a. | /C | n.b.d. | 0.31 |  |
3339 |
| 263 | 19702757 | 17 | 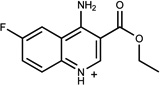 |
n.a. | /B | n.d. | 0.35 |  |
1937 |
| 355 | 12546268 | 18 |  |
n.a. | /A | 396±42 (0.42) | 0.37 |  |
1437 |
| 401 | 16207704 | 19 | 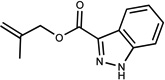 |
n.a. | /C | n.b.d. | 0.31 |  |
3339 |
| 487 | 01648614 | 20 |  |
n.a. | /A | n.r. | 0.20 |  |
1937 |
n.b.d. = no binding detectable (due to precipitation >500uM if not specified otherwise)
n.d. = not determined (insufficient solubility)
n.r. = not reproducible in repetitive runs
n.a. = not applicable.
= determined previously; references in parenthesis.
= Ligand Heavy Atom Root Mean Square Deviation between docked pose and crystal pose
= Extended Connectivity Fingerprints (ECFP4), Ligand with this Tanimoto shown at right
= Dominant Loop state listed unless two states within 10% of maximum then both listed. PCC is Pearson
= Pearson Correlation Coefficient of loop occupancies versus predicted loop propensities from docking.
A more stringent test compares not only the docked and observed ligand poses, but also the predicted and observed ensemble of protein conformations associated with each pose. If the energy-weighting of the apo loop conformations is correct, we can combine them with docking scores to predict the distribution of conformations favored for each ligand complex. Predicted loop propensities (analogous to experimental occupancies) were calculated, using equation 2, as the Boltzmann sum of the energy of all ligand poses bound to a specific loop conformation X = (A, B, or C) over the Boltzmann sum of the energy of all the poses generated to any loop (Suppl. Methods and Suppl. Table 4):
| (equation 2) |
Docking energies are computed by DOCK3.741 according to equation 3, which integrates the receptor energy penalties from equation 1.
| (equation 3) |
Here, the energy penalty is from eq. 1, Vdw(z) is the van der Waals energy of each ligand atom42, Elstat(z) is the corresponding electrostatics energy 43, and Ligand Desol(z) the ligand desolvation energy. The resulting propensities are expressed as a percentage, with all propensities for a ligand summing to 100% (Figure 1B).
With the predicted loop occupancies for the holo complexes calculated from the apo state docking and loop propensities, we refined the observed loop occupancies against five ligand complex datasets, determined to between 1.2 and 1.7 Å (Suppl. Table 1). This yields a distribution of loop conformations for complex (Suppl. Figure 5). Overall, conformation-weighted docking correctly predicted the dominant loop state for all 5 ligands (Suppl. Figure 5), with an overall Pearson Correlation Coefficient (PCC) of 0.77 (for 3 loop states for all 5 ligands) (Suppl. Figure 6).
In calculating the propensity of the loop conformation for the individual ligand complexes, we add the ligand docking energy score to the occupancy-based loop energies (eqn. 3). Since these loop energies will rarely be on the same scale as the docking score, the combination of the two terms can be optimized. We investigated weighting the conformation energies (m in eq. 1). To reduce the dangers of overfitting, we retrospectively established a single variable weighting term (m) of 2 – performance was judged by increase in statistical significance over other integers (Figure 2, Suppl. Figure 5, 6A and Suppl. Methods).
Figure 2. Predicting loop occupancies in holo-complexes.

(A) Experimental occupancies of three flexible loop (186–194) conformations A, B and C are depicted as a percentage (Xtal). These can then easily be compared to their predicted docking propensities (dock) for compounds 1–544. Using Boltzmann energy penalties and a multiplier m=2 results in close agreement of the major loop conformation between prediction (dock) and experiment (Xtal), with a Pearson Correlation Coefficient (PCC) of 0.83, and a p-value < 0.01. Error bars for docking propensities are derived by using any flexible weighting multiplier m between 1.0 and 3.0 and taking the standard deviation.
(B) The difference electron density map of CcP and compound 5 around the backbone carbonyls (red mesh for main loop in grey sticks and green for the new loop conformation) provides evidence for the presence of a second loop conformation (purple) even at very low levels around 10%. Resolution is 1.2 Å; 2mFo-DFc map rendered at 1σ and mFo-DFc map at 2.6σ.
Since experimental occupancies can be imprecise and co-vary with B-factors, we investigated how results depended on refined loop occupancies (SI Methods). The effect on the retrospective propensities was minor and correlations between the predictions and experiments remained significant (Suppl. Figures 6C and 10B). This gives confidence that the energy penalization is not overly sensitive to the input occupancy of low-occupancy states like loop B, which is comforting regarding the expected error in the determination and refinement of experimental occupancies.
Prospective docking for new ligands complementing the different receptor conformations
Fortified by these results, we used this energy-penalized ensemble of flexible states for prospective docking of 583,363 fragments from the ZINC database44. From the top 0.1% of the highest-ranking molecules, 15 were chosen for experimental testing (Compounds 6–20; table 1). As is common in selecting docked molecules to experimentally test from docking hit list45,46, we eliminated compounds that had problems with protonation or tautomerization states, and selected several molecules for chemical novelty, including some uncharged molecules. We particularly sought molecules predicted to bind to different protein receptor conformations.
On testing, 9 of the 15 compounds had Kd values between 7 and 400 uM as measured by heme Soret band shift (Table 1). The ligand efficiencies were between 0.35 and 0.54 kcal/mol/(heavy atom count). For 8 of these 9 molecules we determined X-ray crystal structures, and we also determined a structure for a tenth molecule for which we had been unable to determine an affinity. Those nine ligand crystal structures recapitulated the predicted docked ligand poses (Figure 3), with a mean RMSD of 0.82 Å (Table 1). Counting ligand binding by affinity and by crystallography, the total hit rate was 67% (10/15). The new hits differed from previously known ligands: the highest pairwise topological similarity to these, using ECFP4-based Tanimoto47 coefficients, was 0.36 (Suppl. Table 9), and new ligands were on average 52 Da heavier (from 148 to 200 Da) than the previously known ligands, and also larger than those discovered in an earlier, rigid-body docking study37. A role of human selection of compounds, in both the previous docking studies and in this one, cannot be entirely controlled for.
Figure 3. Experimental binding poses vs. prospective docking predictions.

Electron density at 1sigma shown for ligand and loop conformations. Loop stick thickness corresponds to experimentally observed occupancies; coloring as before with loop conformation A in purple, B in grey, C in orange and D (for compound 10) in blue.
Superposition of ligand poses with experimental in grey versus docked in green.
(a) compound 6, (b) 7, (c) 8, (d) 9, (e) 10, (f) 11, (g) 12, (h) 13, (i) 14.
For clarity, co-crystallized MES for compounds 6 (a), 9 (d) and 12 (g) has been omitted.
Upon writing this manuscript we discovered that two of the 15 molecules (7, 8) had independently been found in work that was then unpublished37; we do not count these as novel molecules. They do, nevertheless, illustrate a strength of the method. Of all of the new ligands, 7 and 8 most closely resemble the earlier series of cavity ligands, and indeed were predicted and observed to prefer the B loop conformation, which has been previously targeted in the older, rigid docking method.
Ligands select the predicted protein loop and side-chain conformations
A crucial point is the ability of the method to anticipate the protein conformational response to the new ligands. In seven of nine new holo-structures, the predicted loop occupancies and conformations corresponded qualitatively to the observed ones, with at least the dominant loop being correctly predicted, and frequently the approximate ratios of the ensemble (Figures 3 and 4). For instance, compound 7 was experimentally observed to bind to loop B at 79% (with 20% occupancy of loop A), and was predicted to prefer loop B at 95% with a 5% loop A contribution. For compound 8 the prediction of loop conformations A and B, at 33% and 67%, agrees quantitatively with the observed holo occupancies, at 38% and 62%, respectively. The experimental occupancy of the C loop in the complex with compound 9 was 68% instead of 100% as predicted. Compound 11 bound primarily to loop A with an occupancy of 84% and the remaining occupancy was split between the additional loops; the prediction was 89% for loop A which corresponds to a PCC of 0.99. Compound 13 was among the few compounds predicted to bind to one loop conformation exclusively, the A loop. Whereas automatic occupancy refinement suggests a presence of loop C, this may be misled by nearby water molecules, as visual inspection of the electron density seems consistent with only the single A loop being present (Figure 3). Compound 14 was chosen to bind to an ensemble of loop conformations: 29% loop A, 11% loop B and 60% loop C. The refined experimental occupancy values were consistent with those predictions, with 27% loop A, 30% loop B and 43% loop C, corresponding to a PCC of 0.84. For ligand 10, a fourth loop conformation was found that had not been previously modeled. To check for this conformation, D, in the apo structure, it was included as a fourth loop in the original model and refined as before, but could not be observed at any reliable level; this represents a false negative of our method (also see Suppl. Figure 1 and Suppl. Table 7). Meanwhile, the prediction of side-chain conformations conformed to those observed crystallographically with only two failures out of the total 27 modeled conformations (Suppl. Methods and Suppl. Figure 7). Finally, we note that for several complexes, the presence of MES, itself is a weak ligand, prevented full analysis of the results (Suppl. Table 8).
Overcoming the bias of known structures: The correct model does not necessarily result in the best retrospective enrichment
It is important to understand whether flexible receptor docking improved results over standard rigid docking. We first investigated the ranks of the new ligands against both our fully flexible model and any individual loop model. No single model would have ranked all these ligands in the top 0.1% of the database as the flexible docking did (Suppl. Table 5). Had we docked prospectively against all conformations, and combined the top-ranking ligands, the hits against the high-energy, low occupancy B conformation would have dominated, as in previous screens37,39, and the calculation would have taken seven-fold longer.
This bias emerges even more strongly in retrospective screens of all previously known ligands. Such retrospective enrichment is widely-used to judge docking performance and to select receptor structures for prospective docking. On that basis we would have selected the B loop that dominated enrichment plots and discarded the other conformers (Figure 5A, Suppl. Table 6). Choosing the best enriching structure in retrospective studies for prospective screens seems intuitive but is biased by the binding of most known ligands to the B loop; they were in fact discovered by docking to that loop conformation. Compared to ligands that we ourselves had discovered against the single B-loop conformation, the new ligands that bind to the C and A loop conformations are more diverse and are larger (Suppl. Table 9); they would not have been discovered using the highest enriching model alone (Suppl. Table 4), or if so, for the wrong reasons (Figure 5B and Suppl. Figure 8).
Figure 5. Enrichment alone cannot distinguish first-in-class from best-in-class.

(a) Retrospective enrichment of known ligands against decoys (adjusted logAUC) for loops A, B, and C individually (colored as purple, grey and orange) and combined with different multipliers (tones of green). Adjusted area under the log ROC plot is shown in the legend (cf. Suppl. Table 6 for other common performance metrics).
(b) Pearson correlation of experimental and predicted loop occupancies with statistically significant areas highlighted in green (dark green for p-values < 0.05; light green for p < 0.01). Pearson All is for all 9 compounds, Pearson 6 is the correlation only considering compounds 7, 8, 9, 11, 13 and 14, where results are not distorted by a partial presence of MES.
It is appropriate to ask whether this method – dependent as it is on experimental density features – can be used on bio-relevant targets. Examining the protein data bank PDB,48 for projects that our flexible docking method could be applied to we found 827 unique proteins, with electron density maps, determined to <1.5 Å resolution, a level substantially more conservative than the 2 Å we estimate required for confident occupancy fitting (Suppl. Methods and Suppl. Figure 12). Though only 51 of these were determined at room temperatures, as the apo cavity structure was, analysis of an apo cavity structure determined at cryo temperatures suggests that much of the flexibility exploited here remains even at these lower temperatures, though there were also important differences (described more fully in the Supporting Information). Though room temperature structures will more fully explore conformational heterogeneity present in protein structures4, even cryo structures are likely to have enough conformations to support this analysis.
Discussion
Three principal observations emerge from this study. First, partial occupancy conformations, apparent in electron density from room temperature crystal structures, enable the modeling of alternative protein conformations in molecular docking. These features not only illuminate conformations accessible to ligands, but their occupancies provide energy weights for the docking scoring function, preventing domination by higher energy conformations. Multiple conformations may be represented with only modest impact on the docking calculation time. Second, exploitation of these conformations enables prospective prediction of ligands with new chemotypes and new physical properties, with close correspondence between the predicted ligand poses and protein loop conformations and those subsequently determined by X-ray crystallography. Finally, there are over 800 unique proteins in the PDB, each with requisite density maps, to which this method could be applied today (see Supplementary Data: possible protein targets).
We were surprised at the high correspondence between the loop propensities and ligand geometries from predictions and those in the X-ray structures of the new complexes. With the exception of the complex with compound 6, the observed loops and residue conformations matched well to those predicted, as judged by their relative occupancies and the correct prediction of the major loop conformation (Figures 2 and 4). For 6 of the 9 structures, the occupancies not only qualitatively corresponded but did so quantitatively as well, with PCCs greater than 0.6 (compounds 7–9, 11–13). This suggests that experimental conformational energy weights and docking scores may be in at least qualitative balance, and may be pragmatically combined. Indeed, the method predicts loop occupancies 30% better than a naïve method which presumes all states to be equi-energetic (Figure 5B). To check whether loop propensity prediction could have been achieved using only ligand similarity, we compared the topological similarity of the 14 known ligands to the correlation of their loop occupancies. Many topologically dissimilar ligands bound to the same major loop conformations (Suppl. Figure 9), suggesting an advantage of structure-based over similarity-based methods alone.
Figure 4. Predicting loop occupancies in bound complexes.

The loop occupancies and predicted propensities for compounds 6–14 are shown, with crystallographic occupancies at left and predicted loop propensities (with m = 2) at right in each pair. Error bars for the loop propensity represent the standard deviation of the occupancies by varying the flexible weighting multiplier m from 1 to 3. The major loop conformation is predicted correctly for all cases but compound 10 that prefers a fourth loop, D, conformation that was not modeled; compounds 6 and 12 have a larger C loop presence due to the partial presence of MES.
Certain caveats merit mentioning. Only a narrow range of conformations above the ground state can be reliably observed in this method. Even here, the D conformation of the 186–194 loop, observed in the complexes of ligand 10, was unanticipated because it was not observed in the apo structure. Whereas the conformational occupancies and the docking propensities were overall in balance, there is no fundamental reason why they should be in balance, or that the weighting found here should extend to other systems. The weights assigned based on the occupancies may be converted into energies, but the docking scores, even when physics-based, leave out important terms and make substantial approximations. As docking scoring functions develop to better model physical forces, these terms should more reliably come into the balance than we, perhaps fortuitously, found here.
Conclusions
Notwithstanding the caveats discussed above, this method had important successes. Partial occupancy modeling enabled the representation of alternative, energy-weighted protein conformations that could be integrated with molecular docking scores. This prevented domination by higher energy conformations in the docking, which might fit ligands better but at the cost of higher internal energies. Though the number of conformational states grows exponentially, the multi-conformer receptor potentials could be recombined in a way that led to only modest impact on the docking calculation time. Exploitation of the new conformations illuminated ligands with new chemotypes and new physical properties, and we observed a close correspondence between the predicted ligand poses and protein loop conformations with those subsequently determined by X-ray crystallography. There are well-over 800 unique proteins to which this method could be applied today.
Methods
The protein was purified and crystallized as described39 with the exception of apo protein that was crystallized in 100mM KPi, pH 6.0. A loop model was generated from three main loop conformations (residues 186–194) observed in holo complexes39 with compounds 4, 5 and Apo for loops A, B and C, respectively, and subjected to occupancy refinement (strategy=individual_adp+occupancies) within phenix.refine33 where 10 cycles were found to result in sufficient convergence of the loop occupancy (Suppl. Figure 2). Those models have been deposited at the PDB as 4NVA-4NVO (Suppl. Table 1). Experimental affinities were measured by fluorescence monitoring of the heme Soret band shift as before37,39
Flexible Receptor Preparation
DOCK 3.741 uses physics-based scoring consisting of van der Waals42 and ligand desolvation terms49, combined with interaction electrostatic using a probe-charge implementation of the Poisson-Boltzmann equation. The first two components of this score can be broken down atom independently, so the receptor can be separated into invariant and flexible parts, with separate scoring grids constructed and then used during docking. For Poisson Boltzmann (PB) electrostatics, the scoring cannot be deconstructed into separate protein components as easily. Here we use QNIFFT43,50 on separate but complete receptor conformations. To use these during docking, the PB map of each receptor conformation is compared to the PB of the most occupied receptor conformation, and the difference maps for the overall conformation is used in docking to construct the overall electrostatic score. This resulted in a much better approximation to the PB map of a single conformation (see SI methods). Given a structure with defined flexible regions and occupancies, docking preparation takes place automatically. Both the scripts to do so and the DOCK3.7 code itself are available without charge for academic research at http://dock.compbio.ucsf.edu/DOCK3.7/
Flexible Receptor Docking
Several changes were made to the DOCK 3.7 code to enable flexible docking. Each ligand pose is scored against each part of the receptor conformation (here, 2 residues with 2 positions each and 3 loops plus a loop with a residue moved, plus an invariant grid), 9 grids were scored for each ligand pose. The scores were assembled into the 2*2*(3+1)=16 possible cavity conformations and the top score for each was saved, as were the top 10 overall poses to any conformation to calculate receptor conformational propensities. Additional analyses were performed with an implementation of black-box re-weighting algorithm (BBRW)51 in place of equation 2 (Suppl. Table 3). The code for equation 2 and the BBRW algorithm is included in the DOCK 3.7 distribution (http://dock.compbio.ucsf.edu/DOCK3.7/). For the screen of the 583,363 ZINC44 fragments, flexible docking took 1516 core hours spread across 850 nodes, or less than 2 hours of wall time. Docking a single cavity conformation took 630 hours, only a 2.4-fold computation cost versus a 16-fold increase in conformations sampled.
Supplementary Material
Acknowledgements
We thank G. Rocklin for enlightening discussions, P. Afonine for advice and bug-fixing of occupancy refinement in phenix, A. Doak for protein preparation, and H. Lin, J. Karpiak and T. Balius for reading this manuscript. Supported by US NIH grants GM59957 (to BKS), DP5OD009180 (to JSF) and NRSA F32GM096544 (to RGC).
Footnotes
Accession Codes
Crystal structures are available having been deposited at the Protein Data Bank (Suppl. Table 1). The structures have the following primary accession codes; the numbers in parenthesis designate the ligand that is bound to CcP and ‘Apo_RT’ and ‘ Apo_cryo’ refer to apo forms of CcP at room temperature and cryogenic temperature. 4NVA (Apo_RT), 4NVB (5), 4NVC (4), 4NVD (3), 4NVE (2), 4NVF (1), 4NVG (6), 4NVH (7), 4NVI (8), 4NVJ (9), 4NVK (10), 4NVL (11), 4NVM (12), 4NVN (13), 4NVO (14) and 4OQ7 (Apo_cryo).
Author Contributions
M.F., R.G.C., J.S.F. and B.K.S. designed the study and wrote the paper; M.F. performed all experiments and refined structures with the assistance of J.S.F.; R.G.C. wrote the computer code and performed all computational work.
Competing financial interests
The authors declare no competing financial interests.
References
- 1.Baldwin AJ, Kay LE. NMR spectroscopy brings invisible protein states into focus. Nat Chem Biol. 2009;5:808–814. doi: 10.1038/nchembio.238. [DOI] [PubMed] [Google Scholar]
- 2.Koveal D, Clarkson MW, Wood TK, Page R, Peti W. Ligand Binding Reduces Conformational Flexibility in the Active Site of Tyrosine Phosphatase Related to Biofilm Formation A (TpbA) from Pseudomonas aeruginosa. Journal of Molecular Biology. 2013;425:2219–2231. doi: 10.1016/j.jmb.2013.03.023. [DOI] [PMC free article] [PubMed] [Google Scholar]
- 3.Burnley BT, Pavel VA, Paul DA, Piet G. Modelling dynamics in protein crystal structures by ensemble refinement. eLife Sciences. 2012;1 doi: 10.7554/eLife.00311. [DOI] [PMC free article] [PubMed] [Google Scholar]
- 4.Fraser JS, et al. Hidden alternative structures of proline isomerase essential for catalysis. Nature. 2009;462:669–673. doi: 10.1038/nature08615. [DOI] [PMC free article] [PubMed] [Google Scholar]
- 5.Fraser JS, et al. Accessing protein conformational ensembles using room-temperature X-ray crystallography. Proceedings of the National Academy of Sciences. 2011;108:16247–16252. doi: 10.1073/pnas.1111325108. [DOI] [PMC free article] [PubMed] [Google Scholar]
- 6.Frauenfelder H, Petsko GA, Tsernoglou D. Temperature-dependent X-ray diffraction as a probe of protein structural dynamics. Nature. 1979;280:558–563. doi: 10.1038/280558a0. [DOI] [PubMed] [Google Scholar]
- 7.Rauh D, Klebe G, Stubbs MT. Understanding Protein-Ligand Interactions: The Price of Protein Flexibility. Journal of Molecular Biology. 2004;335:1325–1341. doi: 10.1016/j.jmb.2003.11.041. [DOI] [PubMed] [Google Scholar]
- 8.Jorgensen WL. Rusting of the Lock and Key Model for Protein-Ligand Binding. Science. 1991;254:954–955. doi: 10.1126/science.1719636. [DOI] [PubMed] [Google Scholar]
- 9.Nicholls A. The character of molecular modeling. Journal of Computer-Aided Molecular Design. 2012;26:103–105. doi: 10.1007/s10822-011-9520-3. [DOI] [PubMed] [Google Scholar]
- 10.Barril X, Fradera X. Incorporating protein flexibility into docking and structure-based drug design. Expert Opinion on Drug Discovery. 2006;1:335–349. doi: 10.1517/17460441.1.4.335. [DOI] [PubMed] [Google Scholar]
- 11.Jiang F, Lin W, Rao Z. SOFTDOCK: understanding of molecular recognition through a systematic docking study. Protein Engineering. 2002;15:257–263. doi: 10.1093/protein/15.4.257. [DOI] [PubMed] [Google Scholar]
- 12.Cosconati S, et al. Protein Flexibility in Virtual Screening: The BACE-1 Case Study. Journal of Chemical Information and Modeling. 2012;52:2697–2704. doi: 10.1021/ci300390h. [DOI] [PMC free article] [PubMed] [Google Scholar]
- 13.Rueda M, Totrov M, Abagyan R. ALiBERO: Evolving a Team of Complementary Pocket Conformations Rather than a Single Leader. Journal of Chemical Information and Modeling. 2012;52:2705–2714. doi: 10.1021/ci3001088. [DOI] [PMC free article] [PubMed] [Google Scholar]
- 14.Hritz J, de Ruiter A, Oostenbrink C. Impact of Plasticity and Flexibility on Docking Results for Cytochrome P450 2D6: A Combined Approach of Molecular Dynamics and Ligand Docking. Journal of Medicinal Chemistry. 2008;51:7469–7477. doi: 10.1021/jm801005m. [DOI] [PubMed] [Google Scholar]
- 15.Richter L, et al. Diazepam-bound GABAA receptor models identify new benzodiazepine binding-site ligands. Nat Chem Biol. 2012;8:455–464. doi: 10.1038/nchembio.917. [DOI] [PMC free article] [PubMed] [Google Scholar]
- 16.Corbeil CR, Moitessier N. Docking ligands into flexible and solvated macromolecules. 3. Impact of input ligand conformation, protein flexibility, and water molecules on the accuracy of docking programs. Journal of Chemical Information and Modeling. 2009;49:997–1009. doi: 10.1021/ci8004176. [DOI] [PubMed] [Google Scholar]
- 17.Wei BQ, Weaver LH, Ferrari AM, Matthews BW, Shoichet BK. Testing a flexible-receptor docking algorithm in a model binding site. J Mol Biol. 2004;337:1161–1182. doi: 10.1016/j.jmb.2004.02.015. [DOI] [PubMed] [Google Scholar]
- 18.Clauben H, Buning C, Rarey M, Lengauer T. FlexE: efficient molecular docking considering protein structure variations. Journal of Molecular Biology. 2001;308:377–395. doi: 10.1006/jmbi.2001.4551. [DOI] [PubMed] [Google Scholar]
- 19.An J, et al. A Novel Small-Molecule Inhibitor of the Avian Influenza H5N1 Virus Determined through Computational Screening against the Neuraminidase. Journal of Medicinal Chemistry. 2009;52:2667–2672. doi: 10.1021/jm800455g. [DOI] [PubMed] [Google Scholar]
- 20.Brooijmans N, Humblet C. Chemical space sampling by different scoring functions and crystal structures. Journal of Computer-Aided Molecular Design. 2010;24:433–447. doi: 10.1007/s10822-010-9356-2. [DOI] [PubMed] [Google Scholar]
- 21.Newman J, Dolezal O, Fazio V, Caradoc-Davies T, Peat T. The DINGO dataset: a comprehensive set of data for the SAMPL challenge. Journal of Computer-Aided Molecular Design. 2012;26:497–503. doi: 10.1007/s10822-011-9521-2. [DOI] [PMC free article] [PubMed] [Google Scholar]
- 22.Zhong S, et al. Identification and Validation of Human DNA Ligase Inhibitors Using Computer-Aided Drug Design. Journal of Medicinal Chemistry. 2008;51:4553–4562. doi: 10.1021/jm8001668. [DOI] [PMC free article] [PubMed] [Google Scholar]
- 23.Amaro RE, et al. Discovery of drug-like inhibitors of an essential RNA-editing ligase in Trypanosoma brucei. Proceedings of the National Academy of Sciences. 2008;105:17278–17283. doi: 10.1073/pnas.0805820105. [DOI] [PMC free article] [PubMed] [Google Scholar]
- 24.Cheltsov AV, et al. Vaccinia Virus Virulence Factor N1L is a Novel Promising Target for Antiviral Therapeutic Intervention. Journal of Medicinal Chemistry. 2010;53:3899–3906. doi: 10.1021/jm901446n. [DOI] [PMC free article] [PubMed] [Google Scholar]
- 25.Sato T, et al. Identification of novel drug-resistant EGFR mutant inhibitors by in silico screening using comprehensive assessments of protein structures. Bioorganic & Medicinal Chemistry. 2012;20:3756–3767. doi: 10.1016/j.bmc.2012.04.042. [DOI] [PubMed] [Google Scholar]
- 26.Rogers KE, et al. Novel Cruzain Inhibitors for the Treatment of Chagas’ Disease. Chemical biology & drug design. 2012;80:398–405. doi: 10.1111/j.1747-0285.2012.01416.x. [DOI] [PMC free article] [PubMed] [Google Scholar]
- 27.Kumar A, Zhang KJ. Computational fragment-based screening using RosettaLigand: the SAMPL3 challenge. Journal of Computer-Aided Molecular Design. 2012;26:603–616. doi: 10.1007/s10822-011-9523-0. [DOI] [PubMed] [Google Scholar]
- 28.Bottegoni G, Kufareva I, Totrov M, Abagyan R. Four-Dimensional Docking: A Fast and Accurate Account of Discrete Receptor Flexibility in Ligand Docking. Journal of Medicinal Chemistry. 2008;52:397–406. doi: 10.1021/jm8009958. [DOI] [PMC free article] [PubMed] [Google Scholar]
- 29.Armen RS, Chen J, Brooks CL. An Evaluation of Explicit Receptor Flexibility in Molecular Docking Using Molecular Dynamics and Torsion Angle Molecular Dynamics. Journal of Chemical Theory and Computation. 2009;5:2909–2923. doi: 10.1021/ct900262t. [DOI] [PMC free article] [PubMed] [Google Scholar]
- 30.Dietzen M, Zotenko E, Hildebrandt A, Lengauer T. On the Applicability of Elastic Network Normal Modes in Small-Molecule Docking. Journal of Chemical Information and Modeling. 2012;52:844–856. doi: 10.1021/ci2004847. [DOI] [PubMed] [Google Scholar]
- 31.Vinh N, Simpson J, Scammells P, Chalmers D. Virtual screening using a conformationally flexible target protein: models for ligand binding to p38alpha MAPK. Journal of Computer-Aided Molecular Design. 2012;26:409–423. doi: 10.1007/s10822-012-9569-7. [DOI] [PubMed] [Google Scholar]
- 32.Barril X, Morley SD. Unveiling the Full Potential of Flexible Receptor Docking Using Multiple Crystallographic Structures. Journal of Medicinal Chemistry. 2005;48:4432–4443. doi: 10.1021/jm048972v. [DOI] [PubMed] [Google Scholar]
- 33.Afonine PV, et al. Joint X-ray and neutron refinement with phenix.refine. Acta Crystallographica Section D. 2010;66:1153–1163. doi: 10.1107/S0907444910026582. [DOI] [PMC free article] [PubMed] [Google Scholar]
- 34.Lang PT, et al. Automated electron-density sampling reveals widespread conformational polymorphism in proteins. Protein Science. 2010;19:1420–1431. doi: 10.1002/pro.423. [DOI] [PMC free article] [PubMed] [Google Scholar]
- 35.Shapovalov MV, Dunbrack RL. Statistical and conformational analysis of the electron density of protein side chains. Proteins: Structure, Function, and Bioinformatics. 2007;66:279–303. doi: 10.1002/prot.21150. [DOI] [PubMed] [Google Scholar]
- 36.Rosenfeld RJ, Hays A-MA, Musah RA, Goodin DB. Excision of a proposed electron transfer pathway in cytochrome c peroxidase and its replacement by a ligand-binding channel. Prot Sci. 2002;11:1251–1259. doi: 10.1110/ps.4870102. [DOI] [PMC free article] [PubMed] [Google Scholar]
- 37.Barelier S, et al. Roles for Ordered and Bulk Solvent in Ligand Recognition and Docking in Two Related Cavities. PLoS ONE. 2013;8:e69153. doi: 10.1371/journal.pone.0069153. [DOI] [PMC free article] [PubMed] [Google Scholar]
- 38.Brenk R, Vetter SW, Boyce SE, Goodin DB, Shoichet BK. Probing molecular docking in a charged model binding site. J Mol Biol. 2006;357:1449–1470. doi: 10.1016/j.jmb.2006.01.034. [DOI] [PMC free article] [PubMed] [Google Scholar]
- 39.Rocklin GJ, et al. Blind Prediction of Charged Ligand Binding Affinities in a Model Binding Site. Journal of Molecular Biology. 2013;425:4569–4583. doi: 10.1016/j.jmb.2013.07.030. [DOI] [PMC free article] [PubMed] [Google Scholar]
- 40.Wei BQ, Baase WA, Weaver LH, Matthews BW, Shoichet BK. A Model Binding Site for Testing Scoring Functions in Molecular Docking. J Mol Biol. 2002;322:339–355. doi: 10.1016/s0022-2836(02)00777-5. [DOI] [PubMed] [Google Scholar]
- 41.Coleman RG, Carchia M, Sterling T, Irwin JJ, Shoichet BK. Ligand Pose and Orientational Sampling in Molecular Docking. PLoS ONE. 2013;8:e75992. doi: 10.1371/journal.pone.0075992. [DOI] [PMC free article] [PubMed] [Google Scholar]
- 42.Meng EC, Shoichet B, Kuntz ID. Automated Docking with Grid-Based Energy Evaluation. J. Comp. Chem. 1992;13:505–524. [Google Scholar]
- 43.Sharp KA. Polyelectrolyte electrostatics: Salt dependence, entropic, and enthalpic contributions to free energy in the nonlinear Poisson–Boltzmann model. Biopolymers. 1995;36:227–243. [Google Scholar]
- 44.Irwin JJ, Sterling T, Mysinger MM, Bolstad ES, Coleman RG. ZINC: A Free Tool to Discover Chemistry for Biology. J Chem Inf Model. 2012 doi: 10.1021/ci3001277. [DOI] [PMC free article] [PubMed] [Google Scholar]
- 45.Carlsson J, et al. Ligand discovery from a dopamine D3 receptor homology model and crystal structure. Nat Chem Biol. 2011;7:769–778. doi: 10.1038/nchembio.662. [DOI] [PMC free article] [PubMed] [Google Scholar]
- 46.Mysinger MM, et al. Structure-based ligand discovery for the protein-protein interface of chemokine receptor CXCR4. Proc Natl Acad Sci USA. 2012;109:5517–5522. doi: 10.1073/pnas.1120431109. [DOI] [PMC free article] [PubMed] [Google Scholar]
- 47.Rogers DJ, Tanimoto TT. A Computer Program for Classifying Plants. Science. 1960;132:1115–1118. doi: 10.1126/science.132.3434.1115. [DOI] [PubMed] [Google Scholar]
- 48.Berman HM, et al. The Protein Data Bank. Nuc. Acid. Res. 2000;28:235–242. doi: 10.1093/nar/28.1.235. [DOI] [PMC free article] [PubMed] [Google Scholar]
- 49.Mysinger MM, Shoichet BK. Rapid Context-Dependent Ligand Desolvation in Molecular Docking. J. Chem. Inf. Model. 2010;50:1561–1573. doi: 10.1021/ci100214a. [DOI] [PubMed] [Google Scholar]
- 50.Gallagher K, Sharp K. Electrostatic Contributions to Heat Capacity Changes of DNA-Ligand Binding. Biophysical Journal. 1998;75:769–776. doi: 10.1016/S0006-3495(98)77566-6. [DOI] [PMC free article] [PubMed] [Google Scholar]
- 51.Ytreberg FM, Zuckerman DM. A black-box re-weighting analysis can correct flawed simulation data. Proceedings of the National Academy of Sciences. 2008;105:7982–7987. doi: 10.1073/pnas.0706063105. [DOI] [PMC free article] [PubMed] [Google Scholar]
Associated Data
This section collects any data citations, data availability statements, or supplementary materials included in this article.