Abstract
This study demonstrates a novel biomechanics testing protocol. The advantage of this protocol includes the use of an in situ loading device coupled to a high resolution X-ray microscope, thus enabling visualization of internal structural elements under simulated physiological loads and wet conditions. Experimental specimens will include intact bone-periodontal ligament (PDL)-tooth fibrous joints. Results will illustrate three important features of the protocol as they can be applied to organ level biomechanics: 1) reactionary force vs. displacement: tooth displacement within the alveolar socket and its reactionary response to loading, 2) three-dimensional (3D) spatial configuration and morphometrics: geometric relationship of the tooth with the alveolar socket, and 3) changes in readouts 1 and 2 due to a change in loading axis, i.e. from concentric to eccentric loads. Efficacy of the proposed protocol will be evaluated by coupling mechanical testing readouts to 3D morphometrics and overall biomechanics of the joint. In addition, this technique will emphasize on the need to equilibrate experimental conditions, specifically reactionary loads prior to acquiring tomograms of fibrous joints. It should be noted that the proposed protocol is limited to testing specimens under ex vivo conditions, and that use of contrast agents to visualize soft tissue mechanical response could lead to erroneous conclusions about tissue and organ-level biomechanics.
Keywords: Bioengineering, Issue 85, biomechanics, bone-periodontal ligament-tooth complex, concentric loads, eccentric loads, contrast agent
Introduction
Several experimental methods continue to be used to investigate the biomechanics of diarthrodial and fibrous joints. Methods specific to the tooth organ biomechanics include the use of strain gauges1-3, photoelasticity methods4,5, Moiré interferometry6,7, electronic speckle pattern interferometry8, and digital image correlation (DIC)9-14. In this study, the innovative approach includes noninvasive imaging using X-rays to expose the internal structures of a fibrous joint (mineralized tissues and their interfaces consisting of softer zones, and interfacing tissues such as ligaments) at loads equivalent to in vivo conditions. An in situ loading device coupled to a micro-X-ray microscope will be used. The load-time and load-displacement curves will be collected as the molar of interest within a freshly harvested rat hemi-mandible is loaded. The main goal of the approach presented in this study is to emphasize the effect of three-dimensional morphology of tooth-bone by comparing conditions at: 1) no load and when loaded, and when 2) concentrically and eccentrically loaded. Eliminating the need for cut specimens, and to perform experiments on whole intact organs under wet conditions will allow for maximum preservation of the 3D stress state. This opens a new area of investigation in understanding dynamic processes of the complex under various loading scenarios.
In this study, the methods for testing PDL biomechanics within an intact fibrous joint of a Sprague Dawley rat, a joint considered as an optimum bioengineering model system will be detailed. Experiments will include simulation of mastication loads under hydrated conditions in order to highlight three important features of the joint as they relate to organ level biomechanics. The three points will include: 1) reactionary force vs. displacement: tooth displacement within the alveolar socket and its reactionary response to loading, 2) three-dimensional (3D) spatial configuration and morphometrics: geometric relationship of the tooth with the alveolar socket, and 3) changes in readouts 1 and 2 due to a change in loading axis, i.e. from concentric to eccentric loads. The three fundamental readouts of the proposed technique can be applied to investigate the adaptive nature of joints in vertebrates either due to changes in functional demands, and/or disease. Changes in the aforementioned readouts, specifically the correlation between reactionary loads with displacement, and resulting reactionary load-time and load-displacement curves at different loading rates can be applied to highlight overall changes in joint biomechanics. Efficacy of the proposed protocol will be evaluated by coupling mechanical testing readouts to 3D morphometrics and overall biomechanics of the joint.
Protocol
Animal housing and euthanasia: All animals used in this demonstration were housed under pathogen-free conditions in accordance to the guidelines of the Institutional Animal Care and Use Committee (IACUC) and the National Institute of Health (NIH).
Provide animals with standard hard-pellet rat chow and water ad lib. Euthanize animals via a two-step method of carbon dioxide asphyxiation, bilateral thoracotomy in accordance with the standard protocol of UCSF as approved by IACUC. Perform biomechanical testing within 24 hours of animal sacrifice to avoid tissue degradation.
1. Preparation and Dissection of a Rat Mandible or Maxilla
Remove rat mandibles by gently severing membranous tissue and muscle tissue attachments while preserving the entire mandible, including the coronoid process and the condylar process (Figure 1)15.
Separate hemimandibles by carefully cutting the fibrous tissue of mandibular symphysis with a scalpel blade. Note: The coronary and condylar processes, and ramus of the mandible (Figure 1) should be removed if they physically obstruct biomechanical testing of the 2nd molar.
Cut the incisors without exposing the pulp chamber as not to hinder loading of the molar.
2. Specimen Preparation for in situ Compressive Loading (Figure 2)
Immobilize the specimen on a steel stub by using a material that is significantly stiffer than the experimental specimen prior to loading it in an in situ loading device (Figure 2A). Note: Polymethylmethacrylate (PMMA) was used to immobilize the specimen in this study and excess, if any, was removed using a dental explorer.
Align the occlusal surface of the molar(s) of interest parallel with the AFM metal specimen disc using a straight edge in both planes (i.e. mesial-distal and buccal-lingual).
Create a trough with a blunt instrument surrounding the molars. Note: This space should serve as a “moat” to contain excess liquid and maintain tissue hydration during in situ loading.
Prepare the tooth surface to build up for concentric (Figure 2B) or eccentric (Figure 2C) loading using a dental composite. Etch the surface of the tooth of interest with 35% phosphoric acid gel on occlusal surface for 15 sec.
Rinse the etchant thoroughly with deionized water and dry the surface using an air/water syringe or a compressed-air canister. With an explorer, spread a drop of the bonding agent into open cusps in a thin layer. Cure the composite with a dental curing light. Note: All steps involving composites should be performed without direct light from a lamp. Such conditions would undesirably accelerate the polymerization process, and could prevent proper placement of the composite. Room lighting is acceptable.
Remove excess bonding agent from adjacent teeth with a fine scalpel or razor blade.
Place flowable dental composite on the surface following the preparation of the surface and spread it into grooves of the molar(s) of interest using a dental explorer.
Expose the composite to dental curing light for 30 sec.
Mold an occlusal buildup of about 3-4 mm using a dental resin composite, from the occlusal plane of the molar(s) of interest and light cure for 30 sec.
Reduce the top of the composite buildup to a flat surface parallel to enable a consistent loading scheme across all specimens by using a straight edge and a high speed hand piece. Note: During biomechanical testing, other specimens should be stored in tris-phosphate buffered solution (TBS) with 50 mg/ml penicillin, and streptomycin15.
3. Loading Device Drift and Stiffness, Material Property Differentiating Capability, in situ Loading of the Fibrous Joint
Secure the specimen with the composite buildup on the anvil of the loading stage, and test for uniform loading as shown in Figure 2B.
Place an articulating paper on the surface of the composite followed by loading the specimen to a finite load to check for concentric or eccentric loading (Figures 2B and 2C).
Place TBS-soaked Kimwipe around the specimen to ensure specimen hydration. Make a trough around the specimen and fill it with TBS to keep the organ hydrated during imaging.
Input peak load and displacement rate into the Deben software to compress the molar to a desired peak load at a displacement rate following immobilization of the hemimandible. Note: Typical readouts should include a reactionary load as the material is compressed over time (load transducer sensitivity = 0.1 N). From load-time and displacement-time, a load-displacement curve for the compressed material should be obtained16-18. Using the data collected from the loading cycles, various properties of the joint can also be determined. The stiffness of the joint should be calculated by taking the slope of the linear portion (approximately the last 30% of the data) of the loading phase of the load vs. displacement curve19.
4. Staining of Soft Tissue, the PDL, with Phosphotungstic Acid (PTA)
Note: To enhance X-ray attenuation contrast, the PDL should be stained with 5% PTA solution20.
Backfill PTA staining solution into a clean 1.8 ml glass carpule and place loaded carpule into syringe.
Inject solution slowly (5 min/carpule) into the PDL-space of adjacent teeth to prevent structural damage to periodontal tissues surrounding molar of interest. Note: The above steps should be repeated until about 5 full carpules (9 ml) of solution are injected and allowed to flow into the surrounding tissues. The prepped specimens can also be soaked overnight in the remaining PTA solution (8 hr).
5. Recommended μ-XCT Scanning Settings
Perform m-XCT with the following scanning settings:
| Objective Magnification | 4X, 10X |
| 1,800 images | |
| X-ray tube voltage | 75 kVp (50 kVp for PTA stained samples) |
| 8 W | |
| Exposure Time | ~8-25 sec* |
| ~4 μm (4X objective),~2 μm (10X objective) ** |
* exposure time can vary based on the geometry and optical density of the specimen and X-ray tube voltage. ** actual pixel resolution will slightly differ based on the configuration of the source, specimen, and detector.
Representative Results
Estimation of loading device “backlash”, “pushback”, stiffness, and system drift under a constant load
Backlash: Between loading and unloading portions of the cycle, there exists a pause of 3 sec during which gears reverse within the motor before true unloading commences, i.e. as the specimen pulls away from the top jaw (Figure 3). This period is referred to as a backlash in the system, which represents a segment of time when the system is attempting to switch from closing to opening of the jaws. It should be noted that all load cycles will contain a similar backlash response regardless of specimen or loading conditions (Figure 4). A normal load vs. time curve obtained using a rigid body is shown in Figures 3A and 3B highlighting the loading, unloading, and backlash regions at two different loads of 6 N and 16 N. A normal load vs. displacement curve highlighting the corresponding three segments is shown in Figure 3C.
Pushback: While all backlash periods occur within the same 3 sec time frame, the reactionary response and as a result the shape of the backlash region could change depending on the specimen. By testing the system using a rigid body (Figure 3), the steepest and highest drop in reactionary load was observed when compared to the bone-PDL-tooth complex and polydimethlysiloxane (PDMS). However, the fibrous joint illustrated a significant drop in reactionary load during backlash phase compared to PDMS. PDMS (Figure 4) specimens appeared to have the least drop (no difference between the 1:05 and 1:25 crosslinker densities - Figure 4A).
Stiffness: Stiffness of the loading device when tested against rigid body was significantly higher than that of the complex and PDMS specimens. These data validate the effectiveness of the loading device to highlight changes in biomechanics of the bone-PDL-tooth complex and softer materials (Figure 4B).
Visualizing soft and hard tissue structures within the intact bone-PDL-tooth complex using μ-XCT: In an unstained, but hydrated fibrous joint, attenuation of hard tissue features, including alveolar bone, cementum, enamel, and dentin were highlighted (Figures 5A and 5B). However, spaces that contained predominantly softer organic tissues were transparent to X-rays, leaving the PDL-space relatively “empty” (black). Specimens treated with PTA showed increased contrast within the PDL-space, thus highlighting features representative of the PDL and gingival tissues (Figures 5C-F). Scanning at a higher magnification revealed PDL as a fibrous network between the tooth and bone.
Reactionary force vs. displacement: biomechanical response of the fibrous joint during in situ loading: Compared with concentric loading, eccentric loading pattern on a similar specimen showed increased displacement of the tooth within the joint for a given reactionary load (Figure 6A). However, for fibrous joints treated with PTA no significant differences in the overall biomechanics were observed regardless of the loading condition (Figure 6B). In the untreated but eccentrically loaded system, the increased displacement of the root into the alveolar socket can be correlated to lower stiffness as seen in the load-displacement curves (Figure 6C). While there could be a natural variance leading to a range of biomechanical responses of fibrous joints harvested within control groups, PTA-treated fibrous joints exhibited increased stiffness and displaced less within the socket compared to untreated counterparts for a given reactionary peak load. However, there was no detectable change in shape or duration of the backlash phase of the load cycle between untreated and PTA treated specimens.
Three-dimensional spatial configuration and morphometrics: mapping the bone-tooth configuration under loaded conditions using μ-XCT: Virtual slices taken from tomograms were compared to illustrate 1) tooth movement within the socket, 2) tooth-bone association both in 2D and 3D, 3) the extent of movement due to eccentric compared to concentric loading. Tooth movement was highlighted by superimposition of similar virtual slices at no load and at load and generating gif movies. While both loading schemes caused the tooth to displace vertically within the joint, an eccentric loading configuration (Figures 7B and 7C) caused an additional rotational effect of the tooth with the roots rotating distally resulting in decreased PDL space along the distal sides of the roots compared with concentric loading scans (Figures 7 and 8). Although the PTA-stained PDL was more attenuating (Figure 5), the movement of the tooth within alveolar socket in the PTA treated joints was less pronounced and correlated with the biomechanical data (Figures 6B and 6C).
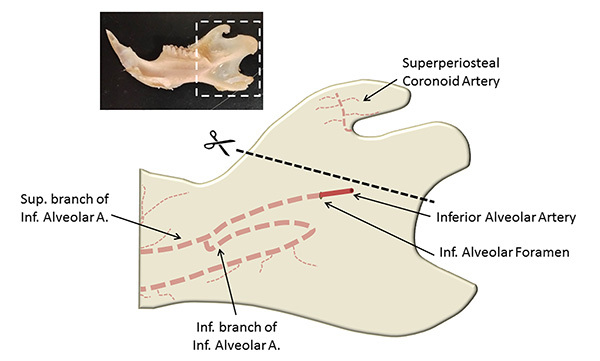 Figure 1. An adapted15 illustration of key locations when preparing the hemimandible for biomechanical testing. Shown within the inset is a hemimandible.
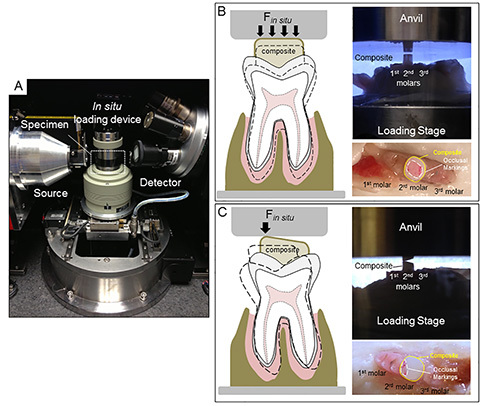 Figure 2. Configuration of an in situ loading unit and µ-XCT system. (A) An image of an in situ loading device on a custom holder within the micro-X-ray computed tomography (μ-XCT) unit. Concentric (B) and eccentric (C) loading conditions determined by the type of contact between the anvil and the composite surface are illustrated in the form of schematics, and the corresponding experimental setups (region corresponds to that highlighted by the white box in (A) respectively. Marks from articulating paper confirm initial contact area between the anvil and the dental composite. Click here to view larger image.
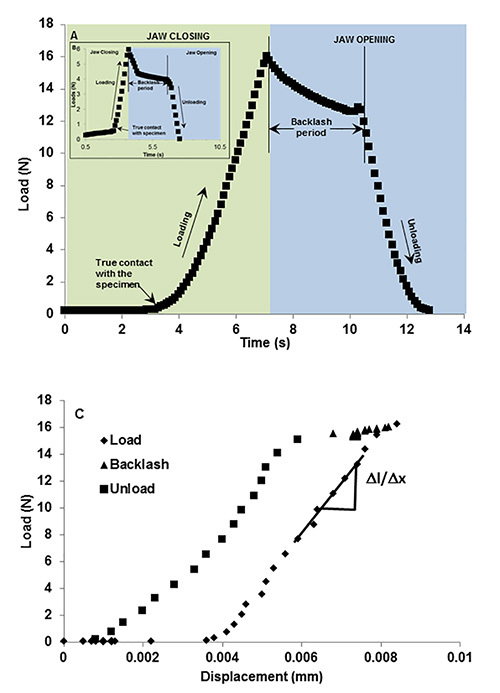 Figure 3. Representative load-time curve illustrating system “backlash”. Load vs. time using a rigid body illustrates backlash period as an event between closing and opening of the anvils. The green region indicates loading period where anvils are approaching (green region) to load a rigid body to 15 N (A) and 5 N (B, inset). The blue region indicates an unloading period where the anvils are retracting from each other. However due to the lack of instantaneous motor response due to time taken by gear reversal, there lies a back lash period of ~3 sec. During this time the load decreases approximately by 2 N before true unloading occurs. Loading and unloading events can be related to load vs. displacement graphs (C) which shows minimal displacement during the backlash period. Click here to view larger image.
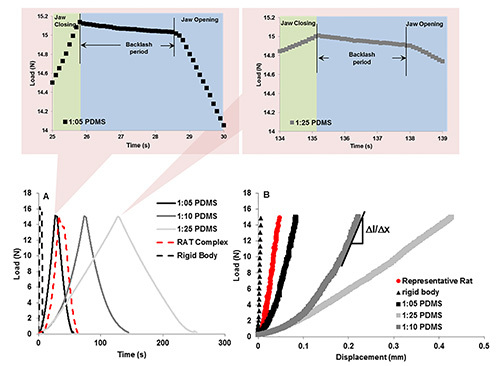 Figure 4. Representative load-displacement curves and “pushback” effect using PDMS. Bottom curves: Load-time relationships between PDMS of decreasing monomer to crosslinker ratios reveal the ability of the in situ loading unit to detect differences in material properties. Top curves, left and right illustrate the change in backlash of the system due to material recovery. The left and right when compared illustrate the same effect, indicating that the recovery difference between 1:25 and 1:05 PDMS is minimal or is not within the detection limits of the loading device. B) Load-displacement curves for varying materials including rigid body aluminum, experimental specimen, and the 3 PDMS specimens. It is the slope of the 30% linear part of the loading curve that was used to calculate stiffness of the material. Click here to view larger image.
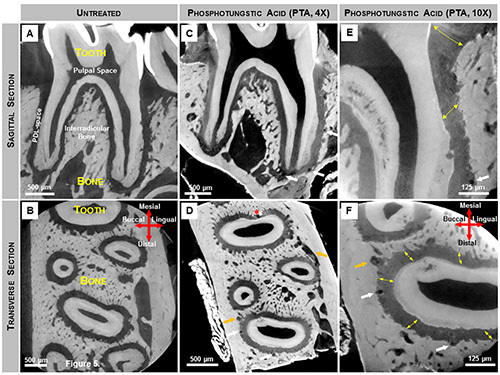 Figure 5. X-ray virtual sections of mandibular second molars stained for PDL structure enhancement. (A, B) Grey scale values within untreated molars indicate X-ray attenuation of various tissues including the softer regions within the complex. However, nonmineralized tissues such as PDL were not highlighted due to its minimal attenuating characteristics of X-ray energy at 75 kVp. (C-F) Following PTA staining the attenuating characteristics of the softer PDL were enhanced and details within the PDL were visualized using an X-ray microscopy. Thus, 2D virtual sagittal (C-4X magnification, E-10X magnification) and transverse (D-4X magnification, F-10X magnification) sections revealed PDL fiber orientation (yellow arrows). The lumen of blood vessels within endosteal spaces (orange arrows) and the PDL (white arrows) appear as dark circular structures, while the pulpal space remains unstained. Artifacts created during the staining procedure are also noted (D, red asterisks). Click here to view larger image.
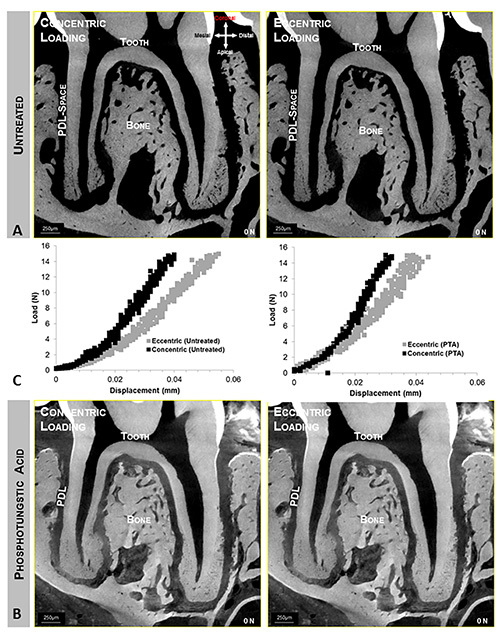 Figure 6. Concentrically and eccentrically loaded specimens. Top (A) and bottom panels (B) illustrate quick time movies of tooth-bone relationship at no load and when loaded to 15 N, concentrically and eccentrically respectively. Top and bottom panels illustrate bone-tooth association when untreated (A) and stained (B) conditions. Center panel (C) illustrates different load-displacement behaviors between eccentrically and concentrically (left curves) loaded complexes, and stained and unstained (right curves) complexes. Click here to view larger image.
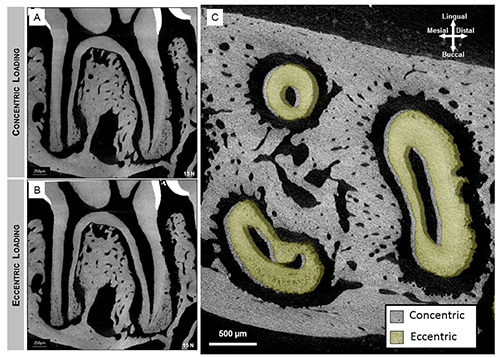 Figure 7.Sagittal section of 2nd molar illustrates the association of the tooth with the alveolar socket when loaded concentrically (A) and eccentrically (B). Majority of compression was seen within interradicular (arrow heads) and apical (arrows) regions. When compared to virtual sections of the tooth in eccentric loading (B), the additional rotational component of the tooth motion causes increased compression to the distal side of the mesial root. Overlaid transverse sections revealed distal translation and clockwise rotational movement of the tooth (green roots) relative to a concentrically loaded tooth (gray). Click here to view larger image.
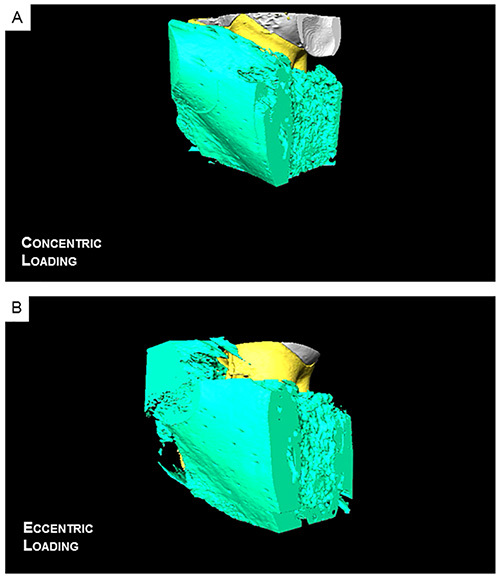 Figure 8.Reconstructed 3D movies reveal a decreased PDL-space within the distal side of the root when eccentrically loaded (E) compared to a concentrically loaded complex (D). Click here to view the eccentric loading and click here to view concentric loading.
Discussion
The first step in establishing this protocol involved evaluating the stiffness of the loading frame by using a rigid body. Based on the results, the stiffness was significantly higher enabling the use of the loading device for further testing of specimens with significantly lower stiffness values. The second step highlighted the ability of the instrument to distinguish different stiffness values by using two phases of the loading-unloading curve generated by using a rigid body, PDMS materials of different crosslink densities, and fibrous joints. The stiffness from the loading phase and pushback during the backlash phase were used to identify the resistance of the material to loading and recovery of the material following unloading (Figures 3 and 4). The third and fourth steps of the protocol were to correlate the changes in load-displacement curves obtained from the loading device to the in situ imaging done with the use of X-rays (Figure 5). This involved loading the joints and obtaining tomograms at no load and load, under concentric and eccentric conditions respectively. The protocol demonstrated that by changing the loading axis differences in levels of PDL-compression can be highlighted (Figures 6 and 7). In this discussion we will first highlight instrument features and challenges that should be adequately understood and met prior to biomechanical testing of the bone-PDL-tooth complex.
Challenges of experimental setup
Composite buildup: While the protocol itself is relatively straightforward, there are several steps that must be done with great care. One of the biggest challenges was to ensure that excess composite material did not overflow to adjacent teeth, which would then mechanically link multiple teeth and misrepresent the joint mechanics of a single tooth. Since significant manual dexterity and knowledge of dental tools proved to be useful for this procedure, preparation of specimens for loading was primarily performed by dental students and dentists with the assistance of optical magnification.
Consistent loading scheme: Another important detail for biomechanical testing was to ensure a consistent loading scheme. The contact area between the jaw of the in situ loading device and opposing surface of the composite proved to be very crucial to the experiment. This is because mechanics of the fibrous joint can change as a result of the area of contact, which was simulated in this study by using concentric and eccentric (unbalanced) loads. The scenario presented in this study mimics possible changes in occlusion of mammalian teeth, which could result in a change in tooth movement within the alveolar socket (Figure 5). While it is understood that the proposed testing mechanism does not mimic physiological mastication cycle, it presents itself as a standard testing method. By creating a composite buildup with a surface parallel to the jaw of the loading stage, we were able to generate a consistent loading pattern. This standard testing method can be used to identify changes in biomechanics of the bone-PDL-tooth complexes from various experimental groups.
Sensitivity of the in situ loading device: The experimental protocol describes methods for validating detection limits of the in situ loading device using three different specimens, of which two can be considered as standard materials. The stiffness of the loading frame when tested with aluminum was significantly higher with negligible contribution to the observed mechanical behavior of various PDMS specimens, and the biomechanical response of a fibrous joint. While all the specimens tested had a backlash period of ~3 sec, the shape of the backlash portion slightly varied (Figure 4A) with the type of specimen. Rigid specimens exhibited a sharp decrease in reactionary load (Figures 3A and 4A) while softer specimens did not exhibit a sharp decrease (Figure 4A). It can be argued that the difference in backlash behavior is attributed to the ability of the specimen to push back on the gears during gear reversal. The push back effect on the gears could manifest into a lower drop in the peak reactionary response of the material as the jaw starts to move away from the specimen. Thus, the backlash segment can be exploited to gain insights to material property. Stiffness values of PDMS calculated from load displacement curves were in agreement with literature values22, and the range of stiffness for the crosslinked PDMS was within the range of the bone-PDL-tooth complex. Hence, the in situ loading device is suitable for measuring the displacement and reactionary response of the tooth as it is compressed into the alveolar socket. The reactionary response can be from softer and/or harder constituents. The dominance of the softer constituent over the harder can be identified by loading incrementally and imaging, followed by digitally correlating the no load to loaded conditions to identify strain-dominated regions within the bone-PDL-tooth complex13.
Principal component of mastication is in the axial direction: Similar to humans, the mastication cycle of rats involve the free motion of the mandible to chew food23,24. While this motion has been mapped to include many different directions such as lateral movements, the principal component of load is thought to be in the axial direction 23. Therefore, the simulated in situ loads in axial direction were placed either concentrically or eccentrically (Figure 2).
Experimental factors that could affect results related to organ level biomechanics: The advantage of coupling X-ray microscopy with in situ loading is that the load-displacement curve can be correlated to the spatial association of the tooth with the alveolar socket, form of the root and the alveolar surface, and the narrowing and widening of the PDL-space under load. The correlation and complementary evaluation provides a holistic approach to determine organ biomechanics. In the past, it was only postulated that the mechanics of an organ and/or tissues can prompt the load-displacement behavior. This protocol illustrated that the association of the moving members when under load can also be a defining characteristic of observed stiffness. Any changes observed within the first 5-8 N is thought to be contributed by the quality of the PDL an initial conformational change within the collagen and interstitial fluid exchange with minimum resistance to load; this region has been referred to as the “uncrimping” region26. Loads higher than 7 N could be contributed by tooth, bone, the strain-hardening effects of the periodontal ligament, and the interfaces attaching the tissues. Once the PDL-space is minimized and as the PDL undergoes strain hardening, hard tissue interactions between the tooth and bony socket arise at the interradicular region resulting in a steeper load to displacement slope. In addition to material recovery, the backlash of the loading device can be exploited to investigate the viscoelastic nature of the PDL without altering the joint as was done in other studies16,25.
The general regions within the load displacement curves correlate to some events within the joint. The above events are the common denominators between the two loading schemes. However, the differences between concentric and eccentric load-displacement profiles and corresponding tomograms highlighted the influence of load direction on the overall organ biomechanics. The main source of these differences was the introduction of a tooth rotation as it displaces within the joint, causing the compression of PDL spaces at specific areas. It is understood that normal physiological loads are applied on the tooth in several directions including those that introduce rotational tooth movement. However, it is recommended that a concentric loading scheme be used as a standard loading scheme due to the difficulty of applying a “standard” eccentric load across all specimens. As such this experimental protocol can be used to differentiate biomechanical differences between adapted and nonadapted systems.
One of the drawbacks of using higher energy X-rays is that they are minimally absorbed by softer tissues and produced inadequate contrast. The PDL is transparent to X-rays and as a result necessitates the use of contrast agents. PTA enhances the contrasts of soft tissues by directly staining27-29 and allowing for visualization by using X-rays. Hence, by using the contrast agents, visible deformation within stained soft tissue regions between loaded and unloaded tomographies was observed; however higher magnification (at least 10X) is recommended for analysis (data not shown). A limitation of the staining protocol included the use of ethanol, a mild fixative29 which could have altered the stiffness of the PDL and overall joint mechanics leading to erroneous conclusions.
CONCLUSIONS
This study highlights a novel testing protocol to analyze the biomechanical response of an intact bone-PDL-tooth fibrous joint, but under ex vivo conditions. The described experimental method including post analyses of data can be used to measure effects of experimental variables (i.e. disease, growth factors, age, and therapeutic molecules) on the mechanics of the bone-PDL-tooth fibrous joint. Additionally, results from these experiments will serve as a baseline for which relationships between variations at the macroscale organ level can be related to specific changes at the tissue and cellular levels. Limitations of the protocol include, imaging under ex vivo conditions, use of contrast agents, and loss in spatial accuracy between surfaces of the tooth and alveolar socket due to tissue relaxation during longer acquisition times necessary for tomogram generation.
SUPPLEMENTAL MATERIAL
Protocol for Biomechanical testing of molars within maxillae:
1. If maxillae were to be tested, remove the maxilla from each rat skull with the ventral aspect (roof of the mouth) facing upward. Sever the muscle and ligament connective tissues from the lateral aspect of the skull by cutting through the vestibule (pocket between the gums and cheek).
2. Palpate and fracture the zygomatic process of the maxillary bone of the skull and sever the zygomatic arch from the maxillary bone.
3. Cut the skull straight down with a pair of bulk dissection scissors through the brain starting from the soft palate. Isolate the anterior aspect of the skull and peel the scalp away from the dorsal aspect (top) of the skull.
4. With a pair of fine dissection scissors, separate the right and left hemimaxillae by making an incision that follows a straight line through the center of the hard palate and to the interproximal region between the incisors. Make sure that the depth of the cut is shallow – only deep enough to puncture the hard palate.
5. Isolate the hemimaxillae by making perpendicular (to the long axis of the skull) incisions anterior to the first molar and posterior to the third molar. 1) Do not cut too closely to the first and third molars for this might disrupt root structure; 2) Do not rip away the gingival tissue surrounding all three molars. Separate the hemimaxillae from the skull by cutting the thin maxillary bone superior to each hemimaxilla. Remove any excess tissue and bony spicules.
Validation of the mechanical testing device:
In order to determine the stiffness of the loading frame and the drift of the load/displacement transducers, use a rigid body such as aluminum with an elastic modulus by far higher than that of the experimental specimen.
To determine if the instrument is capable of differentiating various stiffness values representative of softer elements, fabricate PDMS blocks with different crosslink densities (1:5, 1:10, 1:25 crosslinker to base by weight) and load these using the same in situ loading device.
Phase Contrast Mode for contrast enhancement of softer elements: Contrast enhancement of the PDL can be done by exploiting the phase contrast mode of the scanner. Fundamentally, phase contrast exploits scanner detection capabilities of a shift in phase at the edges of tissues, and provides enhanced structural detail. As a result, in this study, the lacunae of cementocyte-lacunae and osteocyte-lacunae appeared as porosities within respective mineralized tissues. These structures were previously undetected in a standard scan under absorption mode. Tomograms acquired under transmission mode allowed for the visualization of structures within the negative space, namely the PDL-space and endosteal spaces including the Haversian canal system (for 3D model see Figure S1). Additional structures within the PDL-space may be visualized as well, such as the vasculature that is continuous with that in bone.
Equilibrated loads for tomogram acquisition and system drift: This section can be best explained by referring to Supplemental Figure 2. Figure S2A demonstrates the need to equilibrate peak loads prior to acquiring tomograms. Peak loads invariably decay to a lower magnitude and the system should be equilibrated at least for an hour before a 6-8 hour tomogram is acquired. It should be noted that the tomogram acquired is not representative of the bone-tooth association at the peak load, but at a load 2-3 N lower than the peak load. Additionally, the measured system drift identified using a rigid aluminum stub was found to change with displacement rate and/or peak loads (Figure S2B and S2C). Approximated drift values ranged from +1 N/hour.
Following mechanical testing, a tomogram of the fibrous joint was taken at no load, and to a peak load at a desired displacement rate. Prior to acquiring a tomogram under loaded conditions, care should be taken to allow the system to come to an equilibrium (stability) following which scanning should proceed. Similar conditions were repeated for eccentrically loaded and PTA stained complexes. From the tomograms, virtual slices were compared at no load to loaded conditions in order to identify tooth-bone association both in two- and three-dimensions.
Supplemental Figure 1. 3D reconstruction of negative space using phase contrast enhanced X-ray microscopy. Under phase contrast enhancement mode the phase shift that occurs at the edges of tissues was exploited to highlight blood vessels within the PDL. Specifically absorption mode (left) highlighted mineralized tissues within the field of view, while transmission mode (right) highlighted the blood vessels within the PDL space as well the endosteal spaces.
Supplemental Figure 2. Decay of peak reactionary forces to an equilibrium state prior to CT-scanning. Curves indicate different decay rates of reactionary response of a fibrous joint(top panel), and a rigid body (bottom panel).
Disclosures
The authors have nothing to disclose.
Acknowledgments
The authors acknowledge funding support NIH/NIDCR R00DE018212 (SPH), NIH/NIDCR-R01DE022032 (SPH), NIH/NIDCR T32 DE07306 (AJ, JDL), NIH/NCRR S10RR026645, (SPH) and Departments of Preventive and Restorative Dental Sciences and Orofacial Sciences, UCSF. In addition, the authors acknowledge Xradia Graduate Fellowship (AJ), Xradia Inc., Pleasanton, CA.
The authors thank Dr. Kathryn Grandfield, UCSF for her assistance with post processing of data; Drs. Stephen Weiner and Gili Naveh, Weizmann Institute of Science, Rehovot, Israel; Dr. Ron Shahar, The Hebrew University of Jerusalem, Israel for their insightful discussions specific to the in situ loading device. The authors would also like to thank Biomaterials and Bioengineering MicroCT Imaging Facility at UCSF for the use of Micro XCT and the in situ loading device.
References
- Popowics TE, Rensberger JM, Herring SW. Enamel microstructure and microstrain in the fracture of human and pig molar cusps. Arch. Oral Biol. 2004;49:595–605. doi: 10.1016/j.archoralbio.2004.01.016. [DOI] [PubMed] [Google Scholar]
- Jantarat J, Palamara JE, Messer HH. An investigation of cuspal deformation and delayed recovery after occlusal loading. J. Dent. 2001;29:363–370. doi: 10.1016/s0300-5712(01)00018-5. [DOI] [PubMed] [Google Scholar]
- Jantarat J, Panitvisai P, Palamara JE, Messer HH. Comparison of methods for measuring cuspal deformation in teeth. J. Dent. 2001;29:75–82. doi: 10.1016/s0300-5712(00)00040-3. [DOI] [PubMed] [Google Scholar]
- Asundi A, Kishen A. A strain gauge and photoelastic analysis of in vivo strain and in vitro stress distribution in human dental supporting structures. Arch. Oral Biol. 2000;45:543–550. doi: 10.1016/s0003-9969(00)00031-5. [DOI] [PubMed] [Google Scholar]
- Asundi A, Kishen A. Advanced digital photoelastic investigations on the tooth-bone interface. J. Biomed. Opt. 2001;6:224–230. doi: 10.1117/1.1344587. [DOI] [PubMed] [Google Scholar]
- Wang RZ, Weiner S. Strain-structure relations in human teeth using Moire fringes. J. Biomech. 1998;31:135–141. doi: 10.1016/s0021-9290(97)00131-0. [DOI] [PubMed] [Google Scholar]
- Wood JD, Wang R, Weiner S, Pashley DH. Mapping of tooth deformation caused by moisture change using moire interferometry. Dent. Mater. 2003;19:159–166. doi: 10.1016/s0109-5641(02)00025-8. [DOI] [PubMed] [Google Scholar]
- Dong-Xu L, et al. Modulus of elasticity of human periodontal ligament by optical measurement and numerical simulation. Angle Orthod. 2011;81:229–236. doi: 10.2319/060710-311.1. [DOI] [PMC free article] [PubMed] [Google Scholar]
- Li J, Li H, Fok AS, Watts DC. Multiple correlations of material parameters of light-cured dental composites. 2009;25:829–836. doi: 10.1016/j.dental.2009.03.011. [DOI] [PubMed] [Google Scholar]
- Zhang D, Arola DD. Applications of digital image correlation to biological tissues. J. Biomed. Opt. 2004;9:691–699. doi: 10.1117/1.1753270. [DOI] [PubMed] [Google Scholar]
- Zhang D, Mao S, Lu C, Romberg E, Arola D. Dehydration and the dynamic dimensional changes within dentin and and enamel. Dent. Mater. 2009;25:937–945. doi: 10.1016/j.dental.2009.01.101. [DOI] [PMC free article] [PubMed] [Google Scholar]
- Qian L, Todo M, Morita Y, Matsushita Y, Koyano K. Deformation analysis of the periodontium considering the viscoelasticity of the periodontal. 2009;25:1285–1292. doi: 10.1016/j.dental.2009.03.014. [DOI] [PubMed] [Google Scholar]
- Lin JD, et al. Biomechanics of a bone-periodontal ligament-tooth fibrous joint. J. Biomech. 2012. [DOI] [PMC free article] [PubMed]
- Qian L, Todo M, Morita Y, Matsushita Y, Koyano K. Deformation analysis of the periodontium considering the viscoelasticity of the periodontal. 2009;25:1285–1292. doi: 10.1016/j.dental.2009.03.014. [DOI] [PubMed] [Google Scholar]
- Huelke DF, Castelli WA. The blood supply of the rat mandible. Anat. Rec. 1965;153:335–341. doi: 10.1002/ar.1091530402. [DOI] [PubMed] [Google Scholar]
- Chiba M, Komatsu K. Mechanical responses of the periodontal ligament in the transverse section of the rat mandibular incisor at various velocities of loading in vitro. J. Biomech. 1993;26:561–570. doi: 10.1016/0021-9290(93)90017-9. [DOI] [PubMed] [Google Scholar]
- Natali AN, et al. A visco-hyperelastic-damage constitutive model for the analysis of the biomechanical response of the periodontal ligament. J. Biomech. Eng. 2008;130 doi: 10.1115/1.2900415. [DOI] [PubMed] [Google Scholar]
- Naveh GR, Shahar R, Brumfeld V, Weiner S. Tooth movements are guided by specific contact areas between the tooth root and the jaw bone: A dynamic 3D microCT study of the rat molar. J. Struct. Biol. 2012;177:477–483. doi: 10.1016/j.jsb.2011.11.019. [DOI] [PubMed] [Google Scholar]
- Lin JD, et al. Biomechanics of a bone-periodontal ligament-tooth fibrous joint. J. Biomech. 2013;46:443–449. doi: 10.1016/j.jbiomech.2012.11.010. [DOI] [PMC free article] [PubMed] [Google Scholar]
- Metscher BD. MicroCT for comparative morphology: simple staining methods allow high-contrast 3D imaging of diverse non-mineralized animal tissues. BMC Physiol. 2009;9 doi: 10.1186/1472-6793-9-11. [DOI] [PMC free article] [PubMed] [Google Scholar]
- Carrillo F, et al. Nanoindentation of polydimethylsiloxane elastomers: Effect of crosslinking, work of adhesion, and fluid environment on elastic modulus (vol 20, pg 2820) J. Mater. Res. 2006;21:535–537. [Google Scholar]
- Hiiemae KM. Masticatory function in the mammals. J. Dent. Res. 1967;46:883–893. doi: 10.1177/00220345670460054601. [DOI] [PubMed] [Google Scholar]
- Hunt HR, Rosen S, Hoppert CA. Morphology of molar teeth and occlusion in young rats. J. Dent. Res. 1970;49:508–514. doi: 10.1177/00220345700490030701. [DOI] [PubMed] [Google Scholar]
- Komatsu K, Sanctuary C, Shibata T, Shimada A, Botsis J. Stress-relaxation and microscopic dynamics of rabbit periodontal ligament. J. Biomech. 2007;40:634–644. doi: 10.1016/j.jbiomech.2006.01.026. [DOI] [PubMed] [Google Scholar]
- Lin JD, et al. Biomechanics of a bone-periodontal ligament-tooth fibrous joint. J. Biomech. 2013;46:443–449. doi: 10.1016/j.jbiomech.2012.11.010. [DOI] [PMC free article] [PubMed] [Google Scholar]
- Quintarelli G, Zito R, Cifonelli JA. On phosphotungstic acid staining. I. J. Histochem. Cytochem. 1971;19:641–647. doi: 10.1177/19.11.641. [DOI] [PubMed] [Google Scholar]
- Quintarelli G, Cifonelli JA, Zito R. On phosphotungstic acid staining. II. J. Histochem. Cytochem. 1971;19:648–653. doi: 10.1177/19.11.648. [DOI] [PubMed] [Google Scholar]
- Quintarelli G, Bellocci M, Geremia R. On phosphotungstic acid staining. IV. Selectivity of the staining reaction. J. Histochem. Cytochem. 1973;21:155–160. doi: 10.1177/21.2.155. [DOI] [PubMed] [Google Scholar]
- Crabtree WN, Murphy WM. The value of ethanol as a fixative in urinary cytology. Acta Cytol. 1980;24:452–455. [PubMed] [Google Scholar]


