The selectivity of acid-sensing ion channels to cations depends on interactions with binding sites both within the pore and in the outer vestibule.
Abstract
The ability of acid-sensing ion channels (ASICs) to discriminate among cations was assessed based on changes in conductance and reversal potential with ion substitution. Human ASIC1a was expressed in Xenopus laevis oocytes, and acid-induced currents were measured using two-electrode voltage clamp. Replacement of extracellular Na+ with Li+, K+, Rb+, or Cs+ altered inward conductance and shifted the reversal potentials consistent with a selectivity sequence of Li ∼ Na > K > Rb > Cs. Permeability decreased more rapidly than conductance as a function of atomic size, with PK/PNa = 0.1 and GK/GNa = 0.7 and PRb/PNa = 0.03 and GRb/GNa = 0.3. Stimulation of Cl− currents when Na+ was replaced with Ca2+, Sr2+, or Ba2+ indicated a finite permeability to divalent cations. Inward conductance increased with extracellular Na+ in a hyperbolic manner, consistent with an apparent affinity (Km) for Na+ conduction of 25 mM. Nitrogen-containing cations, including NH4+, NH3OH+, and guanidinium, were also permeant. In addition to passing through the channels, guanidinium blocked Na+ currents, implying competition for a site within the pore. The role of negative charges in an external vestibule of the pore was evaluated using the point mutation D434N. The mutant channel had a decreased single-channel conductance, measured in excised outside-out patches, and a macroscopic slope conductance that increased with hyperpolarization. It had a weakened interaction with Na+ (Km = 72 mM) and a selectivity that was shifted toward larger atomic sizes. We conclude that the selectivity of ASIC1 is based at least in part on interactions with binding sites both within and internal to the outer vestibule.
INTRODUCTION
The acid-sensing ion channels (ASICs) are part of a superfamily of channels that includes the epithelial Na channel (ENaC), FMRFamide-gated channels (FaNaC), and mechanosensitive channels in the mec/deg family (Garty and Palmer, 1997; Kellenberger and Schild, 2002). These cation channels are weakly voltage dependent and have a variable selectivity for Na+ over K+ and other cations. ENaC is highly selective, allowing passage of smaller ions including H+ and Li+, whereas permeation by K+ and larger cations is virtually undetectable (Palmer, 1987). This pattern is consistent with the idea of a selectivity filter forming a molecular sieve (Palmer, 1987; Kellenberger et al., 2001). ASICs, while also selective for Na+, have a measurable permeability to K+ (Li et al., 2011; Carattino and Della Vecchia, 2012), with one study indicating a permeability ratio PNa/PK of 8 (Bässler et al., 2001). This suggests that sieving is not sufficient to account for selectivity in these channels and implies more specific interactions with the pore-forming elements of the channels (Carattino and Della Vecchia, 2012).
Here we examine the selectivity properties of the ASIC1a channel in detail. We compare the degree of discrimination among ions based on conductance and permeability (reversal potential) measurements. We also investigate movement of nitrogen-based cations through ASIC1 channels. Ions such as NH3OH+ and guanidinium pass through voltage-gated Na channels (Hille, 1971) but not ENaC (Palmer, 1982a). Finally, we explore the role of the negatively charged outer vestibule, shown to bind monovalent cations in crystal structures (Gonzales et al., 2009), in conferring selectivity properties.
MATERIALS AND METHODS
Expression of hASIC1a in Xenopus laevis oocytes
Oocytes were harvested from Xenopus according to the guidelines and with approval of the Institutional Animal Care and Use Committee of Weill Cornell Medical College. The animals were anesthetized through immersion in 1 liter of tap water containing 1.9 g/liter tricaine methanesulphonate and HEPES (adjusted to pH 7.4) for 10–15 min. Once the animals were anesthetized, a small incision was made in the abdomen and part of the ovary was removed. The oocytes were then dissociated through incubation in OR2 solution (mM: 82.5 NaCl, 2.5 KCl, 1 MgCl2, 1 Na2HPO4, and 5 HEPES, pH 7.4) supplemented with 2 mg/ml collagenase type II (Worthington Biochemical Corporation) and 2 mg/ml hyaluronidase type II (Sigma-Aldrich) for 1 h.
hASIC1 cloned in a PCR2.1 plasmid was a gift of C. Canessa (Yale University, New Haven, CT). The coding sequence corresponds to NCBI Nucleotide accession no. NM_001095.3 (hASIC1 transcript variant 2). At the amino acid level (NCBI Protein accession no. NP_001086.2), it is 98% identical to the rat ASIC1a orthologue and is therefore termed hASIC1a (Li et al., 2012). Plasmids were linearized with HindIII restriction enzyme, and cRNAs were transcribed with T7 RNA polymerase using the mMESSAGE mMACHINE kit (Ambion). cRNA pellets were dissolved in nuclease-free water and stored at −70°C before use. The oocytes were injected with 10 ng RNA and incubated for 1–2 d in L-15 solution (Sigma-Aldrich) supplemented with HEPES, pH 7.4, 63 mg/liter penicillin, and 145 mg/liter streptomycin in 18°C. All chemicals were purchased from Sigma-Aldrich unless otherwise noted.
The D434N mutation was constructed using the QuikChange kit from Agilent Technologies according to the manufacturer’s instructions. Sequences were confirmed by GENEWIZ.
Two-electrode voltage clamp
For measurement of macroscopic currents through ASICs, oocytes were placed in a rapid-exchange chamber (OPC-1; AutoMate Scientific) in which the bath pH could be changed in <1 s. The basic recording solution contained (mM) 110 NaCl, 2 KCl, 3 MgCl2, and 5 HEPES with pH 7.4 or 5.0. At the lower pH the buffer strength of the solution was low but the pH was maintained by a high flow rate (5 ml/min). Ion substitutions are as described in the Results section.
Whole-cell currents were measured in intact oocytes using a two-electrode voltage clamp (OC-725 [Warner Instrument Corp.] with ITC-16 interface [InstruTech/HEKA]) running Pulse software (HEKA). Pipette resistances were 0.5–1 MΩ when filled with 3 M KCl. For measurements of I-V relationships, the holding potential was −100 mV and 50-ms voltage ramps from −100 to 80 mV were applied every 200 ms. Similar ramps were used previously to study the electrical properties of oocytes (Schmitt and Koepsell, 2002).
Patch clamp
Immediately before patch-clamp measurements, the vitelline membranes of the oocytes were mechanically removed in a hypertonic solution containing 200 mM sucrose. Patch-clamp pipettes were prepared from hematocrit capillary glass (VWR Scientific) using a three-stage vertical puller. They had resistances of 2–8 MΩ. Measurements were made in excised outside-out patches. The pipette solution contained (mM) 110 KCl, 5 EGTA, 2 MgCl2, and 5 HEPES buffered to pH 7.4 with KOH. Bath solutions contained (mM) 110 NaCl, 2 KCl, 3 MgCl2, and 5 HEPES buffered to pH 7.4 or 5.0. Currents were recorded with an EPC-7 patch-clamp amplifier (HEKA) and digitized with a Digidata 1332A interface (Molecular Devices). Data were filtered at 1 kHz and analyzed with pCLAMP9 software (Molecular Devices).
Data analysis
I-V relationships were calculated by subtracting background currents measured at pH 7.4 from those measured during activation of the channels at pH 5.0. In noninjected oocytes these difference currents were negligible, indicating that the evoked current responses were attributable to ASICs. The subtraction procedure also corrected for capacitative currents generated by the voltage ramp.
Slope conductances were measured from I-V plots over voltages of −60 mV or higher. Permeability ratios were calculated from the shift of the reversal potential (ΔVrev) of the I-V relationship when Na+ in the bath was completely substituted by another ion X according to
| (1) |
The Na+ dependence of conduction was described by fitting plots of slope conductance versus concentration to the equation
| (2) |
where Gmax and KNa are constants indicating the maximal conductance and the apparent Km for Na+, respectively.
Currents in the presence of guanidinium were analyzed according to the equation for enzyme kinetics describing two competitive substrates:
| (3) |
Online supplemental material
Online supplemental figures show normalized I-V relationships at different stages of activation/desensitization of ASIC1a channels (Fig. S1), I-V relationships with Na+ replaced by MgCl2, SrCl2, and BaCl2 (Fig. S2), and effects of 200 mM K+ on Na+ currents (Fig. S3). Online supplemental material is available at http://www.jgp.org/cgi/content/full/jgp.201411220/DC1.
RESULTS
Measurement of I-V relationships
Because ASICs activate and desensitize rapidly in response to an acid challenge, we first studied the permeation properties by holding the membrane potential at different values from −100 to 80 mV and challenging the oocytes with a solution with pH adjusted to 5 (Fig. 1 A). This protocol generated peak currents relative to baseline that were a nearly linear function of voltage and had a reversal potential of about 60 mV (Fig. 1 C). This value is close to the predicted reversal potential for Na+, assuming an intracellular free concentration of ∼9 mM (Palmer et al., 1978) and consistent with a high selectivity for Na+. Because this procedure was cumbersome, we devised a second method in which voltage ramps were applied continuously as the pH of the medium was changed from 7.4 to 5 (Fig. 1 B). Currents before the solution change were subtracted from those at the peak of the response to obtain an I-V relationship from a single acid challenge. This was almost identical to that obtained from the same oocyte using the first approach. The only measurable difference was a smaller outward current at the most positive membrane potentials (Fig. 1 C). Because our analysis of ASIC1 properties described below depends on inward currents and reversal potentials, we concluded that the ramp method could be used for this purpose. As a further control, we plotted results obtained from ramps applied before, during, and after the peak response. These currents, when normalized to the value at −100 mV, followed the same I-V relationship (Fig. S1). This indicates that the shape of this relationship is similar at different levels of activation and desensitization and does not depend on the precise timing of the ramp with respect to the response.
Figure 1.
I-V relationships of hASIC1a. (A) Repeated application of pH 5.0 medium (at arrow) to an oocyte clamped at −100 to 80 mV at 20-mV intervals. (B) Application of voltage ramps of 50-ms duration from −100 to 80 mV at 200-ms intervals before and during application of pH 5.0 medium. (C) Comparison of peak current versus voltage from A (red) with peak ramp response in B (black).
Selectivity for Na+ versus K+
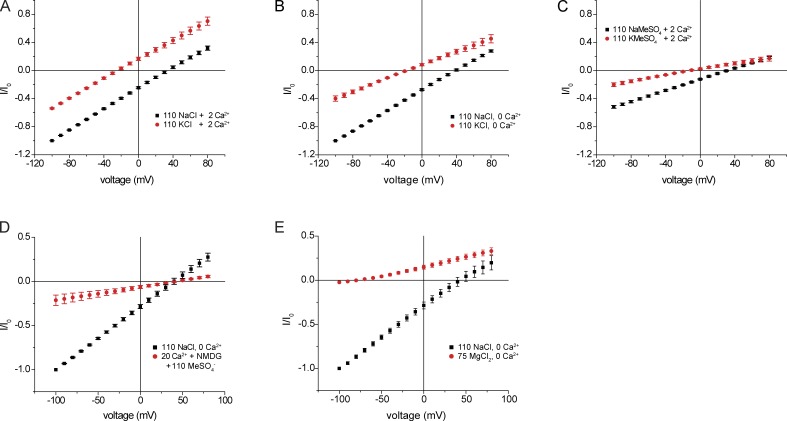
We next explored the effects of replacing extracellular Na+ with K+. This maneuver shifted the I-V relationship toward negative potentials, again consistent with selectivity of Na+ over K+. However, the slope conductance remained high and outward conductance increased, contrary to expectation for replacing external Na+ with a less-permeant cation. We tested the idea that these results could be effected by entry of Ca2+ into the cell through ASIC1 channels and activation of Cl− currents as proposed previously (Bässler et al., 2001). In the absence of extracellular Ca2+, replacing Na+ with K+ resulted in a decreased inward conductance, a shift in the reversal potential toward more negative voltages, and convergence of outward currents, as expected for replacement of Na+ with a less-permeant cation (Fig. 2 B). The reversal potential shifted by −58 mV, consistent with a PNa/PK of 10 (Eq. 1). Similar results were obtained in the absence of extracellular Cl−, with replacement by methanesulfonate (MeSO4−; Fig. 2 C). However, under these conditions, the absolute conductances for both Na+ and K+ decreased. A similar dependence of ASIC1 activity on Cl− was reported previously (Kusama et al., 2010).
Figure 2.
Effects of replacement of bath Na+ with K+. (A) Replacement of NaCl with KCl in the presence of 2 mM Ca2+. (B) Replacement of NaCl with KCl in the absence of Ca2+. (C) Replacement of NaMeSO4 with K MeSO4 in the presence of 2 mM Ca2+. (D) Replacement of NaCl with 20 mM Ca (MeSO4)2. (E) Replacement of NaCl with 75 mM MgCl2. In all cases, currents were normalized to values obtained at Vm = −100 mV with 110 mM NaCl (I0). Data represent means ± SEM for four to seven measurements.
Permeation of divalent cations
In an attempt to measure Ca2+ currents through the channels, we removed both Na+ and Cl− from the extracellular solution and lowered pH in the presence of 20 mM Ca2+ (as MeSO4− salt). This reduced conductance considerably. Small outward currents are presumably carried by K+ as well as unexchanged Na+ coming out of the cell. In addition, we measured inward currents with magnitudes ∼20% that of Na+ (Fig. 2 D). However, these currents may have been at least partly carried by the outward movement of residual Cl− remaining in the cell after the removal of extracellular Cl−. To examine this further, we replaced Na+ with 75 mM Mg2+, a divalent cation not known to activate Cl− channels. Under these conditions, we could not detect inward current, even in the presence of Cl− (Fig. 2 E). In contrast, large inward currents were obtained with Sr2+ and Ba2+, both of which can activate Cl− channels (Fig. S2; Yuan et al., 2013). These data suggest that either ASICs are highly selective for Ca2+ over Mg2+ or that the channels conduct all divalent cations at rates much slower than that of Na+. In either case, the finding that inward Ca2+ flux is inhibited in the presence of extracellular Na+ but not extracellular K+ indicates competition between Na+ and Ca2+ for a site within the conduction pathway.
Concentration dependence of conductance
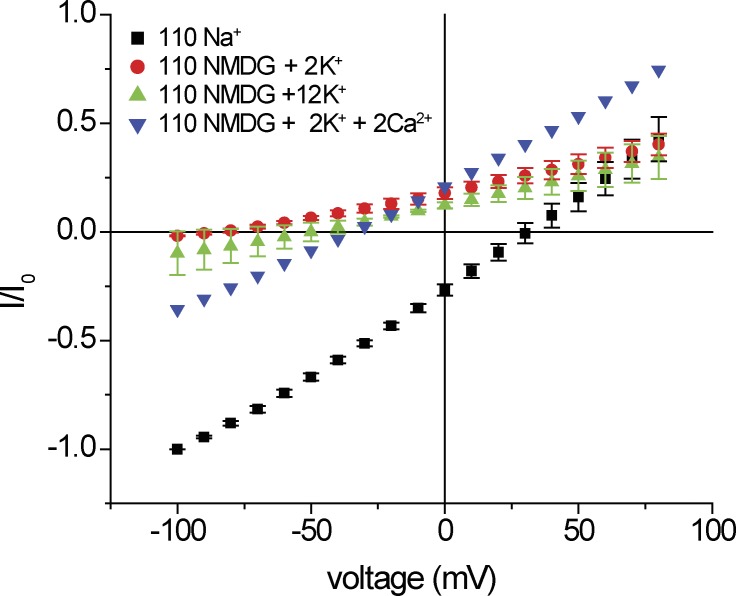
To explore this putative binding site further, we next studied the dependence of conduction on extracellular Na+ concentration, replacing Na+ with NMDG+, a large cation which we presume neither permeates nor blocks the channels. Complete substitution of Na+ with NMDG+ in the presence of Ca2+ resulted in significant inward currents and increased outward currents. As with K+ substitution, the simplest interpretation is that removal of Na+ increased Ca2+ entry, activating anion channels (Fig. 3) and stimulating both inward and outward Cl− currents. Consistent with this, substitution in the absence of Ca2+ abolished inward current, and outward currents converged at large positive voltages. The outward currents are likely to be carried by K+ moving out of the cell. To test this, we increased external K+ from 2 to 12 mM. As expected for a cation-selective conductance, this shifted the reversal potential to a less-negative voltage and induced a small inward conductance.
Figure 3.
Replacement of bath Na+ with NMDG+. Blue inverted triangles: [Ca2+] = 2 mM. Red circles: [Ca2+] = 0 mM. Green triangles: [Ca2+] = 0 mM with 10 mM K+ added. Currents were normalized to values obtained with 110 mM NaCl (black squares) at Vm = −100 mV (I0). Data represent means ± SEM for three to six measurements.
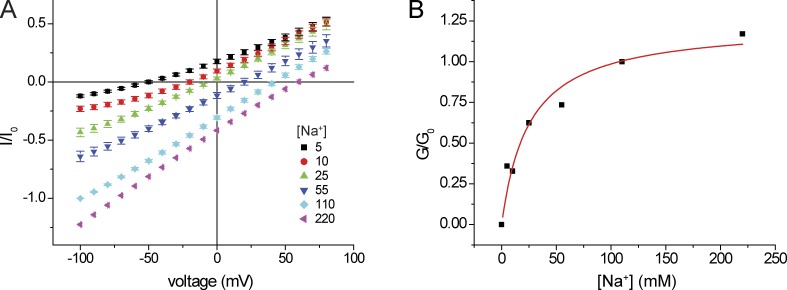
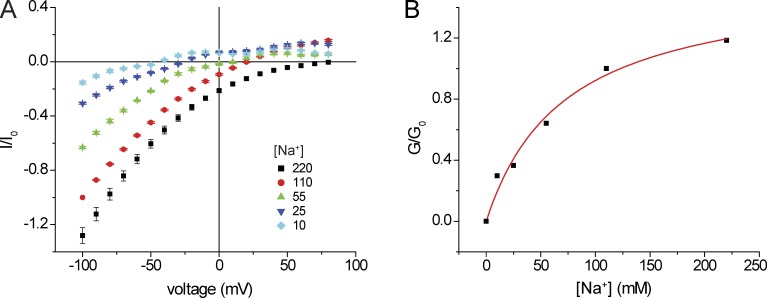
We then measured inward currents at different external Na+ (Fig. 4). At reduced [Na+]o, the I-V relationships were nonlinear. We therefore measured slope conductance over the most negative voltage range to minimize contributions of intracellular cations to the currents. In separate experiments we increased [Na+]o to 220 mM. In this case, we normalized the conductance to that obtained with 110 mM [Na+]o + 110 mM [NMDG+]o so as to compare the behavior at constant Cl−. We obtained a normalized conductance-concentration curve that saturates at high concentrations and is described by a hyperbolic function (Eq. 2) with an apparent Km for Na+ conductance of ∼25 mM. This is again consistent with a binding site for Na+ within the conduction pathway that can limit the rate of Na+ permeation, analogous to an enzyme–substrate complex that underlies Michaelis–Menten kinetics.
Figure 4.
Inward conductance as a function of external [Na+]. (A) I-V relationships in the presence of different [Na+] with replacement by NMDG+. All solutions were nominally Ca2+ free. Currents were normalized to values obtained at Vm = −100 mV with 110 mM NaCl. In the case of [Na+] = 220 mM, the currents were normalized to those obtained at Vm = −100 mV with 110 mM NaCl + 110 mM NMDG·Cl. Data represent means ± SEM for 5–11 measurements. (B) Inward slope conductance as a function of [Na+]. Slope conductances were normalized to values at 110 mM NaCl (G0) and were fit to the following equation: G/Gmax = [Na+]/{[Na+] + KNa}. Best-fit values were Gmax = 1.23 ± 0.12, KNa = 25 ± 8 mM.
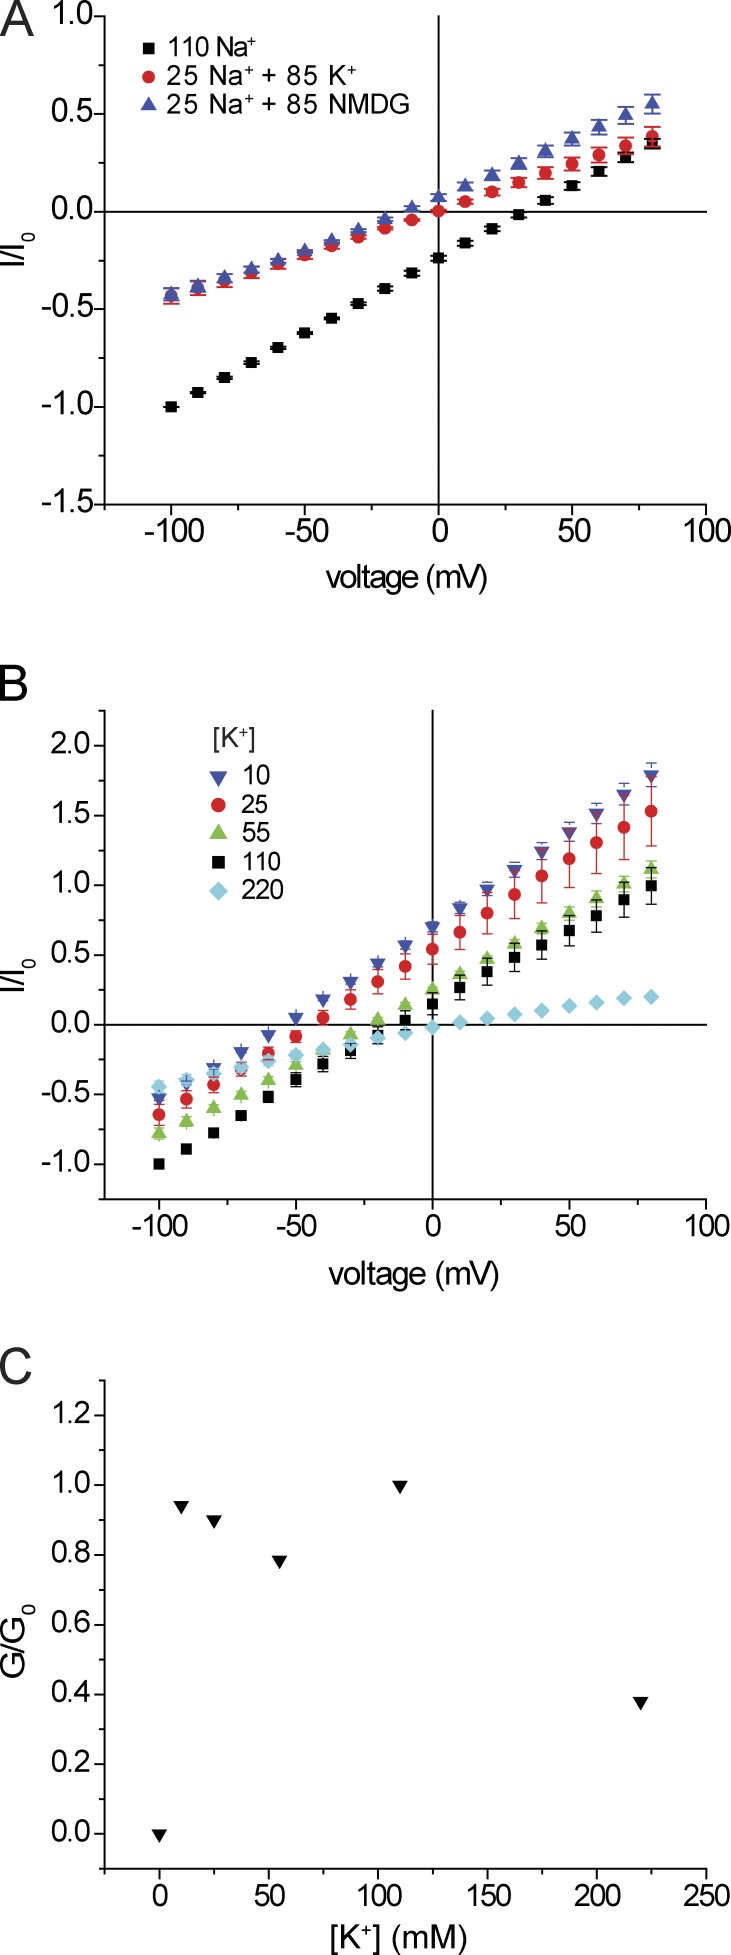
To test whether K+ can interact with this site, we examined the effect of raising external K+ on Na+ currents. Strong binding of K+ would displace Na+ from the site and possibly reduce Na+ currents. As shown in Fig. 5, addition of 85 mM K+ to a medium containing 25 mM Na+ shifted the reversal potential, as predicted for increasing permeant ion concentration, but did not affect inward currents at hyperpolarized potentials. The simplest interpretation is that under these conditions Na+ displaces K+ from a binding site within the pore and that both K+ conductance and K+ block of Na+ conductance are minimal under these conditions.
Figure 5.
Inward currents as a function of external [K+]. (A) I-V relationships with NaCl replaced with 25 mM NaCl + 85 mM NMDG·Cl (blue triangles) or with 25 mM NaCl + 85 mM KCl. All solutions were nominally Ca2+ free. Currents were normalized to values obtained at Vm = −100 mV with 110 mM NaCl (I0). Data represent means ± SEM for five measurements. (B) I-V relationships in the absence of Na+ and Ca2+ with [K+] = 10, 25, 50, 110, and 220 mM. Data represent means ± SEM for three to nine measurements. (C) Inward slope conductance as a function of [K+].
Permeation of K+ with weak interaction with the pore predicts that the apparent Km for K+ conduction should be higher than that for Na+ conduction. To test this idea, we measured ASIC1a inward currents while varying the external [K+], again substituting NMDG+. The results were complex. Inward currents were essentially constant between 10 and 110 mM [K+]o. However, outward currents and conductance decreased concomitantly. Furthermore, increasing [K+]o to 220 mM sharply inhibited both inward and outward currents (Fig. 5, B and C). As in Fig. 4, Na+ currents were not strongly affected by high K+. In the presence of 20 mM [Na+]o, increasing [K+]o to 200 mM decreased outward but not inward currents (Fig. S3). Thus, removal of Na+ apparently unmasks an inhibitory effect of external K+. The underlying mechanism was not investigated further. However, this effect complicates the interpretation of the concentration-conductance relationship for K+.
Selectivity for alkali metal cations
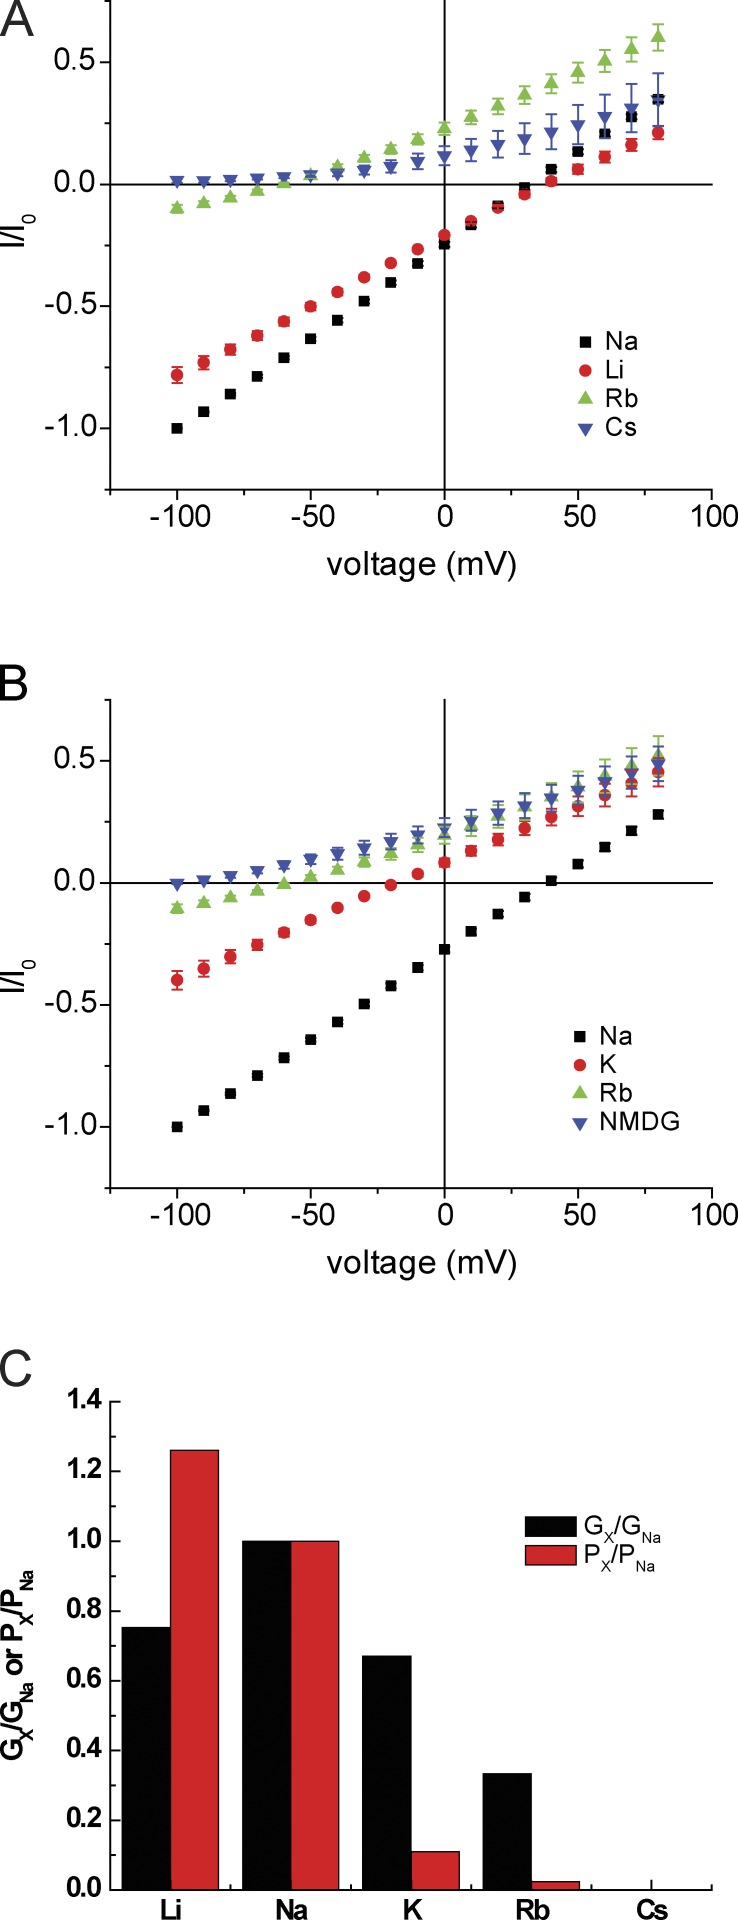
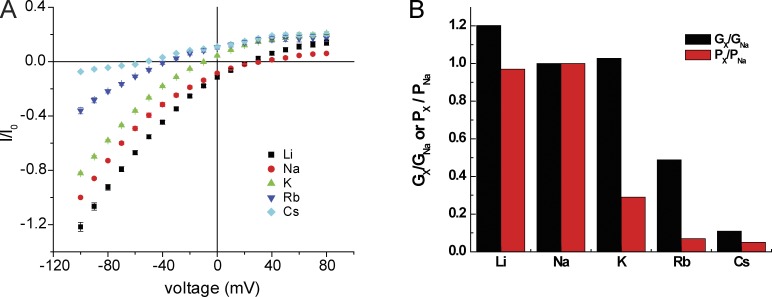
We next evaluated the ion selectivity of the ASIC1 pore for alkali metal cations measured as both conductance and permeability ratios. I-V relationships obtained by replacing extracellular Na+ with Li+, K+, Rb+, or Cs+ are shown in Fig. 6 (A and B). Exchanging Na+ for Li+ had only minor effects, shifting the reversal potential slightly to the right and decreasing conductance modestly. Substituting K+ shifted the reversal potential to the left and reduced conductance by ∼35%, similar to results shown in Fig. 2 B. Replacement with Rb+ shifted the reversal potential and reduced conductance further, whereas Cs+ substitution abolished inward currents. The selectivity ratios with respect to Na+ are plotted in Fig. 6 C. Permeability decreases as a function of atomic (i.e., unhydrated) size of the ion with a sharp cutoff at K+. Conductance is optimal for Na+ and decreases more gradually as atomic size increases.
Figure 6.
Monovalent alkali cation selectivity. (A) I-V relationships with NaCl replaced by LiCl, RbCl, or CsCl. All solutions were nominally Ca2+ free. (B) I-V relationships with Na+ replaced by KCl, RbCl, or NMDG·Cl in the absence of Ca2+. Currents were normalized to values obtained at Vm = −100 mV with 110 mM NaCl. Data represent means ± SEM for 5–13 measurements. (C) Values of Gx/GNa obtained from ratios of inward slope conductance in A and B. Values of Px/PNa were obtained from the shift in reversal potential in A and B.
Selectivity for nitrogen-based cations
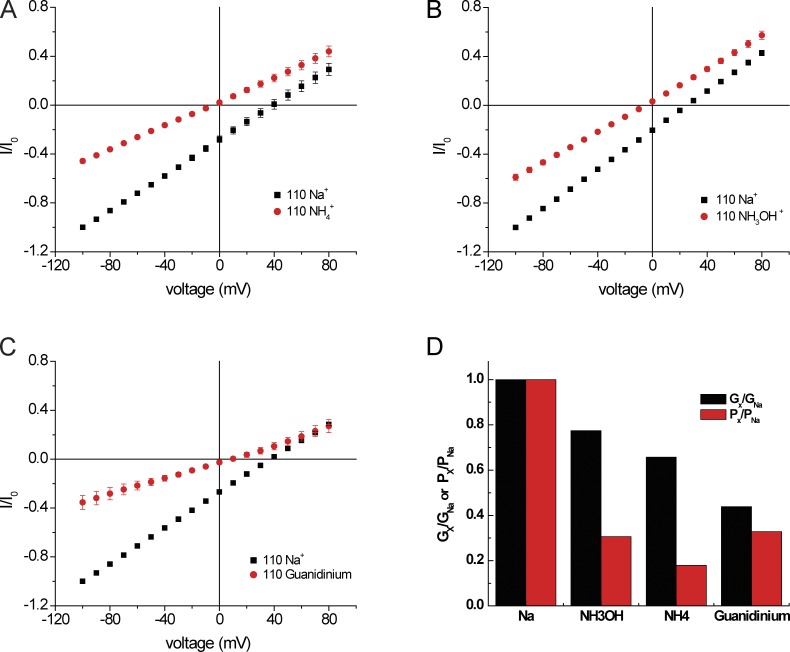
Selectivity of Na+ channels can also be characterized by permeation of nitrogen-based cations. Here there is a sharp contrast between voltage-gated Na channels, through which ions such as NH3OH+ and guanidinium+ can readily pass (Hille, 1971), and epithelial Na+ channels, which cannot conduct them (Palmer, 1982a). As ASICs are closely related to ENaC, it was of interest to examine their interactions with these cations. In the presence of NH4+, but not the other two ions, we observed a small increase in baseline conductance at pH 7.4 consistent with activation of the channels by NH4+, as previously reported (not depicted; Pidoplichko and Dani, 2006). As shown in Fig. 7, significant acid-induced inward conductances through ASIC1 were observed when Na+ was replaced by NH4+, NH3OH+, or guanidinium+. The magnitude of the baseline currents was <10% of that induced by low pH. Of these cations, NH3OH+ had the largest conductance, nearly 80% that of Na+, whereas guanidinium+ had a lower conductance (Gguan/GNa = 0.4). In contrast, permeability ratios for NH3OH+ and guanidinium+ relative to Na+ were similar.
Figure 7.
Selectivity for nitrogen-based cations. (A–C) I-V relationships with NaCl replaced by NH4Cl (A), NH3OH·Cl (B), or guanidinium·Cl (C). All solutions were nominally Ca2+ free. Currents were normalized to values obtained at Vm = −100 mV with 110 mM NaCl (I0). Data represent means ± SEM for 5–11 measurements. (D) Values of Gx/GNa obtained from ratios of inward slope conductance in A–C. Values of Px/PNa were obtained from the shift in reversal potential in A–C.
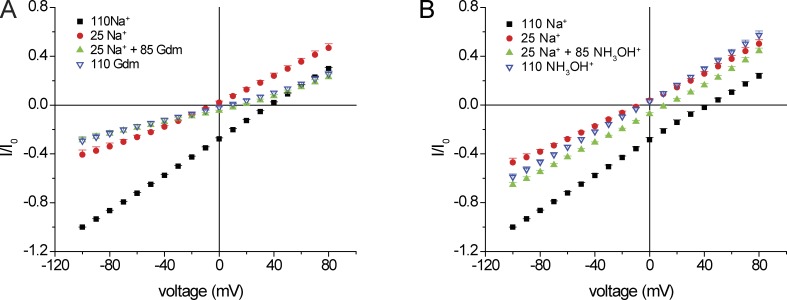
The differences between the conductance and permeability ratios of NH3OH+ and guanidinium+ could reflect different interactions with the pore. In particular, stronger binding of guanidinium+ within the permeation pathway could increase permeability by displacing other permeant cations but decrease conductance by slowing the off rate for ion exit from the pore into the cell. Fig. 8 A shows evidence that guanidinium+ can compete with Na+ with respect to permeation. Addition of 85 mM guanidinium+ to a solution containing 25 mM Na+ reduces inward current even though the total concentration of permeant ions increased. In fact, inward currents were similar with 25 mM Na+ + 85 mM guanidinium+ and with 110 mM guanidinium+, suggesting that under the former condition guanidinium+ dominates interactions with the pore by displacing Na+ from its binding site and acting as a partial agonist. Outward currents were also decreased, consistent with a partial blocking effect of guanidinium+. NH3OH+ did not exhibit these effects (Fig. 8 B).
Figure 8.
Block of Na+ currents by guanidinium+. (A) I-V relationships with 110 mM NaCl and with NaCl replaced by 25 mM NaCl + 85 mM NMDG·Cl or 25 mM NaCl + 85 mM guanidinium·Cl. All solutions were nominally Ca2+ free. Currents were normalized to values obtained at Vm = −100 mV with 110 mM NaCl (I0). Data represent means ± SEM for 3–10 measurements. (B) Similar to A with NH4OH·Cl replacing NaCl.
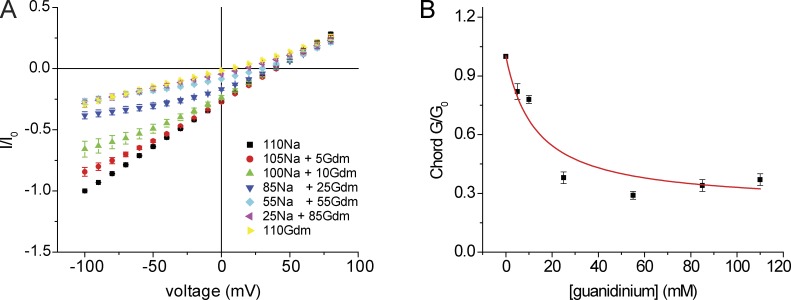
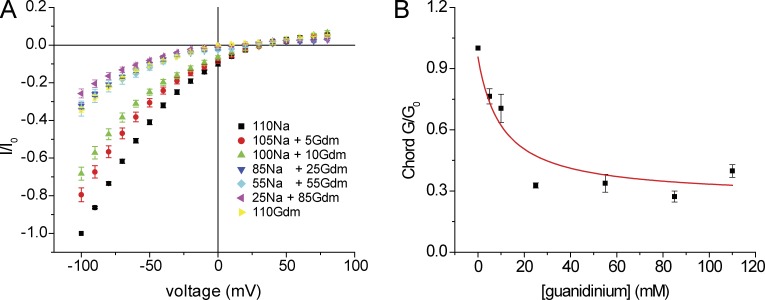
To further quantify this effect, we measured currents as a function of [guanidinium+] keeping [Na+] + [guanidinium+] constant at 110 mM. As shown in Fig. 9, 5 mM guanidinium+ is sufficient to reduce Na+ currents. At [guanidinium+] > 25 mM, the conductance was similar to that observed with pure 110 mM guanidinium+ solution, suggesting that guanidinium+ could displace Na+ at these concentrations. Guanidinium+ dependence of conductance was analyzed according to a simple competitive binding interaction (Eq. 3, Materials and methods). Assuming a Km for Na+ of 25 mM as measured above, the data for chord conductance were fit best with a Km for guanidinium+ of 2.2 mM. However, the fit was not very good, indicating that the actual interactions of the ions with pore and with each other may be more complex. Plotting slope conductances gave similar results, although in this case the conductance reached a minimum at [guanidinium+] = 25 mM (not depicted). This phenomenon was not explored further.
Figure 9.
Conductance and block of ASIC1 channels by guanidinium. (A) I-V relationships with NaCl replaced in part or in full by guanidinium·Cl, in the nominal absence of Ca2+. Currents were normalized to values obtained at Vm = −100 mV with 110 mM NaCl (I0). Data represent means ± SEM for 8–15 measurements. (B) Chord conductance as a function of [guanidinium+] at constant [Na+] + [guanidinium+]. Data represent means ± SEM for 5–15 measurements and were fit by Eq. 3 (see Materials and methods), which yielded a best fit values of Gguan,max = 0.33 and Kguan = 2.2 mM.
Role of an outer ion-binding site
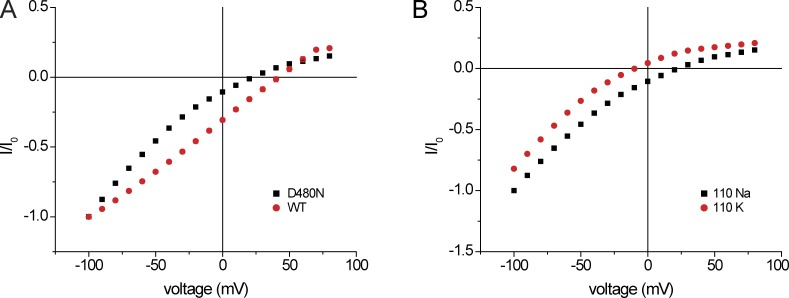
Analysis of the crystal structure of chicken ASIC1 revealed a cation-binding site in what appears to be the outer vestibule of the channel (Gonzales et al., 2009). The local electrostatic potential of this site should be highly negative as a result of the presence of three aspartate side chains from the amino acid corresponding to D434 in hASIC1. To evaluate the role of this site in the ion channel interactions described here, we examined the conductive properties of the D434N mutant, in which N was substituted for D to remove the negative charge but preserve the size and hydrophilic nature of the side chain. As shown in Fig. 10, the mutant is functional, although macroscopic currents were lower than for WT. Two major differences with the WT channel are evident from the figure. First, the reversal potential is shifted to the left, indicating an increase in the PK/PNa ratio. Second, the inward conductance is nonlinear, increasing with hyperpolarization.
Figure 10.
I-V relationships of WT hASIC and D434N mutant. (A) Comparison of WT and D434N. The bath contained 110 mM NaCl in the nominal absence of Ca2+. Currents were normalized to values obtained at Vm = −100 mV (I0). (B) Currents through the D434N mutant with 110 mM NaCl and 110 mM KCl in the nominal absence of Ca2+. Currents were normalized to values obtained at Vm = −100 mV (I0).
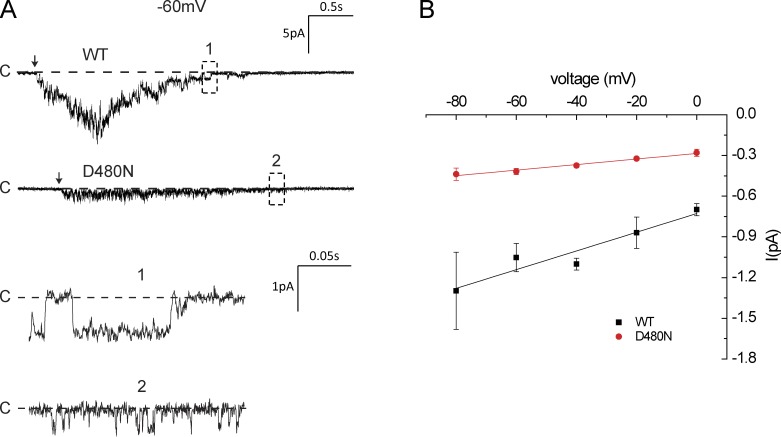
As the macroscopic current magnitude depends on expression levels, we compared the conductance of WT and D434N at the single-channel level using outside-out patches. This configuration allowed us to activate the channels by lowering the bath pH. In most cases, acidification of the bath to pH 5.0 resulted in the opening of many channels. Unitary currents were best measured after most of these channels had closed as a result of desensitization. For WT channels, these currents were well resolved and an I-V plot suggested a single-channel conductance of 7 pS (Fig. 11). This is in reasonable agreement with previous results (Zhang and Canessa, 2002; Paukert et al., 2004), assuming that the 3 mM extracellular Mg2+ used in our measurements caused a similar reduction in conductance as did Ca2+ (Paukert et al., 2004). Currents through the D434N channels were smaller and open times appeared to be shorter, making the openings more difficult to resolve; the single-channel conductance was estimated to be ∼2 pS. We did not detect any tendency for the single-channel conductance to increase with hyperpolarization. Thus, the nonlinearity of the macroscopic I-V relationship may result from effects of voltage on channel gating kinetics.
Figure 11.
hASIC currents in outside-out excised patches. The bath contained 110 mM NaCl. The pH was changed from 7.4 to 5.0 (arrows). Single-channel currents were measured when all but one of the activated channels had desensitized. (A) WT and D434 currents. (B) I-V relationships obtained from data as shown in A. Data represent means ± SEM for 3–15 observations.
If Na+ interacts strongly with the outer vestibule, the apparent affinity for the conductance mechanism might be increased by eliminating negative charge. To test this, we measured the conductance versus concentration dependence of the D434N channels. As shown in Fig. 12, inward currents still saturated in the mutant channels, although the estimated Km was 72 mM, higher than for the WT channel. Guanidinium+ reduced Na+ currents through the mutant channel, as it did in WT; the apparent Km for this cation based on Eq. 3 was 3.9 mM, slightly higher than that of WT (Fig. 13).
Figure 12.
Inward conductance as a function of external [Na+] for hASIC1a D434. (A) I-V relationships with different [Na+]. NMDG+ replaced Na+. Currents were normalized to values obtained at Vm = −100 mV with 110 mM NaCl (I0). In the case of [Na+] = 220 mM, the currents were normalized to those obtained at Vm = −100 mV with 110 mM NaCl + 110 mM NMDG·Cl. Data represent means ± SEM for four to five measurements. (B) Inward slope conductance as a function of [Na+]. Slope conductances were normalized to values at 110 mM NaCl (G0) and were fit to the equation G/Gmax = [Na+]/{[Na+] + KNa}. Best-fit values were Gmax = 1.58 and KNa = 72 mM.
Figure 13.
Conductance and block of hASIC1a D434N channels by guanidinium. (A) I-V relationships with NaCl replaced in part or in full by guanidinium·Cl, in the nominal absence of Ca2+. Currents were normalized to values obtained at Vm = −100 mV with 110 mM NaCl (I0). (B) Chord conductance as a function of [guanidinium+] at constant [Na+] + [guanidinium+]. Data were fit by Eq. 3 (see Materials and methods), which yielded best-fit values of Gguan,max = 0.34 and Kguan = 3.9 mM. (A and B) Data represent means ± SEM for 6–14 measurements.
Finally, we examined alkali metal cation selectivity in the D434 channels. As shown in Fig. 14, the selectivity sequences were qualitatively similar to those of the WT channel. Quantitatively, however, the selectivity of the mutant channels was shifted toward larger cations. K+ conductance was comparable with that of Na+, Rb+ conductance was significant, and Cs+ currents were measurable. In terms of permeability ratios, PK/PNa was about threefold higher in D434 than in WT, whereas PRb and PCs remained low.
Figure 14.
Monovalent alkali cation selectivity of hASIC1a D434. (A) I-V relationships with NaCl replaced by LiCl, KCl, RbCl, or CsCl in the nominal absence of Ca2+. Currents were normalized to values obtained at Vm = −100 mV with 110 mM NaCl (I0). Data represent means ± SEM for five to eight measurements. (B) Values of Gx/GNa obtained from ratios of chord conductances in A. Values of Px/PNa were obtained from the shift in reversal potential in A.
DISCUSSION
The main conclusions of this work are the following. (1) ASIC1 selectivity among alkali metal cations is revealed both as changes in reversal potential and conductance. Permeabilities based on reversal potential measurements decrease more rapidly than conductances as atomic size increases. Selectivity is accomplished at least in part through competition for a binding site within the pore. (2) Na+ conduction through the channels can be described by a Michaelis–Menten type reaction with an apparent Km for conduction of ∼25 mM. (3) Cations such as guanidinium+ that have diameters considerably larger than those of a dehydrated Na ion can pass through the ASIC1 pore. Guanidinium+ appears to interact with the pore more strongly than does Na+. (4) Negatively charged amino acid side chains in the outer vestibule of the channel affect conductance, selectivity, and the interactions of Na+ with the pore but are not essential for establishing the selectivity sequence.
Alkali metal cation selectivity
The basic properties of discrimination among these ions observed here are consistent with those reported previously. In particular, our value of PNa/PK = 9 is similar to that of 7.8 reported for rat ASIC1a by Bässler et al. (2001). Those authors found that Li had a slightly lower permeability than Na (PNa/PLi = 1.2), whereas we measured PNa/PLi = 0.8. In another study, Carattino and Della Vecchia (2012) reported a selectivity sequence of Na > Li > K > Rb > Cs based on the magnitude of acid-induced current at Vm = −60 mV. This measurement did not distinguish effects of reversal potentials and conductances, but the sequence compares well with that of conductance that we measured from I-V relationships.
A recently published structure of a toxin-stabilized open state of ASIC suggests that the narrowest part of the pore has a radius of 3.6 Å, large enough to admit a hydrated Na+ ion but small enough to exclude a hydrated K+ ion (Baconguis et al., 2014). Our results suggest that selectivity in these channels is not solely based on size but also on interactions with binding sites within the pore. The saturability of conductance with Na+ concentration is one indication of such interactions. We also found that the relative conductances for K+ and Rb+ versus Na+ were larger than the corresponding permeability ratios. A simple explanation for this is that Na+ binds more strongly to the selectivity filter of the channel, giving rise to small permeability ratios. However, in the absence of Na+, K+ and Rb+ ions can readily pass through the channels. The inability of external K+ to significantly reduce Na+ conductance also suggests strong binding of the latter ion.
Previous measurements of using flux ratio exponents through epithelial Na channels were consistent with single-ion occupancy (Palmer, 1982b; Benos et al., 1983). Consistent with this idea, the Na dependence of ASICa conductance is compatible with a single binding site with an apparent Km of ∼25 mM. The lower K+ conductance and lack of significant competition with Na+ suggest a weaker interaction with the pore. However, this simple scheme is unlikely to be able to explain the more complex behavior observed when [K+]o is changed in the absence of Na+. Further studies will be needed to understand the inhibitory effects of K+ observed under these conditions.
Divalent cation selectivity
Our results confirm previous findings of a finite Ca2+ permeability through ASIC1a (Bässler et al., 2001). This conclusion is based on indirect measurements of Cl− currents presumably activated by Ca2+ influx into the cell. Attempts to quantify divalent cation conductance were equivocal. Although we measured inward currents in the absence of Cl− with Ca2+ as the only significant charge-carrying cation in the extracellular medium, we could not rule out an efflux of residual cell Cl− as contributing to this current. Consistent with this notion, Mg2+, a smaller divalent cation which does not activate Cl− channels, did not carry a measurable current (Fig. 2). Thus, either the channels select strongly for Ca2+ over Mg2+ or they conduct both cations at rates too slow to measure as net inward current.
Nitrogen-based cation permeability
ENaC does not have a measurable conductance for nitrogen-based cations such as hydroxyammonium, hydrazinium, or guanidinium (Palmer, 1982a). In contrast, ASIC1 conducts both NH3OH+ and guanidinium+ as well as NH4+, at rates ranging from 40 to 80% that of Na+. In this regard, ASIC1 is more similar to voltage-gated Na+ channels, which are highly permeable to these cations (Hille, 1971) despite the lack of structural or evolutionary relationships between the channel families. The ability of these channels to conduct guanidinium+ is again consistent with the idea that the selectivity filter region of the ASIC pore is considerably wider than that of ENaC. In addition, guanidinium appears to interact strongly with an ion-binding site in the permeation pathway with an apparent Km of ∼2 mM. This interaction may underlie in part the blocking effects of amiloride on these channels (Waldmann et al., 1997).
In dopamine neurons from mouse midbrain, ASIC currents are activated by NH4+ at physiological pH (Pidoplichko and Dani, 2006). These channels were apparently ASIC1a based on toxin sensitivity. We observed an increase in baseline conductance at pH 7.4 in the presence of 110 mM NH4+. This increase was at least an order of magnitude smaller than the peak currents at low pH, unlike the currents observed in neurons. We do not know whether the differences reflect different channel types or behavior that depends on the physiological context.
Structural correlations
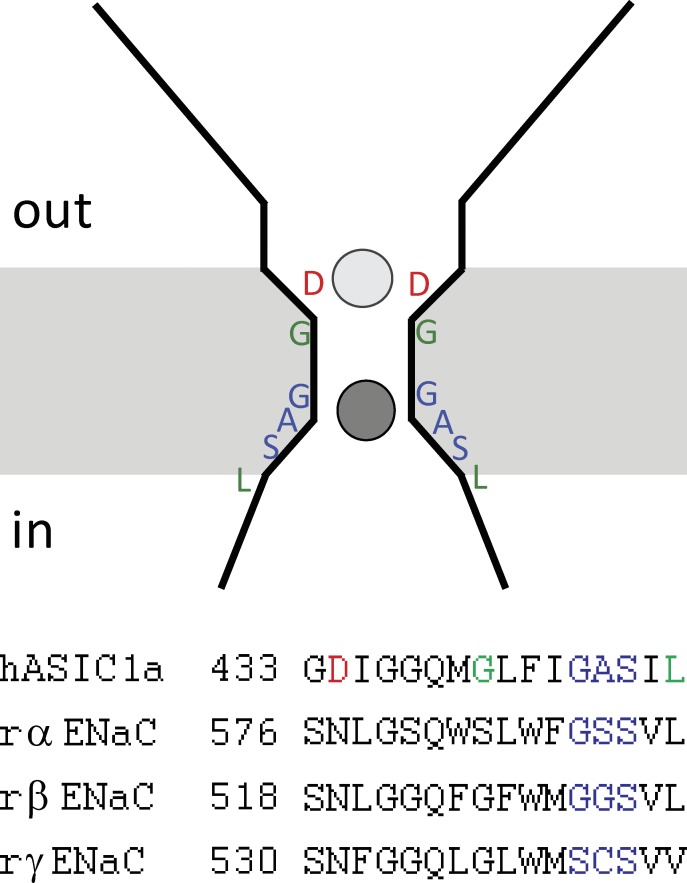
Two regions of the ASIC/ENaC proteins have been proposed to interact with cations during the permeation process. Mutations in residues in the second transmembrane domain alter the Na/K selectivity of both ASIC1 and ENaC. These include 587GSS in αENaC and 529GGS in βENaC (Kellenberger et al., 2001), which correspond to 491GAS in hASIC1a, and G438 and L446 in mASIC (Carattino and Della Vecchia, 2012), which correspond to G486 and L494 In hASIC1a (Fig. 15). This part of the channel is proposed to comprise the main selectivity filter (Kellenberger et al., 2001). Just extracellular to this region is a charged residue (D434 in hASIC1a) that is conserved in ASIC but not in ENaC channels. This aspartate lines the wall of an outer vestibule and coordinates Cs+ ions in the chicken ASIC1 crystal structure (Gonzales et al., 2009). This residue was shown to be important both for Ca2+ block of ASIC1 (Paukert et al., 2004) and for Ca2+ permeation in the less-selective Hydra Na+ channel HyNaC (Dürrnagel et al., 2012). These findings prompted us to study the impact of this residue on selectivity.
Figure 15.
Cartoon of the pore region. The negatively charged outer vestibule with the D434 residues interacts with ions as they pass through the channel (light gray circle). Removal of the negative charges reduces single-channel conductance, shifts selectivity, and decreases the apparent affinity of the conduction pathway for Na+. The ions interact more strongly with an inner binding site (dark gray circle) that confers selectivity.
We investigated the D434N mutation because N is a good noncharged analogue of D and also represents the corresponding amino acid in α-, β-, and γENaC (Fig. 15). The D434N mutant had reduced single-channel inward currents, as might be expected from a reduction in negative charge that could attract permeant ions to the outer vestibule. This amino acid substitution could contribute to the lower single-channel conductance of ENaC compared with ASIC under the same conditions.
In addition, the D434N mutation altered selectivity among monovalent cations. The selectivity sequence was the same as that of the WT channel, but the quantitative selectivity pattern shifted such that the mutant channels allowed larger ions to permeate. A similar decrease in the apparent PNa/PK ratio was reported for rat ASIC when the analogous D was substituted with C (Paukert et al., 2004). In contrast, Li et al. (2011) found no significant effect of mutating this residue on the selectivity, conductance, or Ca2+ block in lamprey ASIC1. Plotted as a function of atomic number, there is a sharp drop in permeability between Na+ and K+ in WT (to a ratio of 0.1). A similar drop occurs between K+ and Rb+ in the mutant. Both conductance and permeability to Cs+ were very small in WT but measurable in the mutant. The strength of interaction of Na+ with the pore was also altered, with the apparent Km for conduction increasing from 25 to 72 mM.
We interpret these results in terms of a permeation process requiring at least two steps. Accumulation of Na+ within the outer vestibule controls access to binding sites deeper within the pore. The increased apparent Km of the D434 mutant could reflect reduction in the local concentration of Na+ in the vestibule, lowering the effective on rate for access to the deeper sites. These sites presumably form the main selectivity filter, but the vestibule also contributes to ion discrimination in these channels.
Supplementary Material
Acknowledgments
We thank Cecilia Canessa for the kind gift of the hASIC1a plasmid and Henry Sackin for helpful comments on the manuscript.
This work was supported by grant DK27847 from the National Institutes of Health.
The authors declare no competing financial interests.
Haim Garty served as guest editor.
Footnotes
Abbreviation used in this paper:
- ASIC
- acid-sensing ion channel
References
- Baconguis, I., Bohlen C.J., Goehring A., Julius D., and Gouaux E.. 2014. X-ray structure of acid-sensing ion channel 1-snake toxin complex reveals open state of a Na+-selective channel. Cell. 156:717–729 10.1016/j.cell.2014.01.011 [DOI] [PMC free article] [PubMed] [Google Scholar]
- Bässler, E.L., Ngo-Anh T.J., Geisler H.S., Ruppersberg J.P., and Gründer S.. 2001. Molecular and functional characterization of acid-sensing ion channel (ASIC) 1b. J. Biol. Chem. 276:33782–33787 10.1074/jbc.M104030200 [DOI] [PubMed] [Google Scholar]
- Benos, D.J., Hyde B.A., and Latorre R.. 1983. Sodium flux ratio through the amiloride-sensitive entry pathway in frog skin. J. Gen. Physiol. 81:667–685 10.1085/jgp.81.5.667 [DOI] [PMC free article] [PubMed] [Google Scholar]
- Carattino, M.D., and Della Vecchia M.C.. 2012. Contribution of residues in second transmembrane domain of ASIC1a protein to ion selectivity. J. Biol. Chem. 287:12927–12934 10.1074/jbc.M111.329284 [DOI] [PMC free article] [PubMed] [Google Scholar]
- Dürrnagel, S., Falkenburger B.H., and Gründer S.. 2012. High Ca2+ permeability of a peptide-gated DEG/ENaC from Hydra. J. Gen. Physiol. 140:391–402 10.1085/jgp.201210798 [DOI] [PMC free article] [PubMed] [Google Scholar]
- Garty, H., and Palmer L.G.. 1997. Epithelial sodium channels: function, structure, and regulation. Physiol. Rev. 77:359–396 [DOI] [PubMed] [Google Scholar]
- Gonzales, E.B., Kawate T., and Gouaux E.. 2009. Pore architecture and ion sites in acid-sensing ion channels and P2X receptors. Nature. 460:599–604 10.1038/nature08218 [DOI] [PMC free article] [PubMed] [Google Scholar]
- Hille, B.1971. The permeability of the sodium channel to organic cations in myelinated nerve. J. Gen. Physiol. 58:599–619 10.1085/jgp.58.6.599 [DOI] [PMC free article] [PubMed] [Google Scholar]
- Kellenberger, S., and Schild L.. 2002. Epithelial sodium channel/degenerin family of ion channels: a variety of functions for a shared structure. Physiol. Rev. 82:735–767 [DOI] [PubMed] [Google Scholar]
- Kellenberger, S., Auberson M., Gautschi I., Schneeberger E., and Schild L.. 2001. Permeability properties of ENaC selectivity filter mutants. J. Gen. Physiol. 118:679–692 10.1085/jgp.118.6.679 [DOI] [PMC free article] [PubMed] [Google Scholar]
- Kusama, N., Harding A.M., and Benson C.J.. 2010. Extracellular chloride modulates the desensitization kinetics of acid-sensing ion channel 1a (ASIC1a). J. Biol. Chem. 285:17425–17431 10.1074/jbc.M109.091561 [DOI] [PMC free article] [PubMed] [Google Scholar]
- Li, T., Yang Y., and Canessa C.M.. 2011. Asp433 in the closing gate of ASIC1 determines stability of the open state without changing properties of the selectivity filter or Ca2+ block. J. Gen. Physiol. 137:289–297 10.1085/jgp.201010576 [DOI] [PMC free article] [PubMed] [Google Scholar]
- Li, T., Yang Y., and Canessa C.M.. 2012. Impact of recovery from desensitization on acid-sensing ion channel-1a (ASIC1a) current and response to high frequency stimulation. J. Biol. Chem. 287:40680–40689 10.1074/jbc.M112.418400 [DOI] [PMC free article] [PubMed] [Google Scholar]
- Palmer, L.G.1982a. Ion selectivity of the apical membrane Na channel in the toad urinary bladder. J. Membr. Biol. 67:91–98 10.1007/BF01868651 [DOI] [PubMed] [Google Scholar]
- Palmer, L.G.1982b. Na+ transport and flux ratio through apical Na+ channels in toad bladder. Nature. 297:688–689 10.1038/297688a0 [DOI] [PubMed] [Google Scholar]
- Palmer, L.G.1987. Ion selectivity of epithelial Na channels. J. Membr. Biol. 96:97–106 10.1007/BF01869236 [DOI] [PubMed] [Google Scholar]
- Palmer, L.G., Century T.J., and Civan M.M.. 1978. Activity coefficients of intracellular Na+ and K+ during development of frog oocytes. J. Membr. Biol. 40:25–38 10.1007/BF01909737 [DOI] [PubMed] [Google Scholar]
- Paukert, M., Babini E., Pusch M., and Gründer S.. 2004. Identification of the Ca2+ blocking site of acid-sensing ion channel (ASIC) 1: Implications for channel gating. J. Gen. Physiol. 124:383–394 10.1085/jgp.200308973 [DOI] [PMC free article] [PubMed] [Google Scholar]
- Pidoplichko, V.I., and Dani J.A.. 2006. Acid-sensitive ionic channels in midbrain dopamine neurons are sensitive to ammonium, which may contribute to hyperammonemia damage. Proc. Natl. Acad. Sci. USA. 103:11376–11380 10.1073/pnas.0600768103 [DOI] [PMC free article] [PubMed] [Google Scholar]
- Schmitt, B.M., and Koepsell H.. 2002. An improved method for real-time monitoring of membrane capacitance in Xenopus laevis oocytes. Biophys. J. 82:1345–1357 10.1016/S0006-3495(02)75490-8 [DOI] [PMC free article] [PubMed] [Google Scholar]
- Waldmann, R., Champigny G., Bassilana F., Heurteaux C., and Lazdunski M.. 1997. A proton-gated cation channel involved in acid-sensing. Nature. 386:173–177 10.1038/386173a0 [DOI] [PubMed] [Google Scholar]
- Yuan, H., Gao C., Chen Y., Jia M., Geng J., Zhang H., Zhan Y., Boland L.M., and An H.. 2013. Divalent cations modulate TMEM16A calcium-activated chloride channels by a common mechanism. J. Membr. Biol. 246:893–902 10.1007/s00232-013-9589-9 [DOI] [PubMed] [Google Scholar]
- Zhang, P., and Canessa C.M.. 2002. Single channel properties of rat acid-sensitive ion channel-1α, -2a, and -3 expressed in Xenopus oocytes. J. Gen. Physiol. 120:553–566 10.1085/jgp.20028574 [DOI] [PMC free article] [PubMed] [Google Scholar]
Associated Data
This section collects any data citations, data availability statements, or supplementary materials included in this article.


