

Abstract
Purpose
The aim of this study was to evaluate the potential of 18F-fluorothymidine (FLT) PET/CT for imaging pancreatic adenocarcinoma.
Methods
This was a pilot study of five patients (four males, one female) with newly diagnosed and previously untreated pancreatic adenocarcinoma. Patients underwent FLT PET/CT, 18F-fluorodeoxyglucose (FDG) PET/CT, and contrast-enhanced CT scanning before treatment. The presence of cancer was confirmed by histopathological analysis at the time of scanning in all five patients. The degree of FLT and FDG uptake at the primary tumor site was assessed using visual interpretation and semi-quantitative SUV analyses.
Results
The primary tumor size ranged from 2.5×2.8 cm to 3.5×7.0 cm. The SUV of FLT uptake within the primary tumor ranged from 2.1 to 3.1. Using visual interpretation, the primary cancer could be detected from background activity in two of five patients (40%) on FLT PET/CT. By comparison, FDG uptake was higher in each patient with a SUV range of 3.4 to 10.8, and the primary cancer could be detected from background in all five patients (100%).
Conclusions
In this pilot study of five patients with primary pancreatic adenocarcinoma, FLT PET/CT scanning showed poor lesion detectability and relatively low levels of radiotracer uptake in the primary tumor.
Keywords: FLT PET, FDG PET, PET/CT, Pancreatic cancer, Oncology
Introduction
18F-fluorothymidine (FLT) has been proposed as a promising new positron emitting radiopharmaceutical that can be used adjunctively to 18F-fluorodeoxyglucose (FDG) for positron emission tomography (PET). While FDG PET evaluates glucose metabolism, FLT PET assesses the proportion of cells undergoing active proliferation.
Because changes in cellular proliferation within a tumor can occur before a change in glucose metabolism or the size of the lesion, several research groups have postulated that FLT PET imaging might be a more accurate means for monitoring response to therapy than conventional imaging or FDG PET [1, 2]. However, recent clinical studies in high-grade non-Hodgkin's lymphoma, breast cancer, and rectal cancer [3–5] have shown mixed success and suggest that the utility of FLT PET for this application is dependent on tumor type. A commonly described pitfall is that the degree of FLT uptake is often low, thus limiting the usefulness of FLT PET in these tumor types [4].
Using an in vitro model, Seitz et al.[6] demonstrated FLT uptake in SW-979 and BxPc-3 pancreatic cancer cell lines, predicting that pancreatic cancer may be clinically imaged using FLT PET. To date, there has been no published data describing the use of FLT PET in clinical patients.
The aim of this study was to evaluate the potential of FLT PET/CT for imaging pancreatic adenocarcinoma by assessing the intensity of radiotracer uptake and detectability of the primary tumor and to compare these with FDG PET/CT images.
Materials and methods
The study was performed with prior approval from the Investigational Review Board (IRB) at Stanford University Medical Center.
Patient population
Five patients (four males, one female; 67–85 years old, mean 77.4) who were newly diagnosed with unresectable pancreatic cancer and who consented to FLT PET/CT and FDG PET/CT scanning were prospectively enrolled in the study (Table 1). The diagnosis of pancreatic adenocarcinoma was confirmed in each case by histopathological analysis obtained either by bile duct brushing (one patient), fine needle aspiration (three patients), or laparotomy (one patient). All scanning was performed before any therapeutic intervention.
Table 1. Results of FLT PET/CT and FDG PET/CT, and contrast-enhanced CT scanning and protocol data.
| Patient | Age/Gender | Size by contrast enhanced CT (cm) | FDG PET (visual) |
FLT PET (visual) |
FDG PET (SUV) | FLT PET (SUV) | Biopsy result (method) | FDG dose | FDG uptake time | FLT dose | FLT uptake time |
|---|---|---|---|---|---|---|---|---|---|---|---|
| 1 | 85 F | 2.5×2.8 | + | + | 4.9 | 3.1 | Adeno CA (bile duct brushing) | 11.6 mCi | 73 m | 6.9 mCi | 40 m |
| 2 | 76 M | 3.5×7.0 | + | − | 8.6 | 2.1 | Adeno CA (FNA) | 15.1 mCi | 57 m | 7.0 mCi | 78 m |
| 3 | 75 M | 2.6×6.3 | + | − | 3.4 | 2.8 | Mod diff adeno CA and pancreatitis (Laparotomy) | 15.1 mCi | 67 m | 5.23 mCi | 57 m |
| 4 | 84 M | 3.2×3.5 | + | + | 10.8 | 2.9 | Adeno CA (FNA) | 12.2 mCi | 62 m | 6.7 mCi | 40 m |
| 5 | 67 M | 2.5×4.5 | + | − | 8.6 | 2.1 | Adeno CA (FNA) | 19.1 mCi | 56 m | 7.0 mCi | 52 m |
F female, M male, + primary lesion detectable by visual interpretation, – primary lesion not detectable by visual interpretation, SUVstandardized uptake value, Adeno CAPancreatic adenocarcinoma, Mod Diff Adeno CA moderately differentiated adenocarcinoma, FNA fine-needle aspiration, m minutes
Scanning
18F-fluorothymidine was synthesized as previously described [7]. The tracer dose ranged from 5.23 to 7.0 mCi. Patients did not have any dietary restriction before FLT injection. Acquisition of images commenced at 40 to 78 min after the injection of tracer, with total acquisition time ranging from 30 to 35 min, depending on the height of the patient.
Unit doses of FDG were supplied by PETNET Solutions (Palo Alto, CA, USA). The tracer dose of FDG ranged from 11.6 to 19.1 mCi. All patients fasted for greater than 8 h before imaging. Acquisition of images commenced at 56 to 73 min after injection of tracer with acquisition time ranging from 30 to 35 min, depending on the height of the patient.
For both FLT and FDG PET/CT, all patients were scanned on either a GE Discovery LS PET/CT scanner or GE Discovery ST PET/CT (GE Medical Systems, Waukesha, WI, USA). PET images were acquired using 2D mode, 6–7 bed positions, 5-min duration each bed position, scanning from mid-skull to mid-thighs. A non-contrast CT was performed concomitantly with each PET acquisition for anatomical localization and attenuation correction. PET, fusion PET/CT, and CT images were displayed in 4.25-mm slices.
With the exception of patient 1 (Table 1), FLT and FDG PET/CT scanning was performed within 5 days of each other, with FLT performed first in patient 2 and FDG performed first in patients 3–5. In patient 1, the FDG PET/CT was performed 33 days after FLT PET/CT because of scheduling conflicts.
A contrast-enhanced CT was performed in addition to the above-described PET/CT for each patient. Patients 1, 2, and 5 (Table 1) underwent contrast-enhanced CT imaging at another medical facility and the images were reviewed from a DICOM compact disc provided by the patient. For patients 3 and 4 (Table 1), the contrast-enhanced CT images were acquired at Stanford on a Siemens Somatom Sensation 64 (Siemens Medical Solutions USA Inc., Malvern, PA, USA) and on a GE Lightspeed 16 (GE Medical Systems, WI, USA). In patients 1, 2, 4, and 5, contrast-enhanced CT images were performed within 4 weeks before FLT PET/CT scanning. In patient 3, contrast-enhanced CT was performed 4 weeks after FLT PET/CT.
Image analysis
A board-certified Radiologist specialized in abdominal imaging recorded bi-dimensional measurements of the primary pancreatic tumor judged from transaxial slices on contrast-enhanced CT images.
All FLT and FDG PET/CT images were reviewed by a board-certified Nuclear Medicine physician who is experienced in PET interpretation. Contrast-enhanced abdominal CT, non-contrast enhanced CT (performed in conjunction with PET imaging), attenuation-corrected PET, and fusion PET/CT images were available and reviewed simultaneously for each patient.
Visual interpretation of the primary cancer site was based on three primary factors: (1) intensity and (2) focality of radiotracer uptake and (3) whether the lesion could be adequately discriminated from background activity in the surrounding tissue. Primary lesion detectability was graded on a simple binary scale as either + (tumor was detectable) or − (tumor not detectable).
Semi-quantitative SUV analysis involved drawing a region of interest (ROI) at the most intense portion of the tumor and measuring the standardized uptake value (SUV) [8]. If the tumor was not easily distinguishable on FLT or FDG PET/CT alone, then the contrast-enhanced CT was used to help localize and draw a suitable ROI at the tumor site.
Results
The bi-dimensional sizes of the primary lesions as measured from contrast-enhanced CT are listed on Table 1. The smallest lesion measured 2.5×2.8 cm and the largest measured 3.5×7.0 cm.
The SUV for FLT uptake at the primary tumor ranged from 2.1 to 3.1 (Table 1). By visual interpretative criteria, the primary lesion was distinguishable in 2 of 5 cases (40%). However, in all cases, correlation with fusion PET/CT was absolutely necessary for identification of either the cancer or the tumor bed. This was because lesion detectability was hampered not only by relatively low FLT uptake at the primary site, but also because of prominent tracer uptake in adjacent bowel and stomach (Fig. 1). In patient 5, the cancer was photopenic relative to adjacent bowel and was very difficult to identify even with the aid of fusion PET/CT and a correlative contrast-enhanced CT. Representative images from all five patients are shown in Fig. 2.
Fig. 1.

Background abdominal activity on FLT PET (top row) and PET/CT fusion (bottom row) from patient 3. Primary pancreatic tumor was difficult to distinguish from physiologic activity because of the combination of modest FLT radiotracer uptake in the cancer (red arrow) and prominent background activity in bowel (green arrows)
Fig. 2.
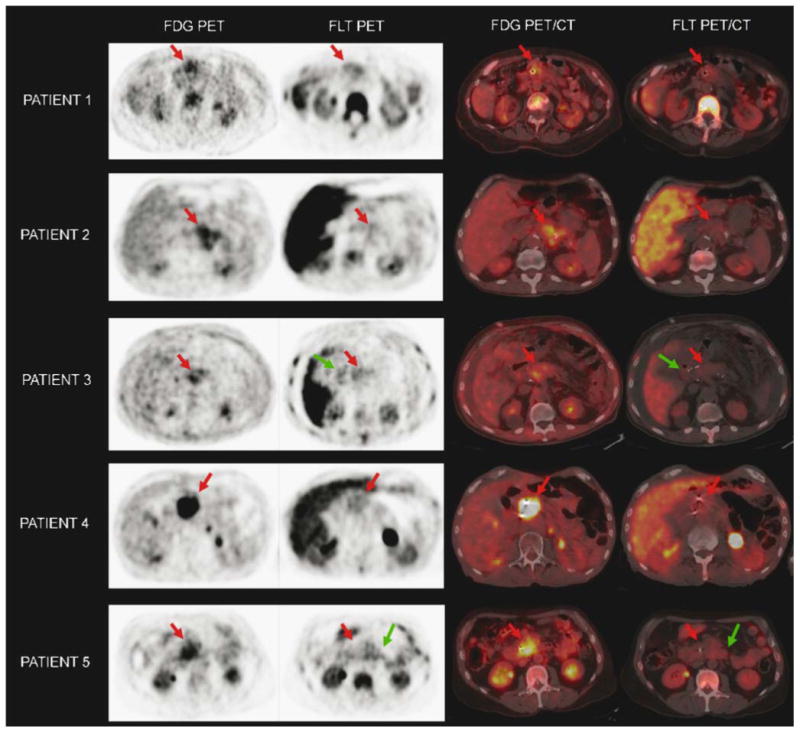
Visual comparison of FDG PET/CT and FLT PET/CT in all five patients. The tumor bed is highlighted by a red arrow in each image. Problematic bowel activity was frequently seen on FLT PET/CT, highlighted by the green arrows
FDG uptake was higher than FLT in each patient and the SUV ranged from 3.4 to 10.8 (Table 1). The lowest SUV was noted in patient 3. The primary lesion was detectable in 5 of 5 cases (100%) by visual interpretation. Further, correlation with fusion PET/CT images was necessary in only patient 3 for identification of the primary cancer. The cancer was otherwise easily detectable on attenuation corrected PET images alone in patients 1, 2, 4, and 5.
Discussion
In these selected patients with locally advanced and relatively large primary pancreatic tumors, FLT exhibited low levels of tumor uptake. Tracer activity in the primary tumor could be differentiated from background tracer activity in only patients 1 and 4 (Fig. 2). All patients required careful correlation to fusion PET/CT to identify the tumor bed and primary cancer site. The findings of this pilot study suggest that FLT PET/CT is not useful for diagnosing pancreatic adenocarcinoma and would likely serve as a poor baseline scan for subsequent follow-up imaging when monitoring therapy.
By comparison, FDG PET/CT exhibited better tracer uptake in all patients and primary lesions were distinguishable from surrounding tissue in all patients. However, FDG uptake was variable with the lowest tracer uptake seen in one of the largest tumors (patient 3, Table 1). This was possibly due to the histology of the cancer being a moderately differentiated adenocarcinoma. Prior authors have described the potential utility and pitfalls of characterizing primary pancreatic cancer using FDG PET [9, 10] describing mixed success in various clinical scenarios. The highly selected patient population in this study precludes any analysis of the ability of FDG PET to detect, characterize, and stage pancreatic adenocarcinoma. However, the findings do suggest that in locally advanced unresectable disease, FDG PET/CT may have some potential to serve as a baseline scan for follow-up imaging.
Our study does not attempt to elucidate the mechanism of poor FLT uptake in pancreatic adenocarcinoma, but several salient factors should be considered. FLT transport and uptake is not entirely dependent on the activity of thymidine kinase 1 (TK1) alone, but ATP may also act as an important cofactor [11, 12]. The primary cancers in this study were all of moderate size or greater, and there may have been a paucity of available ATP leading to suboptimal modulation of TK1. Further, FLT follows biphasic tracer kinetics with rapid initial cellular accumulation followed by a slower phase, during which efflux of FLT may predominate [13]. All FLT PET/CT scans in this study were performed at a single delayed time point after injection of radiotracer that may not have coincided with the plateau of FLT accumulation.
Conclusion
In this pilot study of five patients with advanced primary pancreatic adenocarcinoma, FLT PET/CT scanning showed poor lesion detectability and relatively low levels of radiotracer uptake in the primary tumor. The findings suggest that FLT PET/CT is not promising for primary detection or characterization of pancreatic adenocarcinoma and may serve as a poor baseline scan for subsequent follow-up imaging when monitoring therapy.
Acknowledgments
Manuscript editor: I. Ross McDougall, Andrei H. Iagaru; radiotracer synthesis: Murugesan Subbarayan.
The study was funded in part by The Stanford University Office of Technology Licensing.
Footnotes
Conflict of interest statement: The authors have no conflicts of interest to report.
Contributor Information
A. Quon, Email: aquon@stanford.edu, Department of Radiology and Molecular Imaging Program at Stanford (MIPS), Stanford University Medical Center, 300 Pasteur Drive, Room H-0101, Stanford, CA 94305, USA.
S. T. Chang, Department of Radiation Oncology, Stanford University Medical Center, 268 Campus Drive, Room 1245, Stanford, CA, USA
F. Chin, Department of Radiology and Molecular Imaging Program at Stanford (MIPS), Stanford University Medical Center, 300 Pasteur Drive, Room H-0101, Stanford, CA 94305, USA
A. Kamaya, Department of Radiology and Molecular Imaging Program at Stanford (MIPS), Stanford University Medical Center, 300 Pasteur Drive, Room H-0101, Stanford, CA 94305, USA
D. W. Dick, Department of Radiology and Molecular Imaging Program at Stanford (MIPS), Stanford University Medical Center, 300 Pasteur Drive, Room H-0101, Stanford, CA 94305, USA
B. W. Loo, Jr., Department of Radiation Oncology, Stanford University Medical Center, 268 Campus Drive, Room 1245, Stanford, CA, USA
S. S. Gambhir, Department of Radiology and Molecular Imaging Program at Stanford (MIPS), Stanford University Medical Center, 300 Pasteur Drive, Room H-0101, Stanford, CA 94305, USA
A. C. Koong, Email: akoong@stanford.edu, Department of Radiation Oncology, Stanford University Medical Center, 268 Campus Drive, Room 1245, Stanford, CA, USA.
References
- 1.Shields AF. PET imaging with 18F-FLT and thymidine analogs: promise and pitfalls. J Nucl Med Sep. 2003;44(9):1432–4. [PubMed] [Google Scholar]
- 2.Buck AK, Halter G, Schirrmeister H, et al. Imaging proliferation in lung tumors with PET: 18F-FLT versus 18F-FDG. J Nucl Med. 2003 Sep;44(9):1426–31. [PubMed] [Google Scholar]
- 3.Herrmann K, Wieder HA, Buck AK, et al. Early response assessment using 3′-deoxy-3′-[18F]fluorothymidine-positron emission tomography in high-grade non-Hodgkin's lymphoma. Clin Cancer Res. 2007;13(12):3552–8. doi: 10.1158/1078-0432.CCR-06-3025. [DOI] [PubMed] [Google Scholar]
- 4.Pio BS, Park CK, Pietras R, et al. Usefulness of 3′-[F-18]fluoro-3′-deoxythymidine with positron emission tomography in predicting breast cancer response to therapy. Mol Imaging Biol. 2006;8(1):36–42. doi: 10.1007/s11307-005-0029-9. [DOI] [PubMed] [Google Scholar]
- 5.Wieder HA, Geinitz H, Rosenberg R, et al. PET imaging with [(18)F]3′-deoxy-3′-fluorothymidine for prediction of response to neoadjuvant treatment in patients with rectal cancer. Eur J Nucl Med Mol Imaging. 2007;34(6):878–83. doi: 10.1007/s00259-006-0292-2. [DOI] [PubMed] [Google Scholar]
- 6.Seitz U, Wagner M, Neumaier B, et al. Evaluation of pyrimidine metabolising enzymes and in vitro uptake of 3′-[(18)F]fluoro-3′-deoxythymidine ([(18)F]FLT) in pancreatic cancer cell lines. Eur J Nucl Med Mol Imaging. 2002;29(9):1174–81. doi: 10.1007/s00259-002-0851-0. [DOI] [PubMed] [Google Scholar]
- 7.Machulla HJ, Blocher A, Kuntzsch M, Piert M, Wei R, Grierson JR. Simplified labeling approach for synthesizing 3′-Deoxy-3′-[18F] fluorothymidine ([18F]FLT) J Radioanal Nucl Chem. 2000;243(3):843–6. [Google Scholar]
- 8.Strauss LG, Conti PS. The applications of PET in clinical oncology. J Nucl Med. 1991;32(4):623–48. discussion 649–650. [PubMed] [Google Scholar]
- 9.Higashi T, Saga T, Nakamoto Y, et al. Diagnosis of pancreatic cancer using fluorine-18 fluorodeoxyglucose positron emission tomography (FDG PET)—usefulness and limitations in “clinical reality”. Ann Nucl Med. 2003;17(4):261–79. doi: 10.1007/BF02988521. [DOI] [PubMed] [Google Scholar]
- 10.van Kouwen MC, Jansen JB, van Goor H, de Castro S, Oyen WJ, Drenth JP. FDG-PET is able to detect pancreatic carcinoma in chronic pancreatitis. Ann Nucl Med. 2005;32(4):399–404. doi: 10.1007/s00259-004-1689-4. [DOI] [PubMed] [Google Scholar]
- 11.Munch-Petersen B, Cloos L, Jensen HK, Tyrsted G. Human thymidine kinase 1 regulation in normal and malignant cells. Adv Enzyme Regul. 1995;35:69–89. doi: 10.1016/0065-2571(94)00014-t. [DOI] [PubMed] [Google Scholar]
- 12.Barthel H, Perumal M, Latigo J, et al. The uptake of 3′-deoxy-3′-[18F]fluorothymidine into L5178Y tumours in vivo is dependent on thymidine kinase 1 protein levels. Eur J Nucl Med Mol Imaging. 2005;32(3):257–63. doi: 10.1007/s00259-004-1611-0. [DOI] [PubMed] [Google Scholar]
- 13.Grierson JR, Schwartz JL, Muzi M, Jordan R, Krohn KA. Metabolism of 3′-deoxy-3′-[F-18]fluorothymidine in proliferating A549 cells: validations for positron emission tomography. Nucl Med Biology. 2004;31(7):829–37. doi: 10.1016/j.nucmedbio.2004.06.004. [DOI] [PubMed] [Google Scholar]