

Abstract
Methyl-mercury (MeHg) is a potent neuroendocrine disruptor that impairs reproductive processes in fish. The objectives of this study were to (1) characterize transcriptomic changes induced by MeHg exposure in the female largemouth bass (LMB) hypothalamus under controlled laboratory conditions, (2) investigate the health and reproductive impacts of MeHg exposure on male and female largemouth bass (LMB) in the natural environment, and (3) identify MeHg-associated gene expression patterns in whole brain of female LMB from MeHg-contaminated habitats. The laboratory experiment was a single injection of 2.5 μg MeHg/g body weight for 96 h exposure. The field survey compared river systems in Florida, USA with comparably lower concentrations of MeHg (Wekiva, Santa Fe, and St. Johns Rivers) in fish and one river system with LMB that contained elevated concentrations of MeHg (St. Marys River). Microarray analysis was used to quantify transcriptomic responses to MeHg exposure. Although fish at the high-MeHg site did not show overt health or reproductive impairment, there were MeHg-responsive genes and pathways identified in the laboratory study that were also altered in fish from the high-MeHg site relative to fish at the low-MeHg sites. Gene network analysis suggested that MeHg regulated the expression targets of neuropeptide receptor and steroid signaling, as well as structural components of the cell. Disease-associated gene networks related to MeHg exposure, based upon expression data, included cerebellum ataxia, movement disorders, and hypercalcemia. Gene responses in the CNS are consistent with the documented neurotoxicological and neuroendocrine disrupting effects of MeHg in vertebrates.
Keywords: Sub-network enrichment analysis, Transcriptomics, Neurotoxicity, Neuroendocrine disruption, Movement disorders, Fish
1. Introduction
Mercury is a toxicant of global concern because it is transported through the atmosphere. Atmospheric mercury originates from both natural sources and anthropogenic sources, such as coal-burning power plants. Aquatic systems become contaminated with inorganic mercury from atmospheric deposition, as well as from point sources such as industrial activities and mining. Bacteria in aquatic sediments convert inorganic mercury to methyl-mercury (MeHg), which readily bioaccumulates through aquatic food webs. Thus, fish, wildlife, and humans are at risk of exposure to MeHg. Developmental exposure to MeHg is well known to have neurotoxic effects in mammals (Clarkson and Magos, 2006). More recently, the neuroendocrine-disrupting effects of MeHg exposure have been highlighted in aquatic vertebrates (Crump and Trudeau, 2009; Waye and Trudeau, 2011).
Exposure of fish to environmentally-relevant concentrations of MeHg can cause negative effects on reproductive performance. Tilapia (Oreochromis niloticus) exposed to MeHg chloride exhibited reduced steroid hormone concentrations and abnormal gonad development in females (Arnold, 2000). In another study, plasma concentrations of the steroid hormones 17β-estradiol (E2) and 11-ketotestosterone (11-KT) were suppressed in female and male fathead minnows (Pimephales promelas), respectively, following a low dietary exposure to MeHg (Drevnick and Sandheinrich, 2003). The same study found retarded gonad development in females and reduced spawning success. Thus, there appears to be clear evidence that mercury, at environmentally-relevant concentrations (<1 μg/g in diet), can cause altered reproductive performance in teleost fishes. However, it is unclear if the inhibition of reproduction is primarily due to direct effects on neuroendocrine function in the CNS or due to effects on peripheral reproductive tissues.
The mechanisms of MeHg toxicity include oxidative stress, binding of methylmercury to sulfhydryl groups of proteins, and the alteration of intracellular calcium concentrations (Ceccatelli et al., 2010). Thus, MeHg has multiple molecular targets, including those that are involved in the neuroendocrine system (Crump and Trudeau, 2009; Tan et al., 2009). To improve understanding of the molecular signaling cascades affected by MeHg, transcriptomics studies have been conducted in both mammals (Hwang et al., 2011; Padhi et al., 2008) and fish (Liu et al., 2013; Richter et al., 2011). These studies have demonstrated that genes related to nerve cell differentiation, myelination, iron ion homeostasis, glutathione transferase activity, regulation of muscle contraction, protein folding, cell redox homeostasis, and steroid biosynthetic process are susceptible to alteration in response to MeHg exposure. Although there is a growing body of literature that characterizes the molecular signaling cascades in the central nervous system (CNS) and peripheral tissues of vertebrates that are responsive to MeHg, additional comparative studies are warranted due to the significant human health risks associated with MeHg neurotoxicity and neuroendocrine disruption.
The objectives of this study were to identify gene networks in the CNS of female largemouth bass (Micropterus salmoides, LMB) that were responsive to MeHg treatments, assess the general health and reproductive endocrine status of LMB in environments with MeHg contamination, and to ascertain whether any changes in the expression of genes or gene networks that were responsive to MeHg exposure in a controlled laboratory study were also affected in the brain of female LMB collected from high-MeHg sites in the natural environment. Sites chosen for this research were located on the St. Marys, Santa Fe, Wekiva, and St. Johns River systems of central and northern Florida, representing a range of mercury contamination.
2. Materials and methods
2.1. Laboratory exposures and field collections
Female LMB were injected with either a control injection of 20 mM Na2CO3 (pH 6.98) or an injection of MeHg at 2.5 μg/g body weight in 20 mM Na2CO3 (pH 6.98) as previously described (Richter et al., 2011). Fish were maintained at CERC in flowing well water, by treatment. Water quality was monitored throughout the holding period. After 96 h, the fish were anesthetized with ethyl 3-aminobenzoate methanesulfonate (MS-222, Sigma–Aldrich) and the hypothalamus was dissected and flash frozen with liquid nitrogen. All animal use was reviewed and approved by the Columbia Environmental Research Center Institutional Animal Care and Use Committee.
We conducted fish health assessments at three study locations in Florida in conjunction with the USGS National Water-Quality Assessment (NAWQA) Program. The three sites were the Wekiva, Santa Fe, and St. Marys Rivers in Florida, USA. Site characteristics of the Santa Fe and St. Marys River sites have been previously described (Chasar et al., 2008, 2009). Additional LMB whole brain samples for the microarray study (details below) were collected from the St. Johns River near Welaka, FL. The St. Johns River is relatively free of Hg contamination. Fish sampling and site details for LMB in this river system can be found in Martyniuk et al. (2013). All field research was conducted in accordance with the procedures described by the American Society of Ichthyologist and Herpetologists (ASIH), American Fisheries Society (AFS), and American Institute of Fishery Research Biologists (AIFRB).
2.2. Field health assessments and tissue collection
Fish examination and tissue collection procedures in the field followed the methods of Schmitt et al. (1999). Weights (±1 g) and lengths (±1 mm) of all fish were recorded. External lesions and a necropsy-based health assessment of LMB were performed according to the protocols set forth in the USGS Biomonitoring of Environmental Status and Trends (BEST) Program (Schmitt and Dethloff, 2000). Visible lesions and gross pathological anomalies (fin erosions, skin ulcerations, eye disorders, visible tumors, and skeletal deformities) were scored based upon their occurrence and prevalence.
Following field examination, tissue, blood, and plasma samples were collected for analyses of total mercury and biomarkers that included ethoxyresorufin-O-deethylase (EROD) activity, vitellogenin (Vtg), and sex steroids E2, 11-KT and testosterone (T). Blood samples were obtained via caudal venipuncture using a heparinized needle and syringe. A subsample (0.5–1 ml) of whole blood was frozen on dry ice for total mercury determination. The remaining blood was then centrifuged to obtain plasma for sex steroid and Vtg analysis. Duplicate samples of liver tissue from individual fish were dissected and immediately frozen on dry ice for EROD analysis. Samples of whole brain were flash frozen on dry ice for transcriptomic analysis. Samples of liver, gonad, spleen, and kidney were removed and preserved for histopathological examination. Otoliths were collected for age determination (Schmitt and Dethloff, 2000).
2.3. Hg blood analysis of field-collected LMB
Whole blood samples were lyophilized in their collection vials with a Virtis Genesis 35EL freeze dryer. The vials were then resealed and stored in a desiccator until analysis, at which time each sample was homogenized by manual pulverization within the vial using a polystyrene micro-spatula. Mercury concentration was determined with a direct mercury analyzer. A dried sample (20–40 mg) was combusted in a stream of oxygen. All Hg was volatilized, passed through a catalytic chamber, and finally trapped by amalgamation on a gold substrate. The substrate was then heated and the Hg desorbed and quantitated by atomic absorption spectrophotometry (USEPA, 2003). This entire sequence was conducted with a Milestone DMA-80 analyzer equipped with an automated sample carousel.
Mercury concentrations in the blood were measured for LMB collected from each field site except for the St. Johns River. LMB from the St. Johns River were used in the microarray analysis. For these LMB, measuring Hg in blood was not possible as not enough blood was collected at the time of sacrifice. Instead, Hg was measured in the whole brain. Separate fish were used for Hg analysis and transcriptomic analysis. A back calculation was performed based on previous research in striped bass, a similar sized fish, to estimate Hg blood concentrations using detectable Hg in whole brain. The assumptions were that LMB and striped bass have comparable brain mass and that Hg deposits at a comparable rate in both species. Hg in blood was calculated by dividing the Hg in brain by a ratio of 2.14, which was the ratio between the mean Hg in striped bass brain to blood concentrations from Lake Mead, USA (Cizdziel et al., 2003). The assumptions in this calculation are supported by the similarity of the calculated blood concentration to those from the other low-mercury field sites, and by an independent study of another species, spotted seatrout, which had ratios between mean total Hg in brain to red blood cells of 3.4 and 5.5 at a contaminated site and an uncontaminated site, respectively (Adams et al., 2010).
2.4. Histology of field-collected LMB
Histological analysis of field-collected LMB was conducted by Colorado Histo-Prep on tissues from the gill, liver, spleen, kidney, gonads, and lesions as described (Schmitt and Dethloff, 2000). Briefly, tissue samples were placed in excess neutral buffered formalin as the fixative (75 ml/<5 g of tissue, wet wt.), and then transferred to alcohol within a week of the original fixation in the field. Tissues were paraffin-embedded, cut into 3–6 μm slices, and stained with hematoxylin and eosin on glass slides. Females used for microarray analysis were selected to be at the same stage of ovarian development in order to reduce variation in CNS gene expression associated with the annual reproductive cycle.
Spleen macrophage aggregate (MA) quantification was determined by first creating a tissue array using a manual tissue arrayer according to the manufacturer’s instructions (Beecher Instruments, Inc., Sun Prairie, WI) and then digitizing and analyzing the resulting images using Optimas Imaging software (Media Cybernetics, Rockville, MD). The size and number of MA were calculated for each 1 mm diameter biopsy in duplicate allowing 2 mm2 of tissue to be evaluated for each sample.
2.5. Ethoxyresorufin-O-deethylase (EROD) induction in field-collected LMB
7-Ethoxyresorufin-O-deethylase (EROD) activity of CYP1A was measured as the conversion of 7-ethoxyresorufin to resorufin (Pohl and Fouts, 1980). Microsomes were prepared from liver tissue homogenized in cold phosphate buffer (pH 7.4) with two passes of a hand-held tissuemizer (Omni International, Warrenton, VA). After centrifugation for 25 min at 9000g and 4 °C, the supernatant fraction was centrifuged at 105,000g for 50 min at 4 °C, washed in cold phosphate buffer, and recentrifuged at 105,000g for 50 min at 4 °C. The resulting microsomal pellet was resuspended in phosphate buffer and the EROD assay was performed on the same day. Microsomal samples were added to 96 well microtitre plates containing final concentrations of 3.3 μM ethoxyresorufin and 1.4 mM NADPH in phosphate buffer. Plates were incubated for 10 min at 25 °C and then scanned on a Cytofluor 2300 plate reading fluorometer (Perseptive Biosystems, Framingham, MA) with the following settings: emission filter (590 nm), excitation filter (530 nm), sensitivity 3, and 10 scans at a scan cycle of 60. All resorufin concentrations were based on a resorufin standard curve. Immediately following the EROD scan, protein content of the mixture was determined fluorometrically using the method of Kennedy and Jones (1994).
2.6. Steroid hormone and Vtg analysis of field-collected LMB
Quantification of E2, T, and 11-KT concentrations in plasma was conducted by competitive Enzyme Immunoassay (EIA) following the manufacturer’s instructions (Cayman Chemicals, Ann Arbor, MI). Each hormone concentration was determined separately. Each sample was measured in duplicate for the selected hormones and corrected for extraction efficiency. Cross-reactivity of the hormones being tested with other steroid hormones was measured.
Analysis of Vtg was conducted by the University of Florida Center for Environmental & Human Toxicology using an indirect Enzyme-Linked-Immunosorbant Assay (ELISA) as described previously (Folmar et al., 1996). Briefly, plasma samples from LMB were diluted 1:10; 1:1000; and 1:10,000 and were applied at each concentration in triplicate into 96-well plates, along with a standard curve of purified Vtg prepared in male plasma at the same dilutions as above. Plates were incubated overnight and then probed with monoclonal antibody 3G2 at 1 μg/ml, and then with an alkaline-phosphatase-conjugated anti-mouse IgG secondary antibody. Reactions were measured at 405 nm on an ELISA plate reader (SpectraMax Plus384, Applied Biosystems) and Vtg concentrations were determined based on the standard curve. The limit of detection for the LMB Vtg ELISA was 0.001 mg/ml. Inter- and intra-assay variability were <10% and <5%, respectively.
2.7. Statistics analyses for physiological health indicators
Data were evaluated for normality using a Shapiro–Wilk test. If data met assumptions of normality, then ANOVA followed by Tukey’s correction for multiple testing was conducted. If the data did not meet assumptions of normality, a Kruskal–Wallis test followed by a Mann–Whitney test was performed to evalute differences in ranked values across groups. Where appropriate, trends were analyzed using simple Pearson Product-moment correlation analysis, regression analysis, logistic regression (non-parametric), and/or profile analysis. Outliers were determined as described (Zar, 1996). Statistical thresholds for significance were set at 5% (α < 0.05) and statistical tests requiring tolerances for Type II error were set at 20% (β < 0.20).
2.8. Gene expression analysis using the LMB oligonucleotide 8 × 15 K microarray platform
A LMB 8 × 15 K microarray platform (GPL13229) was used for transcriptomics analysis. Quantitative PCR was not conducted for this study, however four independent previous studies have shown that the oligonucleotide LMB microarray provides good correlation with real-time quantitative PCR data (Garcia-Reyero et al., 2008; Martyniuk et al., 2010, 2013, 2011). For details, see the Supplemental Material. For the laboratory experiment, hypothalami from 4 female controls and 3 female treated LMB were used for gene expression analysis (total n = 7). For the field experiments, whole brains were processed from four female ovarian stage-matched LMB from each of Wekiva River (low MeHg), St. Johns River (low MeHg), and St. Marys River (high MeHg) (total n = 12).
Total RNA was extracted as previously described in Martyniuk et al. (2010). Mean (±SD) RNA integrity numbers (2100 Bioanalyzer, Agilent) were 8.08 ± 0.40 (range 7.6–8.7) and 8.76 ± 0.21 (range 8.5–9.0) for whole brain and hypothalamic samples respectively. Microarray hybridizations were performed according to the Agilent One-Color Microarray-Based Gene Expression Analysis protocol using Cyanine 3 (Cy3). One μg total RNA per sample was used for the generation of cDNA and labeled/amplified cRNA as per the Agilent Low RNA Input Fluorescent Amplification Kit. Labeling methodology and hybridizations were as previously described for LMB (Martyniuk et al., 2010; Martyniuk et al., 2013). Microarrays were scanned at 5 μm with the Agilent G2505 B Microarray Scanner and images were extracted using Agilent Feature Extraction Software (v9.5).
Raw expression data were imported into JMP® Genomics v3.2 and were normalized using Quantile normalization. An analysis of variance (ANOVA) with a false discovery rate (FDR) of 5.0% was used to identify differentially expressed genes. Data were analyzed in two separate analyses: (1) Gene expression profiles in the hypothalami from Na2CO3-injected (control) and MeHg-injected LMB were compared; (2) Gene expression patterns in whole brains of the reference site animals (St. Johns and Wekiva Rivers) (low Hg) were compared to those LMB collected from the St. Marys River (high Hg). All data were subjected to hierarchical cluster analysis using the Fast Ward algorithm and complete linkage. Functional enrichment of gene ontology terms was performed in JMP Genomics. Venn diagrams were created with Venny (Oliveros, 2007). All raw microarray data for this experiment have been deposited into the NCBI Gene Expression Omnibus (GEO) database (series GSE38474; GPL13229).
2.9. Gene set enrichment analysis and sub-network enrichment analysis
Pathway Studio 7.1 (Ariadne, Rockville, MD, USA) and ResNet 7.0 (Mammals) were utilized for gene set enrichment analysis (GSEA). A total number of 3887 genes were successfully mapped to human homologs using the Entrez GeneID. For GSEA, genes were permutated 400 times using the Kolmogorov–Smirnov classic approach as an enrichment algorithm. To broaden the analysis, all pathways were expanded to include cell processes and functional classes in target gene seeds. Enrichment p-value cut-off was set at p < 0.05. Gene set categories examined for enrichment within the microarray data included the curated Ariadne cell signaling and metabolic pathways and gene ontology categories. Sub-Network Enrichment Analysis (SNEA) was also performed to determine if there were specific gene sub-networks affected by MeHg exposure. Additional details on the SNEA can be found inLanglois and Martyniuk (2013). These networks included those that are based on common regulators of expression and common protein binding partners. The enrichment p-value for gene seeds was set at p < 0.05.
3. Results
3.1. Transcriptomic analysis of responses to laboratory exposure to MeHg
In the hypothalamus of laboratory-exposed LMB, there were 937 probes that showed significant changes in expression after Hg treatment (unadjusted p-value, Appendix 1). The unadjusted p-value was used because no probes showed significant changes after post hoc correction for multiple testing, possibly due to the small sample size (n = 4 control and n = 3 treated) available in the laboratory experiment. Annotated transcripts that showed greater than 3-fold induction in the hypothalamus were kinesin family member 2C, nuclear receptor co-repressor 2 isoform 2, heterogeneous nuclear ribonucleoprotein A1, complement factor B, SET binding factor 1, sorbin and SH3 domain containing 2, and sphingosine-1-phosphate lyase 1 while those that showed greater than 3-fold reduction in the hypothalamus were myogenic factor, UDP-glucose ceramide glucosyltransferase-like 2, ubiquitin interaction motif containing 1, signal sequence receptor, beta (translocon-associated protein beta), and uncoupling protein 2.
Functional enrichment analysis was used to identify gene ontology terms over-represented among genes with altered expression in response to MeHg injection. The two biological processes significantly affected in the hypothalamus of MeHg-injected LMB were tRNA processing and one-carbon compound metabolic process (Appendix 2).
Cell pathways affected by MeHg exposure in the LMB hypothalamus were identified by GSEA (Appendix 2, Supplemental Table S1). Perhaps most notable in the laboratory experiment was that genes associated with the process of apoptosis were significantly increased by 14% (i.e., an average 1.14-fold increase in expression of all genes in the pathway) in the hypothalamus of LMB after MeHg treatment. Notch signaling and receptor mediated signaling for neurotensin, ephrin, and frizzled were processes also significantly increased in the laboratory experiment.
Sub network enrichment analysis (SNEA) suggested the involvement of neuropeptide receptor signaling, steroid signaling, and structural components, such as beta-actin, integrins, and stress fibres in the response to MeHg exposure in the LMB hypothalamus (Appendix 2, Supplemental Table S2). In the LMB injected with MeHg, expression targets of steroid hormone receptors, NR4A1 (a member of the steroid-thyroid hormone-retinoid receptor super-family), and CYP1A1 were increased 10–20%, while expression targets that showed a reduction in expression included TRH, insulin, activin, and GnRH. The GnRH sub-network in the hypothalamus decreased by 10% in MeHg-injected LMB (Fig. 1).
Fig. 1.

The GnRH expression network was decreased in the hypothalamus of female largemouth bass (LMB) after treatment with MeHg. The expression of genes in this network decreased by an average of 10%. Red indicates increased gene expression with MeHg treatment while green indicates that gene expression is decreased in response to MeHg exposure. Abbreviations: CASP3: caspase 3, apoptosis-related cysteine peptidase; CCND2: cyclin D2; CD9: CD9 molecule; CGA: glycoprotein hormones, alpha polypeptide; CIDEA: cell death-inducing DFFA-like effector a; CYP26A1: cytochrome P450, family 26, subfamily A, polypeptide 1; FOS: FBJ murine osteosarcoma viral oncogene homolog; FSHB: follicle stimulating hormone, beta polypeptide; GAD1: glutamate decarboxylase 1 (brain, 67 kDa); GH1: growth hormone 1; GNRHR: gonadotropin-releasing hormone receptor; IGF1: insulin-like growth factor 1 (somatomedin C); LHB: luteinizing hormone beta polypeptide; MYF5: myogenic factor 5; MYOD1: myogenic differentiation 1; NFKBIA: nuclear factor of kappa light polypeptide gene enhancer in B-cells inhibitor, alpha; NPY: neuropeptide Y; NRIP1: nuclear receptor interacting protein 1; PCK2: phosphoenolpyruvate carboxykinase 2 (mitochondrial); PECR: peroxisomal trans-2-enoyl-CoA reductase; PENK: proenkephalin; PITX1: paired-like homeodomain 1; PITX2: paired-like homeodomain 2; POMC: proopiomelanocortin; PRL: prolactin; PROP1: PROP paired-like homeobox 1; PTPN6: protein tyrosine phosphatase, non-receptor type 6; PTTG1: pituitary tumor-transforming 1; RASAL1: RAS protein activator like 1 (GAP1 like); SCG2: secretogranin II; SDHC: succinate dehydrogenase complex, subunit C, integral membrane protein, 15 kDa; SSTR2: somatostatin receptor 2; STAR: steroidogenic acute regulatory protein; TAGLN: transgelin; TCF21: transcription factor 21; TGFB1: transforming growth factor, beta 1; TH: tyrosine hydroxylase; THRA: thyroid hormone receptor, alpha (erythroblastic leukemia viral (v-erb-a) oncogene homolog, avian); VEGFA: vascular endothelial growth factor A.
We queried Pathway Studio for disease-associated gene expression pathways related to the MeHg exposure results. In the LMB hypothalamus collected from lab-exposed fish, gene networks related to disease processes such as hypopituitarism, substance withdrawal syndrome, anovulation, psychological stress, ovarian cysts and diseases of the endocrine system were down-regulated while gene networks related to disease processes such as lymphocyte count, neutrophil count, peritonitis, intestinal polyps, vasculitis, and systolic dysfunction were increased with MeHg exposure (Appendix 2). Several interrelated disease networks down-regulated in hypothalamus of MeHg-exposed LMB are shown in Fig. 2.
Fig. 2.

Disease-associated gene networks related to differentially regulated genes affected by MeHg exposure in the hypothalamus of female largemouth bass (LMB). Many transcripts in the pathways were down-regulated with MeHg treatment. Red indicates increased gene expression with MeHg treatment while green indicates that gene expression is decreased in response to MeHg exposure. Abbreviations: AR: androgen receptor; BRD4: bromodomain containing 4; CGA: glycoprotein hormones, alpha polypeptide; CPE: carboxypeptidase E; CYP19A1: cytochrome P450, family 19, subfamily A, polypeptide 1; FST: follistatin; GH1: growth hormone 1; GNAQ: guanine nucleotide binding protein (G protein), q polypeptide; GNAS: GNAS complex locus; IGF1: insulin-like growth factor 1 (somatomedin C); LDLR: low density lipoprotein receptor; LTF: lactotransferrin; MYF5: myogenic factor 5; NPY: neuropeptide Y; NR1H3: nuclear receptor subfamily 1, group H, member 3; POMC: proopiomelanocortin; PRL: prolactin; SRD5A1: steroid-5-alpha-reductase, alpha polypeptide 1 (3-oxo-5 alpha-steroid delta 4-dehydrogenase alpha 1); STAR: steroidogenic acute regulatory protein; TGFB1: transforming growth factor, beta 1; TSPO: translocator protein (18 kDa).
3.2. Health indicators in field-collected LMB
There were significant differences in total Hg in LMB collected from field sites (df = 2, χ = 13.28, P = 0.0013). The LMB from St. Marys River had significantly higher concentrations of Hg in blood than animals collected from the Santa Fe and Wekiva Rivers, and from the predicted blood concentration of LMB collected from the St. Johns River (Fig. 3). In addition, mercury concentrations in filets were measured in LMB from the St. Marys, Santa Fe, and Wekiva Rivers by NAWQA. Mercury values for both wet and dry measurements were significantly higher (α = 0.05) in fish from St. Marys than the other two sites. St. Marys fish had values 3 times higher (6.00 ± 1.6 ppm dry, 1.20 ± 0.30 ppm wet) than Santa Fe (2.21 ± 1.10 ppm dry, 0.43 ± 0.24 ppm wet) and Wekiva (2.06 ± 0.86 ppm dry, 0.40 ± 0.16 ppm wet).
Fig. 3.
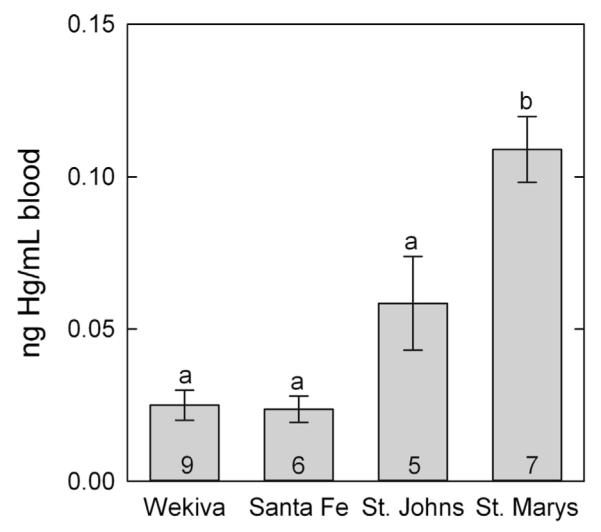
Mean (±SE) total Hg blood concentrations (ng/ml blood) in largemouth bass (LMB) collected at field sites. Number of fish assayed per group is labeled on each column. Columns with different letters denote significant differences (p = 0.05).
Weights and lengths were taken for fish from all three sites. Males were found to be consistently smaller than the females in both length and weight for all sites (Supplemental Fig. S1). Males and females from St. Marys were significantly larger (α = 0.05) in size than their counterparts at the other two sites. Wekiva fish were the smallest in both length and weight. Condition factor (CF, Weight/Length3) was not statistically different for LMB collected at the three sites. There was no significant variation in GSI among sites (df = 2, F = 0.55, P = 0.58) (Supplemental Fig. S2). Hepatic somatic index (HSI) and spleen somatic index (SSI)) were also calculated for all fish, and did not show significant differences among sites (α = 0.05). Sexes were analyzed separately for GSI and HIS, but combined for the SSI. Analysis of otoliths suggested that the St. Marys fish were significantly older (α = 0.05) (6.3 yr ± 2.4) than LMB collected at the other two sites, which were comparable in age (Santa Fe: 3.1 yr ± 1.4 and Wekiva: 3.0 yr ± 0.91).
A Health Assessment Index (HAI) was calculated for each LMB, with scores based on the number and type of abnormalities (Schmitt and Dethloff, 2000). Greater HAI values indicate more abnormalities and greater stress to the fish; however, HAI values alone do not give information on the causes of stress. Fish from Wekiva were found to have the greatest average number of abnormalities (4.2) and highest average HAI (122.6), significantly different (α = 0.05) from HAI values of fish from St. Marys and Santa Fe. Santa Fe fish had an average of 3.7 abnormalities and an average HAI of 100.7, while St. Marys fish averaged 1.9 abnormalities and HAI of 53. More details on the abnormalities can be found in the Supplemental Material.
Hepatic EROD analysis showed that males had higher EROD activity than females, and EROD activity was highest at Wekiva River in both sexes, although there were no significant differences (α = 0.05) among sites (Supplemental Fig. S3). Variability was high among males from Wekiva with a range of 10–595 pmol/min/mg recorded.
Sex steroid analyses of E2, T and 11-KT were performed on plasma from all fish (Fig. 4). Sex steroid levels showed high variability among individuals of both sexes. Estradiol concentrations were significantly higher for females collected from the St. Marys River compared to the Santa Fe River, but were not significantly different from females from the Wekiva River. The estradiol concentrations measured from all three sites were within the range of those recorded by others (Goodbred et al., 2007; Sepúlveda et al., 2002). Among male LMB, estradiol concentrations were significantly greater in males collected at the Wekiva River than at the Santa Fe site. Wekiva River males were overall found to be less reproductively mature during histological staging when compared to Santa Fe males, which may account for the differences. Additionally, males collected from the Wekiva and Santa Fe Rivers had significantly lower testosterone concentrations than St. Marys River males. Protein analysis for Vtg was also conducted on plasma from both males and females (data not shown). No significant differences were observed among the females. Male Vtg values were undetectable in all but one fish from Wekiva (0.002 mg/ml).
Fig. 4.

Steroid hormones estradiol (E), testosterone (T), and 11-ketotestosterone (11-KT) in plasma from (A) female and (B) male adult largemouth bass (LMB) collected from the Wekiva, Santa Fe, and St. Marys Rivers. Error bars are one standard error of the mean. Number of fish assayed per group is labeled on or above each column. Columns with different letters denote significant differences (p = 0.05).
3.3. Analysis of differences in gene expression in LMB whole brain across field sites
Gene expression in the whole brain of LMB that had high Hg in the blood (St. Marys River LMB) was compared to the brain of LMB collected from the two low-MeHg rivers. Because there are multiple factors that differed between the river systems, including MeHg levels, we first described gene expression patterns in LMB among the field sites, and then compared this to LMB from the laboratory study. There were 2909 probes (unadjusted p-value) differentially expressed at St. Marys relative to low-MeHg rivers. After post hoc correction for multiple testing, there were 38 transcripts that were differentially expressed. Examples of genes that were significantly increased in whole brain were ATP synthase F0 subunit 6 (2.90-fold increase), Hsp90 co-chaperone Cdc37 (4.02-fold increase), and multicopper oxidase (1.61-fold increase), while examples of genes that were significantly decreased in the whole brain of LMB included mismatch repair protein Msh6 (2.57-fold decrease), 16 kDa heat shock protein A (5.04-fold decrease), mitosisspecific chromosome segregation protein SMC1 homolog (2.22-fold decrease), and PREDICTED: similar to phospholipase C, beta 4 (3.86-fold decrease). All gene expression changes are reported in Appendix 1. There were 200 probes that were differentially expressed in both field-collected and laboratory-exposed fish (Supplemental Fig. S4). Pearson correlation revealed that there was no significant correlation between gene changes from laboratory and field samples (correlation co-efficient = −0.096 and P = 0.177).
Hierarchal clustering of expression data (P < 0.05) also demonstrated that gene expression patterns in the hypothalami from the laboratory experiment and in whole brains from the field survey were, as expected, different overall. Both MeHg-treated LMB in the laboratory and LMB collected from the field sites showed two distinct clades (Supplemental Fig. S5). In the clade that contained LMB from the laboratory experiment, there was some overlap in gene expression profiles between control and treated animals. However, most interesting was the expression clustering of the LMB collected from the field. LMB collected from the St Marys River showed overlap in whole brain expression profiles with Wekiva, a river system that had significantly lower Hg. LMB collected from the St. Johns River comprised a distinct cluster and were separated from LMB collected from both Wekiva and St. Marys River. The cluster analysis suggests that MeHg is not the primary factor driving gene expression patterns observed in the brain of LMB from the field sites. To improve confidence that some expression patterns may be related to MeHg, we compared gene expression patterns in both laboratory and field experiments.
The majority of the biological processes over-represented by genes in the whole brain of field-collected LMB at the high MeHg site were related to damaged proteins (Appendix 2, Supplemental Table S3). For example, biological processes affected at the transcript level included protein folding and targeting, regulation of protein metabolic process, and protein degradation (i.e. ubiquitin cycle).
In the whole brains of LMB collected from the St. Marys River, a river with high MeHg, the majority of the altered cell pathways identified by GSEA were different than those identified in the hypothalami of LMB injected with MeHg (Appendix 2, Supplemental Table S1). The cell signaling pathways altered were growth hormone (GH) receptor signaling, tricarboxylic acid cycle, melanogenesis, biosynthesis of cholesterol, actin cytoskeleton regulation, and ephrin receptor-actin signaling. Overall, these pathways were increased in St. Marys River fish except for GH signaling.
Sub network enrichment analysis (SNEA) also suggested that there were unique expression targets and binding partners in each treatment and many gene set seeds involved neurotransmitters and neurohormones (Appendix 2, Supplemental Table S2). In the field-collected LMB, expression targets in the whole brain that were significantly decreased were few and included sonic hedgehog; while cell signaling cascades of cyclin-dependent kinase inhibitor 1B, activating protein kinase C (alpha), and mitogen-activated protein kinase kinase 1 were increased between 10% and 60%. Hormone-related gene networks such as calcitonin-related polypeptide (alpha), insulin-like growth factor 2, and vasoactive intestinal peptide (VIP) were also increased in the whole brain of LMB collected from the high MeHg site. Interestingly, expression targets that were in common between the laboratory experiment (Hg injected) and field-collected LMB consisted of mainly homeobox transcription factors such as PROP paired-like homeobox 1 (PROP1), LIM homeobox 3 (LHX3), and paired-like homeodomain 1 and 2 (PITX1, PITX2). These expression networks of transcription factors were overwhelmingly decreased in both the hypothalamus and whole brain of LMB. Lastly, CYP1A1 expression networks were altered in both analyses. CYP1A1 expression targets were increased 25% in lab and decreased 60% in field, suggesting that there is a response of enzymes involved in the metabolism of toxic substances.
We queried Pathway Studio for changes in disease-associated gene networks using gene expression data collected from both the field and laboratory. In the LMB whole brain collected from the high-MeHg field site, gene networks related to disease processes such as birth-weight, hypopituitarism, critical illness, and hyperprolactinemia were down-regulated while gene networks related to disease processes such as vein passage, embryotoxicity, movement disorders, cerebellar ataxia, and alveolus morphology were up-regulated (Appendix 2). Many of these entities were affected by 50–100%. Several up-regulated disease networks are shown in Fig. 5. Most interesting was that there were seventeen disease networks in common between the field and laboratory fish (Table 1). These included genes related to hypopituitarism, endocrine system diseases, amenorrhea, precocious puberty, prolactinoma, and activated protein C resistance.
Fig. 5.

Disease-associated gene networks related to differentially regulated genes altered in whole brain of female largemouth bass (LMB) at the high-MeHg field site. Red indicates increased gene expression at the high-MeHg field site while green indicates that gene expression is decreased at the high-MeHg field site. Abbreviations: ABCB7: ATP-binding cassette, sub-family B (MDR/TAP), member 7; AMACR: alpha-methylacyl-CoA racemase; CASP3: caspase 3, apoptosis-related cysteine peptidase; CAT: catalase; CDC73: cell division cycle 73, Paf1/RNA polymerase II complex component, homolog (S. cerevisiae); CLDN4: claudin 4; CP: ceruloplasmin (ferroxidase); CREB1: cAMP responsive element binding protein 1; CTSD: cathepsin D; CYP24A1: cytochrome P450, family 24, subfamily A, polypeptide 1; ESR1: estrogen receptor 1; ESR2: estrogen receptor 2 (ER beta); F2: coagulation factor II (thrombin); FGA: fibrinogen alpha chain; GAD1: glutamate decarboxylase 1 (brain, 67 kDa); GAD2: glutamate decarboxylase 2 (pancreatic islets and brain, 65 kDa); GH1: growth hormone 1; GNAQ: guanine nucleotide binding protein (G protein), q polypeptide; HSPA8: heat shock 70 kDa protein 8; IGF1: insulin-like growth factor 1 (somatomedin C); KDR: kinase insert domain receptor (a type III receptor tyrosine kinase); LYZ: lysozyme; MBP: myelin basic protein; NPY: neuropeptide Y; PARP1: poly (ADP-ribose) polymerase 1; PLG: plasminogen; POMC: proopiomelanocortin; PPARG: peroxisome proliferator-activated receptor gamma; PRDX4: peroxiredoxin 4; PRL: prolactin; SERPINC1: serpin peptidase inhibitor, clade C (antithrombin), member 1; SGCE: sarcoglycan, epsilon; STC1: stanniocalcin 1; TBP: TATA box binding protein; TGFB1: transforming growth factor, beta 1; TPT1: tumor protein, translationally-controlled 1; VEGFA: vascular endothelial growth factor A.
Table 1.
Sub network enrichment analysis for disease networks with altered gene expression in common in both the female largemouth bass (LMB) hypothalamus laboratory MeHg injection study and the female LMB whole brain field study. The complete list of significantly regulated disease sub-networks is presented in Appendix 2.
| Disease | Total # of neighbors |
# of Measured neighbors |
Median change whole brain |
p-Value whole brain |
Median change HYP |
p-Value HYP |
|---|---|---|---|---|---|---|
| Activated protein C resistance |
10 | 6 | −1.252 | 0.034 | −1.102 | 0.024 |
| Alveolus morphology | 16 | 5 | 1.958 | 0.005 | −1.750 | 0.016 |
| Amenorrhea | 14 | 7 | −1.443 | 0.007 | −1.897 | 0.016 |
| Critical illness | 23 | 6 | −1.582 | 0.042 | −1.124 | 0.050 |
| Endocrine system diseases | 21 | 9 | −1.157 | 0.039 | −1.897 | 0.002 |
| Evoked potential | 129 | 21 | −1.198 | 0.047 | 1.121 | 0.007 |
| Gestational age | 161 | 19 | −1.206 | 0.003 | −1.287 | 0.009 |
| Hypopituitarism | 18 | 7 | −1.582 | 0.008 | −3.338 | 0.002 |
| Intestinal diseases | 70 | 12 | 1.401 | 0.012 | 1.062 | 0.032 |
| Liver mass | 26 | 8 | 1.440 | 0.010 | −1.287 | 0.018 |
| Lordosis | 56 | 10 | 1.251 | 0.026 | −1.580 | 0.035 |
| Pituitary neoplasms | 121 | 22 | −1.224 | 0.001 | −1.076 | 0.016 |
| Podocyte infiltration | 33 | 6 | 1.440 | 0.038 | −1.287 | 0.034 |
| Prolactinoma | 34 | 8 | 1.440 | 0.004 | −1.287 | 0.006 |
| Puberty, precocious | 20 | 8 | 1.312 | 0.024 | −1.313 | 0.008 |
| Testis size | 20 | 7 | −1.389 | 0.038 | −1.472 | 0.003 |
| Thymus involution | 41 | 12 | 1.440 | 0.030 | −1.445 | 0.030 |
4. Discussion
Our goal was to identify MeHg-specific gene expression signatures in native fish exposed to MeHg in the environment. However, we point out here that there were challenges in elucidating gene expression responses that were directly due to MeHg exposure. The LMB collected from the field sites showed differences in size and age, and each site had unique environmental conditions and stressors, likely to produce distinct gene expression signatures alone and in combination. However, this challenge is one that faces all endpoints measured in field-based ecotoxicology. In addition, whole brain gene expression patterns were measured at the field sites, but hypothalamus gene expression patterns were measured in the laboratory experiment. Gene expression signatures specific to the hypothalamus may be diluted in samples of whole brain, and whole brain may have gene expression responses not found in hypothalamus. However, despite these sources of variation among the treatment groups, there was detectable overlap in gene expression changes between the laboratory-exposed fish and fish collected from the high-MeHg field site, suggesting that contaminant-specific gene expression profiles can be discerned in fish exposed to a complex mixture of contaminants and other stressors in the environment.
Concentrations of mercury in the fish from the St. Marys River were indicative of a mercury-contaminated aquatic ecosystem (Wiener et al., 2003), while the LMB from the Wekiva and Santa Fe river systems contained moderate amounts of mercury; less than usually found in contaminated or susceptible environments, but more than found in aquatic ecosystems in North America without direct inputs of mercury (Wiener et al., 2003). Mercury tissue concentrations in fish corresponding to adverse effects are dependent on the species and adverse outcome. Studies of reproductive and endocrine-related effects of mercury in fathead minnows have established that the threshold mercury tissue concentrations are within the range observed in LMB from the St. Marys River, while mercury concentrations observed in the fish from the other systems are at or below the threshold concentrations expected to result in altered reproduction or endocrine disruption (Crump and Trudeau, 2009). The sensitivity of bass toward mercury-induced effects relative to other species, such as fathead minnow, is not known at this time.
The activity of Phase I metabolic enzymes (i.e. EROD) was not significantly different among sites, but was elevated in some individual male LMB collected from the Wekiva River, relative to the other sites in this study and compared to average activities measured in LMB in a national fish biomonitoring survey (Hinck et al., 2008). Female LMB from all sites had EROD activities that are considered within the expected normal range (Hinck et al., 2008). While males from Santa Fe River were normal, the average EROD activity in males from St. Marys River would be considered elevated, and the average hepatic EROD in males from the Wekiva River was clearly greater than what might be considered background. The Wekiva River is on the EPA list of impaired waters (http://iaspub.epa.gov/tmdl_waters10/attains_impaired_waters.control?p_state=FL) and its watershed contains potential sources of AhR agonists, such as pulp mill discharge and urban areas that may have contributed to the elevated EROD activities observed in the LMB. These same Wekiva River fish had the greatest HAI values and the greatest parasite load, indicating increased numbers of physical anomalies and potentially reduced health. However, the LMB from the Wekiva River did not have elevated macrophage aggregates, which might have been expected if their health was impaired. Steroid hormone concentrations (E2 in females and T/11-KT in males) were reduced in LMB from the Wekiva and Santa Fe Rivers, while within the normal range for the reproductive stage in LMB from the St. Marys River (Hinck et al., 2008).
There were 200 common transcripts with altered expression between the laboratory and field experiments. Largely different transcriptomics profiles were expected as the datasets compared were for the hypothalamus and the whole brain, and because gene expression profiles from the field sites may have reflected the responses to other local environmental factors in addition to MeHg concentrations. Gene expression studies have shown that specific regions of the teleost brain can respond differently at the mRNA level (Ho et al., 2013; Martyniuk et al., 2006). However, the pathway analysis offers increased insight into the cell processes affected in each tissue and there were some commonalities in terms of molecular targets and disease-associated gene pathways (see below). Therefore, despite the fact that gene profiles specific for the hypothalamus are diluted in whole brains of LMB from the field, there are some common processes between the two studies that support the hypothesis that these pathways are affected by MeHg exposure.
Laboratory-exposed LMB showed a significant reduction in a gene network involving GnRH1 in the hypothalamus. In this expression network, there were a number of other neuropeptides and receptor subunits that were decreased and these included GH, LHb and FSHb receptor subunits, as well as the GnRH receptor. Transcripts within the network that showed an increase in expression included TGFb and VEGFA. Therefore, MeHg may have effects on the expression of reproductive neuropeptides in the teleost neuroendocrine brain. This is supported by other studies in fish. Juvenile beluga (Huso huso) fed one of three doses of dietary MeHg (0.76, 7.88, and 16.22 ppm) over 32 days showed significant decreases in GnRH mRNA in the whole brain (Gharaei et al., 2010). Both mGnRH and cGnRH-II mRNAs followed a pattern of decreased expression over time and dose. The GnRH signaling network identified here also reveals that there may be a relationship between GnRH, GH, and MeHg. GnRH is a regulator of the growth hormone system in fish (Marchant et al., 1989) and down-regulation of GH signaling may be an indirect effect of MeHg on the GnRH system. This may explain reductions in body weight and growth observed in other fish species after dietary feeding regimes with MeHg (Lee et al., 2011). Another point to make is that LH, one of the primary endocrine targets of GnRH regulation, is also thought to be a major target of inorganic mercury (Laks, 2010). Thus, MeHg may have a cumulative impact on the vertebrate reproductive axis by affecting GnRH, GH, and LH receptor signaling.
In laboratory-exposed fish, disease network analysis revealed CNS and reproductive processes as major themes for mercury-induced effects in LMB. Gene networks related to weight loss, movement disorders, cerebellar ataxia, and tremors were increased while gene networks associated with absence of epilepsy, substance withdrawal syndrome, psychological stress, and migraine disorders were down-regulated. Changes in these networks are consistent with the well documented neurotoxic effects of MeHg in both fish and mammals (Clarkson and Magos, 2006). This analysis begins to identify some of the putative molecular responses underlying these well-documented neurological effects.
Despite the fact that field-collected fish from the high mercury river did not exhibit overt reproductive impairment at higher levels of biological organization, there were many common changes in expression of disease-associated gene networks identified in LMB from both the laboratory exposure and field survey that were related to reproduction. These included amenorrhea, lordosis, testis size, precocious puberty, prolactinoma, and gestational age. Therefore, there is evidence that transcripts related to reproduction are altered in LMB in response to MeHg exposure; both in the CNS and the peripheral reproductive tract. The effects of MeHg on vertebrate reproductive processes are well supported and manifest themselves as impaired steroidogenesis, delayed gonad development, and lower fecundity (Friedmann et al., 2002). In teleost fishes, MeHg is reported to impair normal reproductive processes (reviewed in Crump and Trudeau (2009)), although there is some debate over the extent of reproductive impacts in fish species. Batchelar et al. (2013) assessed reproductive endpoints in yellow perch (Perca flavescens) in an area high in mercury (Kejimkujik National Park and National Historic Site, Nova Scotia, CAN). Gonadosomatic index, plasma E2, and germ cell development were assessed in male and female perch and there were no significant differences among perch from different lakes with varied concentrations of total Hg. In the present study, there were also no overt effects on physiological measures of reproduction, but transcriptional effects associated with MeHg exposure were apparent, supporting the sensitivity of transcriptional endpoints.
In conclusion, this study investigated the effects of MeHg exposure in LMB, and focused on transcriptional responses observed in both the laboratory and field experiments, and general and reproductive health outcomes in the field collections. Evidence of neuroendocrine disruption was observed in transcriptional responses in the hypothalamus, specifically on the GnRH signaling system. Although no overt reproductive effects were observed in LMB, there were common genes and pathways altered in both the field and laboratory experiments. This common gene set may offer robust and sensitive biomarkers of MeHg exposure. Deregulation of neuroendocrine function may also lead to reproductive effects observed in aquatic organisms; however, testing this hypothesis was beyond the scope of this investigation. Future studies should focus on separating the direct effects of MeHg on the CNS versus impacts on peripheral reproductive tissues to better characterize mechanisms underlying MeHg neurotoxicity and reproductive impairment. We suggest that the vertebrate CNS, which is a major target of MeHg toxicity, is also subject to neuroendocrine disruption in mercury-exposed LMB.
Supplementary Material
Acknowledgments
We thank Kevin Kroll, University of Florida; Terry Petrosky, Georgia-Florida Basin NAWQA; Rod DeWeese, USGS, Denver; Steve Goodbred, USGS, Sacramento; the Florida Fish and Wildlife Conservation Commission, including Jerry Krummich and staff, North Central Regional, Ted Lange and Bethany Sargent, Eustis Fisheries Laboratory, and Sam McKinney and staff, Northeast Regional Office; and Joey Swaters, Tom May, Vanessa Velez, Jeff Caton, Rachel Claunch, Diane Nicks, Elizabeth Biro, Jo Ellen Hinck, and Dina Boyt, USGS-CERC. This research was funded in part by a National Institutes of Health Pathway to Independence Award granted to CJM (K99 ES016767-01A1) and by the Contaminants Biology Program of the U.S. Geological Survey, in support of the National Water-Quality Assessment (NAWQA) program. Any use of trade, firm, or product names is for descriptive purposes only and does not imply endorsement by the U.S. Government.
Abbreviations
- 11-KT
11-ketotestosterone
- ABCB7
ATP-binding cassette sub-family B (MDR/TAP), member 7
- AMACR
alpha-methylacyl-CoA racemase
- AR
androgen receptor
- BEST
Biomonitoring of Environmental Status and Trends
- BRD4
bromodomain containing 4
- CASP3
caspase 3, apoptosis-related cysteine peptidase
- CAT
catalase
- CCND2
cyclin D2
- CD9
CD9 molecule
- CDC73
cell division cycle 73, Paf1/RNA polymerase II complex component, homolog (S. cerevisiae)
- CGA
glycoprotein hormones, alpha polypeptide
- CIDEA
cell death-inducing DFFA-like effector a
- CLDN4
claudin 4
- CNS
central nervous system
- CP
ceruloplasmin (ferroxidase)
- CPE
carboxypeptidase E
- CREB1
cAMP responsive element binding protein 1
- CTSD
cathepsin D
- CYP19A1
cytochrome P450, family 19, subfamily A, polypeptide 1
- CYP24A1
cytochrome P450, family 24, subfamily A, polypeptide 1
- CYP26A1
cytochrome P450, family 26, subfamily A, polypeptide 1
- E2
17β-estradiol
- ESR1
estrogen receptor 1
- ESR2
estrogen receptor 2 (ER beta)
- EROD
ethoxyresorufin-O-deethylase
- F2
coagulation factor II (thrombin)
- FDR
false discovery rate
- FGA
fibrinogen alpha chain
- FOS
FBJ murine osteosarcoma viral oncogene homolog
- FSHB
follicle stimulating hormone, beta polypeptide
- FST
follistatin
- GAD1
glutamate decarboxylase 1 (brain, 67 kDa)
- GAD2
glutamate decarboxylase 2 (pancreatic islets and brain, 65 kDa)
- GH1
growth hormone 1
- GNAQ
guanine nucleotide binding protein (G protein), q polypeptide
- GNAS
GNAS complex locus
- GnRH
gonadotropin-releasing hormone
- GNRHR
gonadotropin-releasing hormone receptor
- GSEA
gene set enrichment analysis
- HSPA8
heat shock 70 kDa protein 8
- IGF1
insulin-like growth factor 1 (somatomedin C)
- KDR
kinase insert domain receptor (a type III receptor tyrosine kinase)
- LDLR
low density lipoprotein receptor
- LH
luteinizing hormone
- LHB
luteinizing hormone beta polypeptide
- LMB
largemouth bass
- LTF
lactotransferrin
- LYZ
lysozyme
- MBP
myelin basic protein
- MeHg
methylmercury
- MYF5
myogenic factor 5
- MYOD1
myogenic differentiation 1
- NAWQA
National Water-Quality Assessment Program
- NFKBIA
nuclear factor of kappa light polypeptide gene enhancer in B-cells inhibitor, alpha
- NPY
neuropeptide Y
- NR1H3
nuclear receptor subfamily, 1 group H, member 3
- NRIP1
nuclear receptor interacting protein 1
- PARP1
poly (ADP-ribose) polymerase 1
- PCK2
phosphoenolpyruvate carboxykinase 2 (mitochondrial)
- PECR
peroxisomal trans-2-enoyl-CoA reductase
- PENK
proenkephalin
- PITX1
paired-like homeodomain 1
- PITX2
paired-like homeodomain 2
- PLG
plasminogen
- POMC
proopiomelanocortin
- PPARG
peroxisome proliferator-activated receptor gamma
- PRDX4
peroxiredoxin 4
- PRL
prolactin
- PROP1
PROP paired-like homeobox 1
- PTPN6
protein tyrosine phosphatase, non-receptor type 6
- PTTG1
pituitary tumor-transforming 1
- RASAL1
RAS protein activator like 1 (GAP1 like)
- SCG2
secretogranin II
- SDHC
succinate dehydrogenase complex, subunit C, integral membrane protein, 15 kDa
- SERPINC1
serpin peptidase inhibitor, clade C (antithrombin), member 1
- SGCE
sarcoglycan, epsilon
- SNEA
sub network enrichment analysis
- SRD5A1
steroid-5-alpha-reductase, alpha polypeptide 1 (3-oxo-5 alpha-steroid delta 4-dehydrogenase alpha 1)
- SSTR2
somatostatin receptor 2
- STAR
steroidogenic acute regulatory protein
- STC1
stanniocalcin 1
- T
testosterone
- TAGLN
transgelin
- TBP
TATA box binding protein
- TCF21
transcription factor 21
- TGFB1
transforming growth factor, beta 1
- TH
tyrosine hydroxylase
- THRA
thyroid hormone receptor, alpha (erythroblastic leukemia viral (v-erb-a) oncogene homolog, avian)
- TPT1
tumor protein, translationally-controlled 1
- TSPO
translocator protein (18 kDa)
- VEGFA
vascular endothelial growth factor A
- Vtg
vitellogenin
Footnotes
Appendix A. Supplementary data Supplementary data associated with this article can be found, in the online version, at http://dx.doi.org/10.1016/j.ygcen.2014.03.029.
References
- Adams DH, Sonne C, Basu N, Dietz R, Nam D-H, Leifsson PS, Jensen AL. Mercury contamination in spotted seatrout, Cynoscion nebulosus: an assessment of liver, kidney, blood, and nervous system health. Sci. Total Environ. 2010;408:5808–5816. doi: 10.1016/j.scitotenv.2010.08.019. [DOI] [PubMed] [Google Scholar]
- Arnold BS. (Oreochromis niloticus) (dissertation) University of Georgia; 2000. Distribution of mercury within different trophic levels of the Okefenokee swamp, within tissues of top level predators, and reproductive effects of methyl mercury in the Nile tilapia; p. 187. [Google Scholar]
- Batchelar KL, Kidd KA, Munkittrick KR, Drevnick PE, Burgess NM. 2013. Reproductive health of yellow perch (Perca flavescens) from a biological mercury hotspot in Nova Scotia, Canada. Sci. Total Environ. :454–455. 319–327. doi: 10.1016/j.scitotenv.2013.03.020. [DOI] [PubMed] [Google Scholar]
- Ceccatelli S, Daré E, Moors M. Methylmercury-induced neurotoxicity and apoptosis. Chem. Biol. Interact. 2010;188:301–308. doi: 10.1016/j.cbi.2010.04.007. [DOI] [PubMed] [Google Scholar]
- Chasar LC, Scudder BC, Bell AH, Wentz DA, Brigham ME. Total mercury, methylmercury, and carbon and nitrogen stable isotope data for biota from selected streams in Oregon, Wisconsin, and Florida, 2003–04. Vol. 349. U.S. Geological Survey Data Series; 2008. p. 10. [Google Scholar]
- Chasar LC, Scudder BC, Stewart AR, Bell AH, Aiken GR. Mercury cycling in stream ecosystems. 3. Trophic dynamics and methylmercury bioaccumulation. Environ. Sci. Technol. 2009;43:2733–2739. doi: 10.1021/es8027567. [DOI] [PubMed] [Google Scholar]
- Cizdziel J, Hinners T, Cross C, Pollard J. Distribution of mercury in the tissues of five species of freshwater fish from Lake Mead, USA. J. Environ. Monit. 2003;5:802–807. doi: 10.1039/b307641p. [DOI] [PubMed] [Google Scholar]
- Clarkson TW, Magos L. The toxicology of mercury and its chemical compounds. Crit. Rev. Toxicol. 2006;36:609–662. doi: 10.1080/10408440600845619. [DOI] [PubMed] [Google Scholar]
- Crump KL, Trudeau VL. Mercury-induced reproductive impairment in fish. Environ. Toxicol. Chem. 2009;28:895–907. doi: 10.1897/08-151.1. [DOI] [PubMed] [Google Scholar]
- Drevnick PE, Sandheinrich MB. Effects of dietary methylmercury on reproductive endocrinology of fathead minnows. Environ. Sci. Technol. 2003;37:4390–4396. doi: 10.1021/es034252m. [DOI] [PubMed] [Google Scholar]
- Folmar LC, Denslow ND, Rao V, Chow M, Crain DA, Enblom J, Marcino J, Guillette LJ., Jr. Vitellogenin induction and reduced serum testosterone concentrations in feral male carp (Cyprinus carpio) captured near a major metropolitan sewage treatment plant. Environ. Health Perspect. 1996;104:1096–1101. doi: 10.1289/ehp.961041096. [DOI] [PMC free article] [PubMed] [Google Scholar]
- Friedmann AS, Kimble Costain E, MacLatchy DL, Stansley W, Washuta EJ. Effect of mercury on general and reproductive health of largemouth bass (Micropterus salmoides) from three lakes in New Jersey. Ecotoxicol. Environ. Saf. 2002;52:117–122. doi: 10.1006/eesa.2002.2165. [DOI] [PubMed] [Google Scholar]
- Garcia-Reyero N, Griffitt RJ, Liu L, Kroll KJ, Farmerie WG, Barber DS, Denslow ND. Construction of a robust microarray from a non-model species largemouth bass, Micropterus salmoides (Lacèpede), using pyrosequencing technology. J. Fish Biol. 2008;72:2354–2376. doi: 10.1111/j.1095-8649.2008.01904.x. [DOI] [PMC free article] [PubMed] [Google Scholar]
- Gharaei A, Mahboudi F, Esmaili-Sari A, Edalat R, Adeli A, Keyvanshokooh S. Molecular cloning of cDNA of mammalian and chicken II gonadotropin-releasing hormones (mGnRHs and cGnRH-II) in the beluga (Huso huso) and the disruptive effect of methylmercury on gene expression. Fish Physiol. Biochem. 2010;36:803–817. doi: 10.1007/s10695-009-9356-0. [DOI] [PubMed] [Google Scholar]
- Goodbred SL, Smith SB, Greene PS, Rauschenberger RH, Bartish TM. Reproductive and Endocrine Biomarkers in Largemouth Bass (Micropterus salmoides) and Common Carp (Cyprinus carpio) from United States Waters. 2006-227. U.S. Geological Survey Data Series; 2007. p. 99. [Google Scholar]
- Hinck JE, Schmitt CJ, Ellersieck MR, Tillitt DE. Relations between and among contaminant concentrations and biomarkers in black bass (Micropterus spp.) and common carp (Cyprinus carpio) from large US rivers, 1995–2004. J. Environ. Monit. 2008;10:1499–1518. doi: 10.1039/b811011e. [DOI] [PubMed] [Google Scholar]
- Ho NY, Yang L, Legradi J, Armant O, Takamiya M, Rastegar S, Strähle U. Gene responses in the central nervous system of zebrafish embryos exposed to the neurotoxicant methyl mercury. Environ. Sci. Technol. 2013;47:3316–3325. doi: 10.1021/es3050967. [DOI] [PubMed] [Google Scholar]
- Hwang G-W, Lee J-Y, Ryoke K, Matsuyama F, Kim J-M, Takahashi T, Naganuma A. Gene expression profiling using DNA microarray analysis of the cerebellum of mice treated with methylmercury. J. Toxicol. Sci. 2011;36:389–391. doi: 10.2131/jts.36.389. [DOI] [PubMed] [Google Scholar]
- Kennedy SW, Jones SP. Simultaneous measurement of cytochrome P4501A catalytic activity and total protein concentration with a fluorescence plate reader. Anal. Biochem. 1994;222:217–223. doi: 10.1006/abio.1994.1476. [DOI] [PubMed] [Google Scholar]
- Laks DR. Luteinizing hormone provides a causal mechanism for mercury associated disease. Med. Hypotheses. 2010;74:698–701. doi: 10.1016/j.mehy.2009.10.036. [DOI] [PubMed] [Google Scholar]
- Langlois VS, Martyniuk CJ. Genome wide analysis of Silurana (Xenopus) tropicalis development reveals dynamic expression using network enrichment analysis. Mech. Dev. 2013;130:304–322. doi: 10.1016/j.mod.2012.12.002. [DOI] [PubMed] [Google Scholar]
- Lee J-W, De Riu N, Lee S, Bai SC, Moniello G, Hung SSO. Effects of dietary methylmercury on growth performance and tissue burden in juvenile green (Acipenser medirostris) and white sturgeon (A. transmontanus) Aquat. Toxicol. 2011;105:227–234. doi: 10.1016/j.aquatox.2011.06.013. [DOI] [PubMed] [Google Scholar]
- Liu Q, Basu N, Goetz G, Jiang N, Hutz R, Tonellato P, Carvan M., III Differential gene expression associated with dietary methylmercury (MeHg) exposure in rainbow trout (Oncorhynchus mykiss) and zebrafish (Danio rerio) Ecotoxicology. 2013;22:740–751. doi: 10.1007/s10646-013-1066-9. [DOI] [PMC free article] [PubMed] [Google Scholar]
- Marchant TA, Chang JP, Nahorniak CS, Peter RE. Evidence that gonadotropin-releasing hormone also functions as a growth hormone-releasing factor in the goldfish. Endocrinology. 1989;124:2509–2518. doi: 10.1210/endo-124-5-2509. [DOI] [PubMed] [Google Scholar]
- Martyniuk CJ, Feswick A, Spade DJ, Kroll KJ, Barber DS, Denslow ND. Effects of acute dieldrin exposure on neurotransmitters and global gene transcription in largemouth bass (Micropterus salmoides) hypothalamus. Neurotoxicology. 2010;31:356–366. doi: 10.1016/j.neuro.2010.04.008. [DOI] [PMC free article] [PubMed] [Google Scholar]
- Martyniuk CJ, Prucha MS, Doperalski NJ, Antczak P, Kroll KJ, Falciani F, Barber DS, Denslow ND. Gene expression networks underlying ovarian development in wild largemouth bass (Micropterus salmoides) PLoS ONE. 2013;8:e59093. doi: 10.1371/journal.pone.0059093. [DOI] [PMC free article] [PubMed] [Google Scholar]
- Martyniuk CJ, Spade DJ, Blum JL, Kroll KJ, Denslow ND. Methoxychlor affects multiple hormone signaling pathways in the largemouth bass (Micropterus salmoides) liver. Aquat. Toxicol. 2011;101:483–492. doi: 10.1016/j.aquatox.2010.12.002. [DOI] [PMC free article] [PubMed] [Google Scholar]
- Martyniuk CJ, Xiong H, Crump K, Chiu S, Sardana R, Nadler A, Gerrie ER, Xia X, Trudeau VL. Gene expression profiling in the neuroendocrine brain of male goldfish (Carassius auratus) exposed to 17α-ethinylestradiol. Physiol. Genomics. 2006;27:328–336. doi: 10.1152/physiolgenomics.00090.2006. [DOI] [PubMed] [Google Scholar]
- Oliveros JC. [accessed 04.06.13];VENNY. An interactive tool for comparing lists with Venn Diagrams. 2007 < http://bioinfogp.cnb.csic.es/tools/venny/index.html>.
- Padhi BK, Pelletiera G, Williams A, Berndt-Weis L, Yauk C, Bowers WJ, Chu I. Gene expression profiling in rat cerebellum following in utero and lactational exposure to mixtures of methylmercury, polychlorinated biphenyls and organochlorine pesticides. Toxicol. Lett. 2008;176:93–103. doi: 10.1016/j.toxlet.2007.08.016. [DOI] [PubMed] [Google Scholar]
- Pohl RJ, Fouts JR. A rapid method for assaying the metabolism of 7-ethoxyresorufin by microsomal subcellular fractions. Anal. Biochem. 1980;107:150–155. doi: 10.1016/0003-2697(80)90505-9. [DOI] [PubMed] [Google Scholar]
- Richter CA, Garcia-Reyero N, Martyniuk C, Knoebl I, Pope M, Wright-Osment MK, Denslow ND, Tillitt DE. Gene expression changes in female zebrafish (Danio rerio) brain in response to acute exposure to methylmercury. Environ. Toxicol. Chem. 2011;30:301–308. doi: 10.1002/etc.409. [DOI] [PMC free article] [PubMed] [Google Scholar]
- Schmitt CJ, Dethloff GM. Biomonitoring of Environmental Status and Trends (BEST) Program: selected methods for monitoring chemical contaminants and their effects in aquatic ecosystems. U.S. Geological Survey, Biological Resources Division; Columbia, MO: 2000. p. 81. Information and Technology, Report USGS/BRD-2000-0005. [Google Scholar]
- Schmitt CJ, Zajicek JL, May TW, Cowman DF. Organochlorine residues and elemental contaminants in U.S. freshwater fish, 1976–1986: National Contaminant Biomonitoring Program. Rev. Environ. Contam. Toxicol. 1999;162:43–104. doi: 10.1007/978-1-4612-1528-8_2. [DOI] [PubMed] [Google Scholar]
- Sepúlveda MS, Johnson WE, Higman JC, Denslow ND, Schoeb TR, Gross TS. An evaluation of biomarkers of reproductive function and potential contaminant effects in Florida largemouth bass (Micropterus salmoides floridanus) sampled from the St. Johns River. Sci. Total Environ. 2002;289:133–144. doi: 10.1016/s0048-9697(01)01029-4. [DOI] [PubMed] [Google Scholar]
- Tan SW, Meiller JC, Mahaffey KR. The endocrine effects of mercury in humans and wildlife. Crit. Rev. Toxicol. 2009;39:228–269. doi: 10.1080/10408440802233259. [DOI] [PubMed] [Google Scholar]
- USEPA Mercury in solids and solutions by thermal decomposition, amalgamation and atomic absorption spectrophotometry. Test Methods SW-846 Manual, Draft Update IVA, 7000 Series, Method. 2003;7473:17. [Google Scholar]
- Waye A, Trudeau VL. Neuroendocrine disruption: more than hormones are upset. J. Toxicol. Environ. Health B. 2011;14:270–291. doi: 10.1080/10937404.2011.578273. [DOI] [PMC free article] [PubMed] [Google Scholar]
- Wiener JG, Krabbenhoft DP, Heinz GH, Scheuhammer AM. Ecotoxicology of mercury. In: Hoffman DJ, Rattner BA, Burton GA Jr., Cairns J Jr, editors. Handbook of Ecotoxicology. CRC Press; Boca Raton, FL: 2003. pp. 409–464. [Google Scholar]
- Zar JH. Biostatistical analysis. third ed Prentice-Hall Inc; Upper Saddle River, NJ: 1996. [Google Scholar]
Associated Data
This section collects any data citations, data availability statements, or supplementary materials included in this article.