

Abstract
Purpose
Pilot study to demonstrate the clinical feasibility of using hyperspectral computed tomographic spectroscopy (HCTIS) to measure blood oxygen content in human retinal vessels.
Methods
All procedures were performed under a University of Southern California IRB approved protocol and after obtaining informed consent. Fifty-seven subjects with and without diabetic retinopathy were dilated for standard fundus photography. Fundus photographs and retinal vascular oxygen measurements (oximetry) were made using a custom made HCTIS coupled to a standard fundus camera. Oximetry measurements were made along arteries (Aox) and veins (Vox) within vessel segments that were 1–2 disc diameters from the optic disc.
Results
For all control subjects (n=45), mean Aox and Vox were 93±7% and 65±5% (p=0.001) respectively. For all diabetic subjects (n=12), mean Aox and Vox were 90±7% and 68±5% (p=0.001) respectively. In subjects with proliferative diabetic retinopathy, Aox was significantly lower and Vox was significantly higher than other groups (85±4% and 71±4% respectively; p=0.04, ANOVA). There was a highly significant difference in the arteriovenous (AV) difference between subjects with proliferative diabetic retinopathy and those in the control group (14% versus 26%; p=0.003).
Conclusions
HCTIS is a clinically feasible method for measurement and analysis of vascular oxygen content in retinal health and disease. The current study utilizes techniques relevant to oximetry however, the breadth of spectral data available through the HCTIS may be applicable to studying other anatomical and functional features of the retina in health and disease.
Keywords: retina, oximetry, oxygen, hyperspectral, human, vessels
Introduction
Retinal vascular diseases are a major cause of vision loss in the world. Unfortunately, our understanding of the role of the retinal vasculature in the pathophysiology of these diseases is far from complete. Noninvasive measurement of retinal vascular oxygen saturation (oximetry) is a relatively novel method that may improve our understanding of retinal vascular disease by allowing quantitation of arterial and venous oxygen saturation at various stages of disease.[1–5] For example, in diabetic retinopathy hypoxic-ischemic damage to the retina is postulated as one possible mechanism of disease progression. Therefore, measurements of intravascular oxygen content at various stages of diabetic retinopathy may reveal diagnostically relevant findings that can better predict disease progression. These kinds of oximetry measurements have been demonstrated by analysis of specific wavelengths of reflected light from oxygenated and deoxygenated hemoglobin within retinal vessels.[1–22] While a number of oximetry methods have been demonstrated, very few have been applied in a clinical setting with enough samples to generate a normative data set. [20–25,32,33]
Our group has successfully developed a novel oximetry method using hyperspectral computed tomographic imaging spectroscopy (HCTIS) and successfully applied it in animal models of retinal vascular disease. [20,21] While other oximetry methods are available, HCTIS is notably different in that :
HCTIS provides a large amount of spectral information upon which to base measurements. (Typically > 20 spectral bands per image).
HCTIS provides information that may be relevant to measurement of many spectral features of the retina in addition to oximetry (e.g. pigmented lesions, optic disc perfusion, macular pigment density, RPE pigmentation)
HCTIS is easily adaptable to standard fundus cameras without the need for laser or confocal illumination.
HCTIS oximetry measurements show a strong correlation with systemic measurements of oxygen saturation under physiologic conditions. [21] Experimentally induced transient retinal ischemia has demonstrated reproducible variations in retinal oxygen content confirming that vascular oxygen content fluctuates under conditions where blood flow is compromised and that HCTIS can reliably capture these changes.[20,21] These studies have demonstrated reliable and reproducible oximetry measurements in retinal vessels using HCTIS and suggest that application of this method in humans may yield useful diagnostic measurements.
In this paper, we use HCTIS methodology to perform in vivo measurements of intravascular oxygen content in normal and diabetic subjects for the first time. This is a proof-of-principal study and the goal of our report is to:
Demonstrate the feasibility of this method by making oximetry measurements in non-diseased control population and
To use this method to study the variability in retinal vascular oxygen content among those with a proliferative retinopathy (diabetes) that is widely believed to be associated with hypoxic-ischemic insults to the retina.
Materials and Methods
Human subjects were recruited from the Los Angeles Latino Epidemiological Study (LALES) using a protocol approved by the Institutional Review Board (IRB) of the study. All procedures and exams were performed with the full informed consent of the subjects. Subjects who agree to undergo HCTIS measurements were imaged as described below with a prototype HCTIS device (Figure 1) in addition to the standard clinical examination and imaging protocols of the LALES study as described elsewhere [34]. Data collected on each subject included gender, age, HgA1c, blood pressure, visual acuity, presence or absence of diabetic retinopathy, stage of diabetic retinopathy, history of treatment for retinopathy, and color fundus photographs. Control subjects were limited to subjects with refractive error less than +/− 4D, mild-moderate cataracts, and no other history of ocular disease. Exclusion criteria include any media opacity preventing a clear view of the posterior pole.
Figure 1.

Hyperspectral computed tomographic imaging spectrometer (HCTIS) mounted on top of a standard Zeiss FF450 fundus camera. The HCTIS device is small and easily adaptable to the top port of the fundus camera. Images are acquired using the standard flash and trigger mechanism on the fundus camera. Images are saved on a laptop computer (not shown). Image processing and analysis are done with custom software as described previously [20–22].
Hyperspectral images were obtained through dilated pupils with a custom-made hyperspectral camera attached to the accessory port of a standard, commercially available Zeiss FF450 fundus camera as previously described (Ref [21,22] and Figure 1). Briefly, the HCTIS can acquire approximately 76 spectral bands (450–700nm; 4nm band resolution) within the duration of a standard fundus photograph. Images are acquired by a digital camera and stored on a computer using custom image acquisition software. The calculation of intravascular oxygen content (oximetry) for arteries (Aox) and veins (Vox) was performed using a modified Lambert-Beer approximation of the vessel optical density as described in detail elsewhere.[21] Retinal oximetry was modeled as a least-squares approximation of 28 wavelengths from the oxy- and deoxyhemoglobin spectra.[21] In vivo calibration and detailed description of the oximetry methods have been reported elsewhere.[20–22] Results are displayed as pseudocolored oximetry maps where red represents 100% oxygen saturation and blue represents 0% saturation.
Statistics
Data are presented as standard deviations of the mean unless indicated otherwise. Comparisons were made between the mean oximetry measurements of the retinal artery and vein both within and among groups as described in the figure legends. A paired, two-tailed Student t-test was used for analysis of the oxygen saturation difference between all pairs of vessels. A one-way ANOVA was used for comparison of means between groups.
Results
The study population had 57 subjects consisting of 45 controls and 12 diabetic subjects. The age range of the population was 35–85 years. The overall study population was 30% male. Table 1 summarizes the demographic and biometric features of the study population by group. Overall, the study subgroups were not significantly different in any parameters except for HgA1c and visual acuity. Diabetic subjects had significantly higher HgA1c of 7.8 ± 1.8 compared to 5.8 ± 0.9 for controls (p<0.01). Diabetic subjects also had significantly worse baseline visual acuity (p<0.01; see Table 1). All patients with proliferative diabetic retinopathy had a history of ablative laser therapy and were quiescent at the time of imaging. No patients had vitreous hemorrhage or active neovascularization at the time of imaging. We did not perform routine fluorescein angiograms in this study to identify potential areas of nonperfusion as this invasive procedure was not indicated for most patients and wide-field imaging was not available at the study location sites.
Table 1.
Demographics and Baseline Features of Study Population
| Control (n=45) | Diabetic (n=12) | p-value | |
|---|---|---|---|
| Mean Age | 61 ± 9 | 60 ± 6 | 0.47 |
| % Male | 28% | 25% | -- |
| Mean Systolic BP | 130 ± 16 | 133 ± 16 | 0.82 |
| Mean Diastolic BP | 73 ± 10 | 74 ± 9 | 0.61 |
| Mean HgA1c | 5.8 ± 0.9 | 7.8 ± 1.8 | <0.01 |
| Visual Acuity (LogMAR) | 0 ± 0.1 | 0.2 ± 0.2 | <0.01 |
| Mean IOP | 15 ± 2.6 | 14 ± 5.1 | 0.41 |
| Mean Refraction (±Diopters) | 0.2 ± 1.3 | 0.5 ± 1.1 | 0.56 |
| Mean Aox | 93 ± 7% | 90 ± 7% | 0.35 |
| Mean Vox | 65 ± 5% | 68 ± 5% | 0.12 |
BP = Blood pressure; IOP = Intraocular Pressure; Aox = arterial oxygen saturation; Vox = Venous oxygen saturation
Figures 2 and 3 illustrate representative pseudocolored oximetry data from individual subjects. Figure 2 shows pseudocolored oximetry images from the retinal arcades from two subjects. Figure 3 shows similar data from the vessels at the disc. The data is summarized in Figure 4 for all groups. In control subjects, mean Aox and Vox were 93±7% and 65±5% (p=0.001) respectively. In diabetic subjects, mean Aox and Vox were 90±7% and 68±5% (p=0.001) respectively. Analysis of variance demonstrated significant difference between the arterial and venous oxygen measurements of the groups. In subjects with proliferative diabetic retinopathy, arterial measurements were significantly lower and venous oximetry measurements were higher than other groups (p=0.04). This finding was confirmed by a highly significant difference in the arteriovenous (AV) difference between subjects with proliferative diabetic retinopathy and those in the control group (14% versus 26%; p=0.003, see Figure 5).
Figure 2.

Oximetry measurements from human retinal vessels in two representative subjects. (A,D) Monochromatic images of the vascular arcades. (B,E) Pseudocolored oximetry images of the retinal vessels in panels A and B. Red=100% saturation. Blue=0% saturation. (C,F) Illustration of the vessel segments used to obtain average oximetry measurements from vessels. The area in black represent the manually selected vessel segment from which oxygen saturation values were averaged for this particular image. Any segment can be chosen manually per the users preference. In most cases, multiple vessel segments are chosen and averaged to ensure the reproducibility of the results. The non-shaded vessel segments in images C and F are purposely not selected for averaging to demonstrate the manual vessel segmentation method used in this paper.
Figure 3.

Oximetry measurements from human retinal vessels overlying the disc and periphery in three representative subjects. (A,E) Standard color photographs of the disc and (G) periphery. (B,C) Monochromatic images of the vascular arcades from panel A. Note the decreased absorbance of retinal arteries at 600nm compared to 548nm (red arrows). (D,F,H) Pseudocolored oximetry images of the retinal vessels in panels A, E and G. Red=100% saturation. Blue=0% saturation. Pseudocoloring around the margin of the disc in panel F represents signal artifact from the sharp delineation between the disc and surrounding retina and is not representative of the local oximetry.
Figure 4.

Summary data of Aox and Vox measurements in normal and diabetic (DM,NPDR,PDR) human subjects. Red=Aox. Blue=Vox. There was a significant difference (**) between Aox and Vox within each group (p=0.0001 for all groups including PDR where p=0.003 by Student T-test). There was also a significant difference in the Aox and Vox among the groups (p=0.04) using ANOVA.
Figure 5.
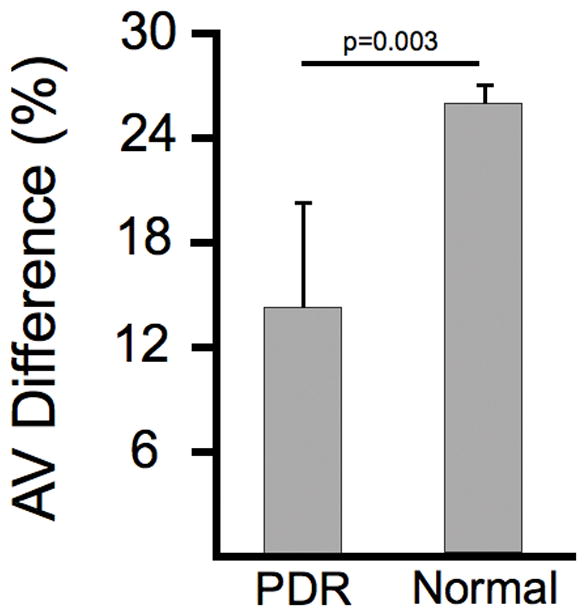
The arteriovenous (AV) difference was 26% in normal subjects and 14% in subjects with PDR. This difference was statistically significant (p=0.003).
Comparison of the Aox and Vox based on demographic variables including age and gender did not reveal any significant differences in control or diseased subjects (Figure 6). Although our control subject data set was not sufficient to perform a regression based on age, comparison of the Aox and Vox between those control subjects less than 60 and those greater than 60 years of age did not demonstrate any significant difference. Larger studies are needed to provide a definitive correlation between age, gender and oximetry measurements.
Figure 6.

There was no difference between the Aox and Vox among males and females within any group. There was also no difference in Aox and Vox between those normal subjects age < 60 and those age > 61 (data not shown for age).
Discussion
In the present study, we demonstrate the feasibility of performing HCTIS based spectral measurements in the human eye by measuring retinal vascular oxygen content. We demonstrate significant variations of retinal vascular oxygen content among normal subjects and diabetics using the spectral data available from this method.[35] The HCTIS oximetry method has been previously validated in animal models [20–22,35,36] and these data are the first human data obtained by this method. In the retinal literature, measurements of retinal vascular oxygen content have been difficult due to technical limitations in speed of data acquisition and computational analysis of large data sets [21,37] which have been overcome with this method. Our study did not demonstrate any adverse events and confirms that the HCTIS method can produce reliable and reproducible results in a human population of patients.
The variability in the AV difference in advanced diabetic patients is interesting and has some precedent from results of past oximetry methods [25,29] [38] [39]. The reason for the decrease in AV difference and increase in venous saturation is not clear. Some explanations include (1) increased arteriorvenous shunting secondary to large areas of capillary nonperfusion in advanced diabetic patients (2) decreased oxygen utilization by “sick” retinal tissue or (3) decreased oxygen delivery. It is also possible that the differences we report are secondary to ablative laser therapy and not necessarily a direct result of the disease process since all patients with PDR had already received pan-retinal photocoagulation. It is not possible to thoroughly evaluate all these possibilities without detailed and simultaneous studies of retinal blood flow and wide-field fluorescein angiography which are not possible with any retinal oximeters.
Oximetry measurements are inherently confounded by many factors including media clarity, vessel size, retinal pigmentation and scatter.[1,21] Previous work has demonstrated the advantages of the hyperspectral computed tomographic imaging (HCTIS) method used in this study. In the context of this paper, “hyperspectral” refers to the simultaneous acquisition of spectra from 450–700nm with ~4nm spectral resolution using a two dimensional diffraction grating and computed tomographic imaging algorithms.[40,41] This method provides excellent spectral, spatial and temporal coregistration in vivo compared to devices that rely on spectral or spatial scanning.[21] This hyperspectral system is mounted on a commercially available fundus camera and demonstrates reliable and reproducible high resolution measurements of hemoglobin oxygen saturation within retinal microvasculature in vivo.[20,21] These measurements are resolved over the duration of standard fundus flash photography and within vessels as small as ~50 microns wide.
In conclusion, this study utilizes a novel technique (HCTIS) to demonstrate variations in intravascular oxygen content among normal and diseased subjects. The advantages of the HCTIS methodology include the adaptability of the device to currently available fundus cameras, the broad range of spectral data that is collected, and the detailed oximetry maps that are generated. Although the study size is small, the data demonstrate decreased arteriovenous difference in advanced diabetic subjects and provide useful normative data for future studies and comparison with other oximetry methods. Oximetry maps can potentially be applied to many diseases and may help identify ischemic or pre-ischemic retinal areas, vascular shunting, and vascular stasis syndromes among others. Further investigation with HCTIS may provide novel diagnostic information in the evaluation and management of ischemic retinal diseases. Ultimately, it may be possible to use changes in retinal vascular oxygen content as diagnostic predictors of disease progression. By extension, oximetry findings may also be potentially useful for targeting of ablative laser therapy to ischemic retina rather than the current pan-retinal ablation that is commonly performed. Future studies will help shed light on these possibilities.
Summary Statement.
This study utilizes a sophisticated form of reflectance spectroscopy (hyperspectral computed tomographic spectroscopy; HCTIS) to study the intravascular oxygen content of retinal blood vessels. The method is validated by demonstrating variations in intravascular oxygen content among normal and diabetic subjects. We show that diabetic subjects with proliferative disease have a decreased arteriovenous oxygen gradient compared to normal subjects. This method may be applicable to many retinal vascular diseases and may be potentially adapted to study other spectral features of the retina (e.g. pigmented lesions).
Acknowledgments
Authors would like to acknowledge the NIH/NEI (U10-EY-11753 and Core Biostatistics Module) and the NSF (EEC-0310723) for funding support of this project.
Footnotes
AHK and MSH have intellectual property related to the subject matter of this manuscript. GM is an employee of Reichert Technologies which has a commercial interest in the subject matter of this manuscript.
Author Contribution Statements:
M.S.H. and A.H.K. assisted in the development and refinement of the hyperspectral computed tomographic imaging spectrometer for these experiments. A.H.K. and R.V. were responsible for the experimental design, experimental execution, data analysis, and manuscript preparation. S.S. and G.R.L.J. helped with experimental execution, data analysis and manuscript preparation. G.M. was responsible for development of the reconstruction algorithms and imaging software. G.C. helped with manuscript preparation and data analysis. All authors reviewed the manuscript and contributed to revisions.
References
- 1.Harris A, Dinn RB, Kagemann L, Rechtman E. A review of methods for human retinal oximetry. Ophthalmic Surg Lasers Imaging. 2003;34(2):152–164. [PubMed] [Google Scholar]
- 2.Gloster J. Fundus oximetry. Exp Eye Res. 1967;6(3):187–212. doi: 10.1016/s0014-4835(67)80032-0. [DOI] [PubMed] [Google Scholar]
- 3.Hickam JB, Frayser R, Ross JC. A study of retinal venous blood oxygen saturation in human subjects by photographic means. Circulation. 1963;27:375–385. doi: 10.1161/01.cir.27.3.375. [DOI] [PubMed] [Google Scholar]
- 4.Cohen AJ, Laing RA. Multiple scattering analysis of retinal blood oximetry. IEEE Trans Biomed Eng. 1976;23(5):391–400. doi: 10.1109/tbme.1976.324650. [DOI] [PubMed] [Google Scholar]
- 5.Laing RA, Cohen AJ, Friedman E. Photographic measurements of retinal blood oxygen saturation: falling saturation rabbit experiments. Invest Ophthalmol. 1975;14(8):606–610. [PubMed] [Google Scholar]
- 6.Delori FC. Noninvasive technique for oximetry of blood in retinal vessels. Appl Opt. 1988;27(6):1113–1125. doi: 10.1364/AO.27.001113. [DOI] [PubMed] [Google Scholar]
- 7.Khoobehi B, Beach JM, Kawano H. Hyperspectral imaging for measurement of oxygen saturation in the optic nerve head. Invest Ophthalmol Vis Sci. 2004;45(5):1464–1472. doi: 10.1167/iovs.03-1069. [DOI] [PubMed] [Google Scholar]
- 8.Hammer M, Vilser W, Riemer T, Schweitzer D. Retinal vessel oximetry-calibration, compensation for vessel diameter and fundus pigmentation, and reproducibility. J Biomed Opt. 2008;13(5):054015. doi: 10.1117/1.2976032. [DOI] [PubMed] [Google Scholar]
- 9.Hardarson SH, Harris A, Karlsson RA, et al. Automatic retinal oximetry. Invest Ophthalmol Vis Sci. 2006;47(11):5011–5016. doi: 10.1167/iovs.06-0039. [DOI] [PubMed] [Google Scholar]
- 10.Beach JM, Schwenzer KJ, Srinivas S, Kim D, Tiedeman JS. Oximetry of retinal vessels by dual-wavelength imaging: calibration and influence of pigmentation. J Appl Physiol. 1999;86(2):748–758. doi: 10.1152/jappl.1999.86.2.748. [DOI] [PubMed] [Google Scholar]
- 11.Gorman A, Fletcher-Holmes DW, Harvey AR. Generalization of the Lyot filter and its application to snapshot spectral imaging. Opt Express. 2010;18(6):5602–5608. doi: 10.1364/OE.18.005602. [DOI] [PubMed] [Google Scholar]
- 12.Nourrit V, Denniss J, Muqit MM, et al. High-resolution hyperspectral imaging of the retina with a modified fundus camera. J Fr Ophtalmol. 2010;33(10):686–692. doi: 10.1016/j.jfo.2010.10.010. [DOI] [PubMed] [Google Scholar]
- 13.Nelson DA, Krupsky S, Pollack A, et al. Special report: Noninvasive multi-parameter functional optical imaging of the eye. Ophthalmic Surg Lasers Imaging. 2005;36(1):57–66. [PubMed] [Google Scholar]
- 14.Hirohara YOY, Mihashi T, Yamaguchi T, Nakazawa N, Tsuruga Y, Aoki H, Maeda N, Uchida I, Fujikado T. Validity of retinal oxygen saturation analysis: Hyperspectral imaging in visible wavelength with fundus camera and lIquid crystal wavelength tunable filter. Optical Reviews. 2007;14(3):151–158. [Google Scholar]
- 15.Ashman RA, Reinholz F, Eikelboom RH. Oximetry with a multiple wavelength SLO. Int Ophthalmol. 2001;23(4–6):343–346. doi: 10.1023/a:1014406831412. [DOI] [PubMed] [Google Scholar]
- 16.Denninghoff KR, Smith MH, Lompado A, Hillman LW. Retinal venous oxygen saturation and cardiac output during controlled hemorrhage and resuscitation. J Appl Physiol. 2003;94(3):891–896. doi: 10.1152/japplphysiol.01197.2001. [DOI] [PubMed] [Google Scholar]
- 17.Hammer M, Leistritz S, Leistritz L, Schweitzer D. Light paths in retinal vessel oxymetry. IEEE Trans Biomed Eng. 2001;48(5):592–598. doi: 10.1109/10.918598. [DOI] [PubMed] [Google Scholar]
- 18.Hammer H, Schweitzer D, Thamm E, Kolb A, Strobel J. Scattering properties of the retina and the choroids determined from OCT-A-scans. Int Ophthalmol. 2001;23(4–6):291–295. doi: 10.1023/a:1014430009122. [DOI] [PubMed] [Google Scholar]
- 19.Shahidi M, Wanek J, Blair NP, Little DM, Wu T. Retinal tissue oxygen tension imaging in the rat. Invest Ophthalmol Vis Sci. 2010;51(9):4766–4770. doi: 10.1167/iovs.09-4710. [DOI] [PMC free article] [PubMed] [Google Scholar]
- 20.Jaime GR, Kashani AH, Saati S, Martin G, Chader G, Humayun MS. Acute Variations in retinal vascular oxygen content in a rabbit model of retinal venous occlusion. PLoS One. 2012;7(11):e50179. doi: 10.1371/journal.pone.0050179. [DOI] [PMC free article] [PubMed] [Google Scholar]
- 21.Kashani AH, Kirkman E, Martin G, Humayun MS. Hyperspectral computed tomographic imaging spectroscopy of vascular oxygen gradients in the rabbit retina in vivo. PLoS One. 2011;6(9):e24482. doi: 10.1371/journal.pone.0024482. [DOI] [PMC free article] [PubMed] [Google Scholar]
- 22.Johnson WR, Wilson DW, Fink W, Humayun M, Bearman G. Snapshot hyperspectral imaging in ophthalmology. J Biomed Opt. 2007;12(1):014036. doi: 10.1117/1.2434950. [DOI] [PubMed] [Google Scholar]
- 23.Hammer M, Vilser W, Riemer T, et al. Retinal venous oxygen saturation increases by flicker light stimulation. Invest Ophthalmol Vis Sci. 2010 doi: 10.1167/iovs.10-5537. [DOI] [PubMed] [Google Scholar]
- 24.Hardarson SH, Basit S, Jonsdottir TE, et al. Oxygen saturation in human retinal vessels is higher in dark than in light. Invest Ophthalmol Vis Sci. 2009;50(5):2308–2311. doi: 10.1167/iovs.08-2576. [DOI] [PubMed] [Google Scholar]
- 25.Hammer M, Vilser W, Riemer T, et al. Diabetic patients with retinopathy show increased retinal venous oxygen saturation. Graefes Arch Clin Exp Ophthalmol. 2009;247(8):1025–1030. doi: 10.1007/s00417-009-1078-6. [DOI] [PubMed] [Google Scholar]
- 26.Traustason S, Hardarson SH, Gottfredsdottir MS, et al. Dorzolamidetimolol combination and retinal vessel oxygen saturation in patients with glaucoma or ocular hypertension. Br J Ophthalmol. 2009;93(8):1064–1067. doi: 10.1136/bjo.2008.148460. [DOI] [PubMed] [Google Scholar]
- 27.Hardarson SH, Stefansson E. Oxygen saturation in central retinal vein occlusion. Am J Ophthalmol. 2010;150(6):871–875. doi: 10.1016/j.ajo.2010.06.020. [DOI] [PubMed] [Google Scholar]
- 28.Hardarson SH, Elfarsson A, Agnarsson BA, Stefansson E. Retinal oximetry in central retinal artery occlusion. Acta Ophthalmol. 2012 doi: 10.1111/j.1755-3768.2012.02393.x. [DOI] [PubMed] [Google Scholar]
- 29.Hardarson SH, Stefansson E. Retinal oxygen saturation is altered in diabetic retinopathy. Br J Ophthalmol. 2012;96(4):560–563. doi: 10.1136/bjophthalmol-2011-300640. [DOI] [PubMed] [Google Scholar]
- 30.Hardarson SH, Stefansson E. Oxygen saturation in branch retinal vein occlusion. Acta Ophthalmol. 2011 doi: 10.1111/j.1755-3768.2011.02109.x. [DOI] [PubMed] [Google Scholar]
- 31.Mordant DJ, Al-Abboud I, Muyo G, et al. Validation of Human Whole Blood Oximetry Using A Hyperspectral Fundus Camera with a Model Eye. Invest Ophthalmol Vis Sci. 2011 doi: 10.1167/iovs.10-6217. [DOI] [PubMed] [Google Scholar]
- 32.Geirsdottir A, Palsson O, Hardarson SH, Olafsdottir OB, Kristjansdottir JV, Stefansson E. Retinal vessel oxygen saturation in healthy individuals. Invest Ophthalmol Vis Sci. 2012;53(9):5433–5442. doi: 10.1167/iovs.12-9912. [DOI] [PubMed] [Google Scholar]
- 33.Palsson O, Geirsdottir A, Hardarson SH, Olafsdottir OB, Kristjansdottir JV, Stefansson E. Retinal oximetry images must be standardized: a methodological analysis. Invest Ophthalmol Vis Sci. 2012;53(4):1729–1733. doi: 10.1167/iovs.11-8621. [DOI] [PubMed] [Google Scholar]
- 34.Varma R, Paz SH, Azen SP, et al. The Los Angeles Latino Eye Study: design, methods, and baseline data. Ophthalmology. 2004;111(6):1121–1131. doi: 10.1016/j.ophtha.2004.02.001. [DOI] [PubMed] [Google Scholar]
- 35.Ameri H, Ratanapakorn T, Rao NA, Chader GJ, Humayun MS. Natural course of experimental retinal vein occlusion in rabbit; arterial occlusion following venous photothrombosis. Graefes Arch Clin Exp Ophthalmol. 2008;246(10):1429–1439. doi: 10.1007/s00417-008-0878-4. [DOI] [PubMed] [Google Scholar]
- 36.Ameri H, Kim JG, Ratanapakorn T, Chader GJ, Humayun MS. Intravitreal and subretinal injection of tissue plasminogen activator (tPA) in the treatment of experimentally created retinal vein occlusion in rabbits. Retina. 2008;28(2):350–355. doi: 10.1097/IAE.0b013e318140580c. [DOI] [PubMed] [Google Scholar]
- 37.Schweitzer D, Hammer M, Kraft J, Thamm E, Konigsdorffer E, Strobel J. In vivo measurement of the oxygen saturation of retinal vessels in healthy volunteers. IEEE Trans Biomed Eng. 1999;46(12):1454–1465. doi: 10.1109/10.804573. [DOI] [PubMed] [Google Scholar]
- 38.Michelson G, Scibor M. Intravascular oxygen saturation in retinal vessels in normal subjects and open-angle glaucoma subjects. Acta Ophthalmol Scand. 2006;84(3):289–295. doi: 10.1111/j.1600-0420.2005.00631.x. [DOI] [PubMed] [Google Scholar]
- 39.Olafsdottir OB, Hardarson SH, Gottfredsdottir MS, Harris A, Stefansson E. Retinal oximetry in primary open-angle glaucoma. Invest Ophthalmol Vis Sci. 2011;52(9):6409–6413. doi: 10.1167/iovs.10-6985. [DOI] [PubMed] [Google Scholar]
- 40.Descour MR, Dereniak EL. Nonscanning, no-moving parts imaging spectrometer. Proc SPIE. 1995;2480:48–64. [Google Scholar]
- 41.Descour MR, Dereniak EL. Computed-tomography imaging spectrometer experimental calibration and reconstruction results. Appl Opt. 1995;34:4817–4826. doi: 10.1364/AO.34.004817. [DOI] [PubMed] [Google Scholar]