

Abstract
Objective
Neonatal abstinence syndrome (NAS) from in utero opioid exposure is highly variable with genetic factors appearing to play an important role. Epigenetic changes in cytosine:guanine (CpG) dinucleotide methylation can occur after drug exposure and may help to explain NAS variability. We correlated DNA methylation levels in the mu-opioid receptor (OPRM1) promoter in opioid-exposed infants and correlate them with NAS outcomes.
Study design
DNA samples from cord blood or saliva were analyzed for 86 infants being treated for NAS according to institutional protocol. Methylation levels at 16 OPRM1 CpG sites were determined and correlated with NAS outcome measures, including need for treatment, treatment with >2 medications, and length of hospital stay. We adjusted for co-variates and multiple genetic testing.
Results
Sixty-five percent of infants required treatment for NAS, and 24% required ≥2 medications. Hypermethylation of the OPRM1 promoter was measured at the −10 CpG in treated versus non-treated infants [adjusted difference δ=3.2% (95% CI 0.3–6.0%), p=0.03; NS after multiple testing correction]. There was hypermethylation at the −14 [δ=4.9% (95% CI 1.8–8.1%), p=0.003], −10 [δ=5.0% (95% CI 2.3–7.7%), p=0.0005)], and +84 [δ=3.5% (95% CI 0.6 – 6.4), p=0.02] CpG sites in infants requiring ≥2 medications which remained significant for −14 and −10 after multiple testing correction.
Conclusions
Increased methylation within the OPRM1 promoter is associated with worse NAS outcomes, consistent with gene silencing.
Keywords: DNA methylation, NAS, opioids, genetics, OPRM1
Neonatal abstinence syndrome (NAS), a constellation of signs and symptoms due to withdrawal from in-utero opioid exposure is a growing problem, now affecting 5.6 per 1000 births.(1–2) The incidence of NAS has tripled in the past decade, affecting 60–80% of infants born to mothers on methadone, buprenorphine, or other prescription narcotics.(1) NAS is associated with long hospitalizations, extensive pharmacological therapy and variable newborn recovery with increased healthcare costs.(3–4) Much of what influences the variability in the incidence and severity of NAS remains unknown, with genetic factors appearing to be important.(5–7)
Genetic factors contribute to an individual’s risk for opiate addiction, with candidate genes identified as modulators of opioid therapy in dependent adults.(8–9) Specifically, the mu-opioid receptor gene OPRM1 is the primary site of action of endogenous and exogenous opioids. A number of studies have associated single-nucleotide polymorphisms (SNPs) in this gene with an increased risk for substance abuse in adults.(9–12) Common variants such as the 118A>G rs1799971 SNP are known to have functional consequences.(11–12) In the first study examining genetic variants in infants with NAS, infants with the OPRM1 rs1799971 AG or GG genotype had improved NAS outcomes compared with infants with the AA genotype.(6)
In addition to changes in the DNA sequence, changes in gene expression due to epigenetic modifications may influence NAS. Epigenetic changes are important in adults and triggered by the use of an addictive drug, leading to drug cravings and a diminished response to pharmacotherapy.(13) Cytosine methylation of DNA is a common epigenetic mechanism that occurs through the addition of a methyl group to the cytosine residues of cytosine:guanine (CpG) dinucleotides. Chronic opioid exposure may lead to modifications of methylation levels at specific CpG sites within promoter regions of a gene, potentially leading to an increase or decrease in gene expression.(13–14) Prior studies of OPRM1 have demonstrated that an increase in promoter methylation is associated with a decrease in protein expression of the mu-opioid receptor.(15). In addition, hypermethylation at selected CpG sites within OPRM1 was present in opioid dependent adults but not in control individuals.(16–18) These changes have also been identified in sperm of opioid dependent males, suggesting heritability.(16)
Epigenetic changes in OPRM1 have not been examined in NAS. Variability in the severity of NAS may be dependent on different methylation patterns, thus influencing opioid receptor system responsiveness to opioids. The purpose of this study is to examine CpG methylation patterns within the OPRM1 promoter region in infants chronically exposed to in-utero opioids and to correlate these epigenetic changes with NAS outcome measures.
METHODS
Eighty-six infants ≥ 36 weeks gestational age were enrolled at Tufts Medical Center and affiliated nurseries (Brockton Hospital, Melrose Wakefield Hospital, and Lowell General Hospital) and Eastern Maine Medical Center (EMMC) between 2011 and 2012. This study had the same infant DNA samples and dataset from a previously published study examining SNP genotype in the OPRM1 gene in infants with NAS.(6) Eligibility criteria included maternal prescribed methadone or buprenorphine exposure in-utero for at least 30 days prior to delivery, singleton pregnancies, and infants who were medically stable after delivery without other significant complications. The study was approved by the Institutional Review Boards of all sites with written informed consent.
DNA was sampled from either cord blood (PAXgene Blood DNA tube) or saliva (Oragene OG-250 DNA collection kit with CS-1 sponges).(19–20) If a cord blood sample was not available at the time of delivery, a saliva sample was collected at any point during the infant’s hospitalization. We reviewed the infant and maternal charts for demographic information, medical diagnoses, and details of maternal substance abuse treatment and NAS outcome measures. Infants were assessed and treated according to comparable institutional NAS treatment protocols. All infants were scored using a modified Finnegan scale.(21) Infants with 3 consecutive scores ≥8 or 2 consecutive scores ≥10 were started on first-line opioid replacement therapy, which was neonatal morphine solution (0.5 – 1.0mg/kg/day) at the Tufts institutions and methadone (0.5 – 1.0mg/kg/day) at EMMC. Second-line therapy was of phenobarbital (Tufts) or clonazepam (EMMC). Infants were weaned from morphine, methadone, and clonazepam as inpatients and monitored for 48 hours prior to discharge home. Phenobarbital weaning was completed as an outpatient.
Laboratory Methods
DNA Isolation
Blood and saliva samples were sent to the Tufts Medical Center Clinical and Translational Research Center (CTRC) Core Laboratory for DNA isolation. Blood samples collected in PaxGene DNA tubes (Qiagen, Valencia, CA) were frozen within 14 days at −70°C until DNA isolation was performed. Salivary specimens were stored at room temperature before DNA extraction using the prepIT-L2P kit (DNA Genotek, Ottawa, ON, Canada). DNA was genotyped for the OPRM1 118A>G (rs1799971, dbSNP database) SNP using established TaqMan technology (assay C_8950074_1, Life Technologies, Grand Island NY).
Bisulfite DNA Conversion
Genomic DNA (300 ng) was treated with sodium bisulfite using the EZ DNA Methylation Gold Kit #D5005 (Zymo Research, Orange, CA). The bisulfite-treated DNA was eluted in 20 μl M-Elution Buffer. The Human Methylated & Non-Methylated DNA Control Set (Zymo Research Cat# D5014) was mixed to create DNA with various percentages of methylation (0%, 25%, 50%, 75%, 100%) to monitor the efficiency of the bisulfite treatment.
OPRM1 CpG Methylation Analysis
Cord blood and saliva methylation levels were used as biomarkers for methylation levels occurring in the central nervous system. OPRM1 methylation analysis was conducted according to methods published by Nielsen et al with minor modifications (17). Two CpG islands were located from 400 nucleotides upstream to 1000 nucleotides downstream of the transcription start site in the OPRM1 promoter (Figure 1). The first CpG island is located from −97 to +27, labeled relative to the A of the ATG translation start site. We examined sixteen CpG dinucleotides located at nucleotide −93, −90, −80, −71, −60, −50, −32, −25, −18, −14, −10, +12, +23, +27, +53, and +84. The −18, −14, −10, +12 and +84 CpG sites are located at potential Sp1 transcription factor binding sites.
Figure 1. OPRM1 Promoter Region.
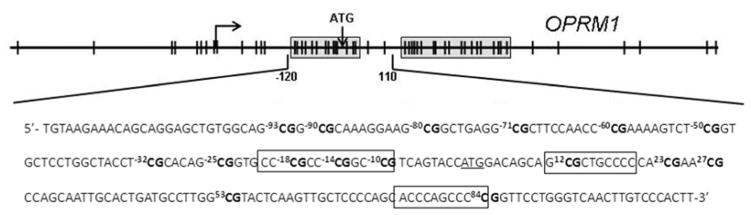
The OPRM1 gene promoter region is shown with the two CpG islands boxed in and CpG dinucleotides indicated as ∣. The major transcription start site is indicated by the arrow, located −253 upstream of the ATG translation start site. The sequence of the amplified CpG island is also shown with the 16 CpG sites analyzed for cytosine methylation (bold) and their position relative to the ATG translation start site (underlined) indicated. Three putative Sp1 transcription factor binding sites are boxed.
Primers for amplifying the upstream OPRM1 CpG island were as follows: 1) primer A: 5′-TTTTTTTTTGTTTTAGTTAGG-3′; 2) primer B: 5′-CAAATTACCATCTAAATAAA-3′; 3) primer C: 5′-TGTAAGAAATAGTAGGAGTTGTGGTAG-3′; and 4) primer D: 5′-AATAAAACAAATTAACCCAAAAACC-3′. The first amplification was performed with 1 μl bisulfite-treated DNA, 1 μM each of primers A and B, 250 μM each of dATP, dCTP, dGTP and TTP, 4 mM MgCl2, 0.625 units of HotStarTaq Plus DNA Polymerase (Qiagen, Valencia, CA), and Qiagen PCR Buffer in a final volume of 50 μl.. Amplification consisted of 5 min at 95°C, 40 cycles of 15 sec at 95°C, 15 sec at 52°C, and 30 sec at 72°C, followed by a final elongation step at 72°C f or 7 min. A nested PCR reaction was performed using the same conditions as above with 1 μl of the initial PCR product and primers C and D. The nested amplification consisted of 5 min at 95°C, 40 cycles of 15 sec at 95°C, 15 sec at 58°C, and 30 sec at 72°C, followed by a final elongation step at 72°C for 7 min.
Direct sequencing of OPRM1 CpG
Preparation for sequencing was according to Nielsen et al with minor modifications.(17) Briefly, unincorporated nucleotides and primers were treated by mixing 5 μl of the nested PCR reaction mixture with 2 μl ExoSAP-IT (USB Corp., Cleveland, Ohio) followed by incubation at 37°C for 15 min and 80°C for 15 min. For an appropriate concentration for sequencing (5–10 ng/μl), 1 μl of the ExoSAP-IT-treated DNA was diluted 1:50 with water. For sequencing, 2 μl of the diluted ExoSAP-IT-treated DNA was added to 5 μM primer C or D in a final volume of 7.6 μl. Sequencing was performed on an ABI 3130 XL sequencer (Applied Biosystems).
Determination of Percent DNA Methylation
Trace files (.ab1) were analyzed using the ESME version 3.2.1 software from Epigenomics AG (Berlin, Germany). The percent methylation calls by the ESME were visually inspected using the associated electropherograms generated by the ESME software. Electropherograms were reviewed twice for accuracy. The promoter region was analyzed for predicted transcription factor binding sites using TESS: Transcription Element Search System, Patch 1.0 and AliBaba 2.1.(22–23)
Statistical Analyses
Our primary outcome measure for NAS severity was need for any NAS pharmacologic treatment, with secondary outcome measures of treatment with ≥2 medications (yes/no) and length of stay. Because infants treated with ≥2 medications represent the most severe phenotype of NAS, this factor was selected as a key outcome measure. Total opioid treatment days correlated strongly with length of stay (r=0.92; P<0.001), thus opioid treatment days are not reported separately. We selected candidate variables for adjusted analyses by comparing treated versus non-treated infants in bivariable analysis using chi-square (test of independence) and independent sample t-tests. Breastfeeding (yes/no) was defined as any amount of mother’s milk consumed during the hospitalization as documented in the infant’s medical chart. Then we averaged methylation levels across 16 CpG sites for each subject and tested the association of the subject level average (mean) with potential co-variates using independent sample t-tests.
We tested the association of NAS outcome measures with level of methylation for each of the 16 CpG sites within the OPRM1 promoter region. Methylation levels were also compared among those infants who were treated with none, one, or two medications at each CpG site using ANOVA. Linear regression models were then created to adjust for co-variates associated with methylation levels or NAS outcomes with P<0.05 in bivariate analysis. Lastly, we applied the Benjamini and Hochberg method to account for the testing of 16 CpG sites in OPRM1 for each of the NAS outcomes.(24)
Genotype frequencies were assessed for differences from the HapMap CEU database using the chi-square test (goodness of fit) and for Hardy-Weinberg equilibrium.(25) Lastly, we used independent sample t-test to compare methylation levels based on genotype in the OPRM1 118A>G SNP using a dominant genetic model (AA genotype vs AG/GG genotypes). Statistical analyses were performed with R programming (2010).
RESULTS
Of the 86 infants, 84 (98%) were Caucasian and 70 (81%) were ≥38 weeks gestational age. Fifty-five (64%) of the infants were exposed to maternal methadone [mean dose at delivery 106 mg (95% CI 81 – 124)] and 31 (36%) were exposed to buprenorphine [mean dose at delivery 16 mg (95% CI 13 – 19)]. Sixty-seven (78%) of the infants also had concurrent in-utero nicotine exposure; 10 (12%) benzodiazepines, and 4 (5%) selective serotonin reuptake inhibitors (SSRIs). Average length of stay for all infants was 22 days (95% CI, 19–26 days); and for treated infants, 32 days (95% CI, 28–35 days). Fifty-six (65%) of all infants were treated for NAS with 38% of these infants also treated adjunctively with phenobarbital (n=16) or clonazepam (n=5).
Demographic variables were compared between treated and non-treated infants as shown in Table. Medical co-morbidities and maternal medical factors did not differ between the infants. Breastfed infants had decreased length of stay (16 vs 27 days; p<.001) and decreased need for any medical treatment for NAS (63% of non-treated versus 34% of treated infants were breastfed, p=.009). There were no significant differences when comparing Tufts and the affiliated hospitals with EMMC for NAS outcome measures. Maternal treatment and doses of these medications at delivery did not correlate with any NAS outcome measure.
DNA samples including 24 from cord blood and 62 from saliva. Methylation levels across the 16 CpG sites did differ between infant DNA sources with a higher mean level of methylation from cord blood compared with saliva samples [10.0% (95% CI 8.1 – 11.9) vs 6.7% (95% CI 5.5 – 7.9), p=0.003]. However, mean methylation levels did not differ based on DNA source at the −14, −10, and +84 CpG sites.
DNA Methylation Levels and Genotype
For the OPRM1 118A>G SNP (rs1799971), the genotype frequencies were: AA 0.71, AG 0.28, and GG 0.01, with corresponding allele frequencies of A = 0.85 and G = 0.15. Hardy-Weinberg equilibrium was not violated (p=.42) and there were no differences from the frequencies observed with the HapMap CEU population (p>0.05). There were no differences in methylation levels between genotypes at each of the 16 CpG sites.
DNA Methylation Levels and NAS Outcomes
Results for our primary outcome measure of need for any treatment for NAS by level of DNA methylation at each CpG site are shown in Figure 2. Methylation was increased at the −10 CpG in those infants receiving any treatment for NAS compared with non-treated infants in a model that adjusted for infant DNA source and breastfeeding [unadjusted difference 2.8% (3.0% vs 5.8%); adjusted difference δ=3.2% (95% CI 0.3 – 6.0%), p=0.03]. After adjustment for multiple testing, results were no longer significant. No additional CpG sites were found to be associated with need for treatment of NAS.
Figure 2.

Percent methylation of 16 CpG sites within the OPRM1 promoter in opioid-exposed infants who were treated (n=65) versus non-treated (n=21) for NAS. CpG sites in Sp1 transcription factor binding sites are indicated. * p<0.05 in bivariable analyses.
The need for treatment with ≥2 medications for NAS by level of DNA methylation at each of the 16 CpG sites is shown in Figure 3. Methylation was increased at the −14 [unadjusted difference 5% (5.2 vs 10.2%); adjusted δ=4.9% (95% CI 1.8 – 8.1%), p=0.003], −10 [unadjusted difference 5.0% (3.6 vs 8.6%); adjusted δ=5.0% (95% CI 2.3–7.7, p=0.0005)], and +84 [unadjusted difference 3.3% (1.7 vs 5.0%); adjusted δ=3.5% (95% CI 0.6 – 6.4%), p=0.02] CpG sites in those infants requiring ≥2 medications compared with those treated with 0 – 1 medication. Linear regression models were adjusted for infant DNA source and breastfeeding. Results for the −10 and −14 CpG sites remained significant after correction for multiple testing. These three CpG sites are located at putative Sp1 transcription factor binding sites (Figure 1).
Figure 3.

Percent methylation of 16 CpG sites within the OPRM1 promoter in opioid-exposed infants treated with ≥2 medications (n=21) versus <2 medications (n=65) for NAS. CpG sites in Sp1 transcription factor binding sites are indicated. * p<0.05 in bivariable analyses.
Although results were not significant after adjustment for multiple testing, a positive correlation was found between level of methylation and length of stay (r=0.27, p=0.03) at the −10 CpG site. In a model that adjusted for DNA source and breastfeeding, each 1% increase in methylation level corresponded to a 0.8 day increase in length of stay (95% CI 0.1 – 1.5 days, p=0.02). No other correlations were found with length of stay for the other CpG sites. Methylation levels also increased with the number of medications required to treat NAS [3.0% vs 4.6% vs 6.9% for 0, 1, and 2 medications respectively; p=0.05] in unadjusted analysis for the −10 CpG. The mean level of methylation for each subject averaging all 16 CpG sites did not correspond with any NAS outcome measures.
DISCUSSION
Our results are consistent with the prior studies evaluating the importance of the OPRM1 gene in opioid addiction and NAS. The common 118A>G rs1799971 SNP causes to an amino acid change resulting in a 3-fold increase in the binding affinity of the receptor with β-endorphin, altering the function of the hypothalamic-pituitary-adrenal axis, and vulnerability to addiction.(26–27) Data from animal models and in vivo studies indicate that the G allele is associated with a decrease in protein expression and gene expression.(28–29) We found that infants with NAS who carried at least one copy of this minor G allele had a shorter length of stay and were less likely to receive any treatment for NAS compared with infants who were homozygotes for the A allele, suggesting improved tolerance to the process of opioid withdrawal.(6)
In the present study, opioid exposed infants with a more severe phenotype of NAS had an increase in DNA methylation of three CpG sites in the OPRM1 promoter region. An increase in DNA methylation levels at the −14, −10, and +84 CpG sites were found in infants who required two or more medications to control withdrawal symptoms. The −14, −10, and +84 CpG sites are located at putative Sp1 transcription factor binding sites.(23) With an increased level of DNA methylation, Sp1 sites have a decreased binding affinity for their transcription factors which may lead to a decrease in gene expression.(30–31) In this case, infants with hypermethylation at these specific CpG sites may have down-regulated OPRM1 gene expression leading to reduced levels of the mu-opioid receptor. This in turn may lead to an increased need for opioid medications to control NAS symptoms. Our results do not show that the opioids caused the hypermethylation at the three CpG sites, but that the hypermethylation of the OPRM1 promoter region may influence NAS outcome measures. The impact of changes in methylation should be evaluated in future studies for correlations with the level of the mu-opioid receptor, as well as methylation levels in the mothers. The changes in methylation levels before and after treatment should also be evaluated to determine if opioid replacement alters any epigenetic changes in newborns with NAS.
Prior studies have also demonstrated that an increase in OPRM1 promoter methylation is associated with a decrease in protein expression of the mu-opioid receptor.(15) Nielsen found increased levels of methylation at the −18 and +84 CpG sites in the OPRM1 promoter, sites of putative Sp1 transcription factor binding, in lymphocytes of prior heroin addicts compared with controls.(17) They also found that methylation levels differed depending on ethnicity in former heroin addicts, with an increased level of methylation at the −14 site noted in Hispanics.(18) Chorbov and associates found hypermethylation at seven OPRM1 CpG sites in leukocyte DNA of male opioid addicts compared with controls.(16) Similar changes at the −10 site were measured in European Americans with alcohol dependence compared with controls.(32) Transgenerational effects of chronic opioid exposure have been demonstrated in animal models, suggesting that epigenetic changes in the mother due to opioid addiction may be passed on to her infant altering sensitivity to narcotics and the process of withdrawal.(33–34) The heritability of these changes is also supported by a study that evaluated sperm-derived DNA from opioid addicts, finding that methylation was increased at one CpG site within OPRM1.(16)
This study has a number of limitations. First, though the same NAS scoring system was used at all study centers, an intra-observer reliability program was not established between sites. Although the Finnegan scoring system is the gold standard, it remains subjective with the possibility for differences between institutions and individual providers. This study is also limited by a small sample size with the need for correction for multiple statistical comparisons, limiting our statistical power. Our sample size likely accounts for why more significant differences were not seen between treated and untreated infants. However, higher methylation levels were seen in those infants requiring ≥2 medications, representing the most severe NAS phenotype. The generalizability of our results is also limited by lack of ethnic variability as methylation levels vary depending on ethnic background.(18) However, our results are consistent with prior studies in opioid dependent Caucasian adults.(17)
The timing of the DNA samples varied with some samples collected prior to initiation and some during treatment with opioid medications for NAS, which may have influenced methylation levels. The source of DNA accounted for some of the variation in methylation, with differences seen in mean methylation levels between cord blood and saliva samples. Cord blood and saliva methylation levels can be considered as biomarkers for OPRM1 methylation in the central nervous system.(35) Although DNA quantity and quality are typically higher from cord blood compared with saliva or buccal cells, it is often difficult to obtain cord blood at the time of delivery from all subjects.(36) An increasing number of epigenetic studies have utilized saliva as a DNA source as it is readily available, can be followed serially, and is non-invasive.(35,37) DNA source was adjusted for in all of our multivariate models and results remained unchanged when DNA source was included in the models.
The identification of key genetic factors through early non-invasive testing that correlate with NAS severity can lead to future individualized treatment regimens and improved care for these infants. Infants with high risk genetic profiles could be treated more aggressively from birth, and those with low risk profiles could potentially be discharged home from the hospital earlier. Identifying similar genetic markers in the mothers and placentas also represent an opportunity for earlier identification of high-risk infants.
Table 1.
Demographics in infants treated versus not treated for NAS
| Variable | Non-Treated Infants n=30 No.(%) |
Treated Infants n=56 No.(%) |
P-Value |
|---|---|---|---|
|
| |||
| GA ≥38 weeks | 25 (83%) | 45 (80%) | 0.74c |
|
| |||
|
Birth Weight (kg) mean (95% CI) |
3.2 (3.0–3.4) | 3.2 (3.0–3.3) | 0.89d |
|
| |||
| Maternal Opioid Substitute | |||
| Methadone | 17 (57%) | 38 (68%) | 0.30c |
| Buprenorphine | 13 (43%) | 18 (32%) | |
|
| |||
|
Methadone Dose (mg)a mean (95% CI) |
100 (76–124) | 109 (72–146) | 0.57d |
|
Buprenorphine Dose (mg)a mean (95% CI) |
16 (11–20) | 16 (13–19) | 0.96d |
|
| |||
| Breastfedb | 19 (63%) | 19 (34%) | 0.009c |
|
| |||
| Concurrent Exposure | |||
| Cigarette Smoking | 22 (73%) | 45 (80%) | 0.45c |
| Benzodiazepines | 3 (10%) | 7 (13%) | 0.69c |
| SSRIs | 2 (7%) | 2 (4%) | 0.41c |
|
| |||
| Tufts & Affiliates | 16 (53%) | 35 (63%) | 0.41c |
| EMMC | 14 (47%) | 21 (38%) | |
Abbreviations: GA = gestational age; mg = milligrams; kg = kilograms; SSRI = selective serotonin re-uptake inhibitor; EMMC = Eastern Maine Medical Center
Mean daily dose at delivery;
breastfed to any extent;
P-value calculated by independent sample t-test;
P-value calculated by chi-square test of independence
Acknowledgments
We thank the medical and nursing staff of labor and delivery, mother-infant units, and neonatal units of Tufts Medical Center, Melrose Wakefield Hospital, Brockton Hospital, Lowell General Hospital, and Eastern Maine Medical Center. Specifically, we’d like to acknowledge Jennifer Curcuru and the Tufts Medical Center CTRC Core Laboratory for performing the DNA isolation and methylation studies; Karen Harvey-Wilkes, MD, Ozlem Kasaroglu, MD, Mario Cordova, MD, and Teresa Marino, MD from Tufts Medical Center; Hira Shrestha, BA, from Eastern Maine Medical Center; and Nicole Heller, MA, Beth Logan, PhD, and Deborah Morrison, MA, from the University of Maine for their assistance with enrollment and data collection.
Supported in by the National Institutes of Health (DA024806-01A2 [to M.H.], R01DA032889-01A1 [to J.D.], DA018197-05, DA026120 [both to D.N.]), Tufts Medical Center’s Natalie Zucker and Susan Saltonstall Grants (to E.W.), National Center for Advancing Translational Sciences (UL1 TR000073 through the Tufts Clinical and Translational Science Institute [to N.T. and J.D.]), and MD Anderson’s Cancer Center Support Grant and the Toomim Family Fund (to D.N.).
Footnotes
The authors declare no conflicts of interest.
Publisher's Disclaimer: This is a PDF file of an unedited manuscript that has been accepted for publication. As a service to our customers we are providing this early version of the manuscript. The manuscript will undergo copyediting, typesetting, and review of the resulting proof before it is published in its final citable form. Please note that during the production process errors may be discovered which could affect the content, and all legal disclaimers that apply to the journal pertain.
References
- 1.Patrick SW, Schumacher RE, Benneyworth BD, Krans EE, McAllister JM, Davis MM. Neonatal abstinence syndrome and associated health care expenditures: United States, 2000 – 2009. JAMA. 2012;307:1934–40. doi: 10.1001/jama.2012.3951. [DOI] [PubMed] [Google Scholar]
- 2.U.S. Department of Health and Human Services, Substance Abuse and Mental Health Administration. Results from the 2011 National Survey on Drug Use and Health: National Findings. 2011. [Google Scholar]
- 3.Hudak ML, Tan RC. Neonatal drug withdrawal. Pediatrics. 2012;129(2):e540–60. doi: 10.1542/peds.2011-3212. [DOI] [PubMed] [Google Scholar]
- 4.Jansson LM, Velez M, Harrow C. The opioid-exposed newborn: assessment and pharmacologic management. J Opioid Manag. 2009;5:47–55. [PMC free article] [PubMed] [Google Scholar]
- 5.Kaltenbach K, Holbrook AM, Coyle MG, Heil SH, Salisbury AL, Stine SM, et al. Predicting treatment for neonatal abstinence syndrome in infants born to women maintained on opioid agonist medication. Addiction. 2012;107 (Suppl 1):45–52. doi: 10.1111/j.1360-0443.2012.04038.x. [DOI] [PMC free article] [PubMed] [Google Scholar]
- 6.Wachman EM, Hayes MJ, Brown MS, Paul J, Harvey-Wilkes K, Terrin N, et al. Association of OPRM1 and COMT single nucleotide polymorphisms with hospital length of stay and treatment of neonatal abstinence syndrome. JAMA. 2013;309:1821–7. doi: 10.1001/jama.2013.3411. [DOI] [PMC free article] [PubMed] [Google Scholar]
- 7.Seligman NS, Salva N, Hayes EJ, Dysart KC, Pequignot EC, Baxter JK. Predicting length of treatment for neonatal abstinence syndrome in methadone exposed neonates. Am J Obstet Gynecol. 2008;199:396. doi: 10.1016/j.ajog.2008.06.088. [DOI] [PubMed] [Google Scholar]
- 8.Kendler KS, Karkowski LM, Neale MC, Prescott CA. Illicit Psychoactive Substance Use, Heavy Use, Abuse, and Dependence in a US Population-Based Sample of Male Twins. Arch Gen Psychiatry. 2000;57:261–9. doi: 10.1001/archpsyc.57.3.261. [DOI] [PubMed] [Google Scholar]
- 9.Goldman D, Oroszi G, Ducci F. The Genetics of Addiction: Uncovering the Genes. Focus. 2006;6:401–15. doi: 10.1038/nrg1635. [DOI] [PubMed] [Google Scholar]
- 10.Lotsch J, Starke C, Liefhold J, Geisslinger G. Genetic Predictors of the Clinical Response to Opioid Analgesics: Clinical Utility and Future Perspectives. Clin Pharmacokinet. 2004;43:983–1013. doi: 10.2165/00003088-200443140-00003. [DOI] [PubMed] [Google Scholar]
- 11.Levran O, Yuferov V, Kreek MJ. The genetics of the opioid system and specific drug addictions. Human Genetics. 2012;131:823–42. doi: 10.1007/s00439-012-1172-4. [DOI] [PMC free article] [PubMed] [Google Scholar]
- 12.Kreek MJ, Bart G, Lilly C, LaForge KS, Nielsen DA. Pharmacogenetics and Human Molecular Genetics of Opiate and Cocaine Addiction and Their Treatments. Pharmacological Reviews. 2006;57:1–26. doi: 10.1124/pr.57.1.1. [DOI] [PubMed] [Google Scholar]
- 13.Nielsen DA, Utrankar A, Reyes JA, Simons DD, Kosten TR. Epigenetics of drug abuse: predisposition or response. Pharmacogenomics. 2012;13:1149–60. doi: 10.2217/pgs.12.94. [DOI] [PMC free article] [PubMed] [Google Scholar]
- 14.Doehring A, Oertel BG, Sittl R, Lotsch J. Chronic opioid use is associated with increased DNA methylation correlating with increased clinical pain. Pain. 2013;154:15–23. doi: 10.1016/j.pain.2012.06.011. [DOI] [PubMed] [Google Scholar]
- 15.Oertel BG, Doehring A, Roskam B, Kettner M, Hackmann N, Ferreiros N, et al. Genetic-epigenetic interaction modulates mu-opioid receptor regulation. Hum Mol Genet. 2012;21:4751–60. doi: 10.1093/hmg/dds314. [DOI] [PubMed] [Google Scholar]
- 16.Chorbov VM, Todorov AA, Lynskey MT, Cicero TJ. Elevated levels of DNA methylation at the OPRM1 promoter in blood and sperm from male opioid addicts. J Opioid Manag. 2011;7:258–264. doi: 10.5055/jom.2011.0067. [DOI] [PMC free article] [PubMed] [Google Scholar]
- 17.Nielsen DA, Yuferov V, Hamon S, Jackson C, Ho A, Ott J, et al. Increased OPRM1 DNA Methylation in Lymphocytes of Methadone Maintained Former Heroin Addicts. Neuropsychopharmacology. 2009;34:867–73. doi: 10.1038/npp.2008.108. [DOI] [PMC free article] [PubMed] [Google Scholar]
- 18.Nielsen DA, Hamon S, Yuferov V, Jackson C, Ho A, Ott J, et al. Ethnic diversity of DNA methylation in the OPRM1 promoter region in lymphocytes of heroin addicts. Hum Genet. 2010;127:639–649. doi: 10.1007/s00439-010-0807-6. [DOI] [PMC free article] [PubMed] [Google Scholar]
- 19.PAXgene Blood DNA Kit Handbook. Hombrechtikon, Switzerland: PreAnalytiX Co; 2009. [Google Scholar]
- 20.Oragene DNA Collection Kit Protocol. Kanata, Canada: DNA Genotek; 2011. [Google Scholar]
- 21.Finnegan LP, Kaltenbach K. Neonatal abstinence syndrome. In: Hoekelman R, Nelson M, editors. Primary Pediatric Care. St Louis, MO: Mosby Yearbook Inc; 1992. pp. 1367–1378. [Google Scholar]
- 22.TESS: Transcription Element Search System. University of Pennsylvania; Available from: http://www.cbil.upenn.edu/cgi-bin/tess/tess. [Google Scholar]
- 23.Patch 1.0 and AliBaba 2.1. Biobase Biological Databases. Available from: http://www.gene-regulation.com/pub/programs.html.
- 24.Benjamini Y, Hochberg Y. Controlling the false discovery rate: A practical and powerful approach to multiple testing. J Roy Stat Soc Ser B. 1995;57:289–300. [Google Scholar]
- 25. [Accessed October 2012];HapMap CEU. http://www.ncbi.nlm.nih.gov/projects/SNP.
- 26.Bond C, LaForge KS, Tian M, Melia D, Zhang S, Borg L, et al. Single nucleotide polymorphism in the human mu opioid receptor gene alters beta-endorphin binding and activity: possible implications for opiate addiction. Proc Natl Acad Sci. 1998;95:9608–9613. doi: 10.1073/pnas.95.16.9608. [DOI] [PMC free article] [PubMed] [Google Scholar]
- 27.Kroslak T, Laforge KS, Gianotti RJ, Ho A, Nielsen DA, Kreek MJ. The single nucleotide polymorphism A118G alters functional properties of the human mu opioid receptor. J Neurochem. 2007;103:77–87. doi: 10.1111/j.1471-4159.2007.04738.x. [DOI] [PubMed] [Google Scholar]
- 28.Zhang Y, Wang D, Johnson AD, Papp AC, Sadee W. Allelic expression imbalance of human mu opioid receptor (OPRM1) caused by variant A118G. J Biochem. 2005;280:32618–24. doi: 10.1074/jbc.M504942200. [DOI] [PubMed] [Google Scholar]
- 29.Ray R, Ruparel K, Newberg A, Wileyto EP, Loughead JW, Divgi C, et al. Human Mu Opioid Receptor (OPRM1 A118G) polymorphism is associated with brain mu-opioid receptor binding potential in smokers. Proc Natl Acad Sci. 2011;108:9268–9273. doi: 10.1073/pnas.1018699108. [DOI] [PMC free article] [PubMed] [Google Scholar]
- 30.Douet V, Heller MB, Le Saux O. DNA methylation and Sp1 binding determine the tissue-specific transcriptional activity of the mouse Abcc6 promoter. Biochem Biophys Res Commun. 2007;354:66–71. doi: 10.1016/j.bbrc.2006.12.151. [DOI] [PMC free article] [PubMed] [Google Scholar]
- 31.Michelotti GA, Brinkley DM, Morris DP, Smith MP, Louie RJ, Schwinn DA. Epigenetic regulation of human alpha1d-adrenergic receptor gene expression: a role for DNA methylation in Sp1-dependent regulation. FASEB J. 2007;21:1979–1993. doi: 10.1096/fj.06-7118com. [DOI] [PMC free article] [PubMed] [Google Scholar]
- 32.Zhang H, Herman AI, Kranzler HR, Anton RF, Simen AA, Gelernter J. Hypermethylation of OPRM1 promoter region in European Americans with alcohol dependence. J Hum Genet. 2012;57:670–75. doi: 10.1038/jhg.2012.98. [DOI] [PMC free article] [PubMed] [Google Scholar]
- 33.Byrnes EM. Transgenerational consequences of adolescent morphine exposure in female rats: effects on anxiety-like behaviors and morphine sensitization in adult offspring. Psychopharmacology. 2005;182:537–544. doi: 10.1007/s00213-005-0122-4. [DOI] [PubMed] [Google Scholar]
- 34.Byrnes JJ, Johnson NL, Carini LM, Byrnes EM. Multigenerational effects of adolescent morphine exposure on dopamine D2 receptor function. Psychopharmacology. 2013;227:263–272. doi: 10.1007/s00213-012-2960-1. [DOI] [PMC free article] [PubMed] [Google Scholar]
- 35.Armstrong DA, Lesseur C, Conradt E, Lester BM, Marsit CJ. Global and gene-specific DNA methylation across multiple tissues in early infancy: implications for children’s health research. FASEB J. 2014 Jan 29; doi: 10.1096/fj.13-238402. Epub ahead of print. [DOI] [PMC free article] [PubMed] [Google Scholar]
- 36.Lehmann AS, Haas DM, McCormick CL, Skaar TC, Renbarger JL. Collection of human genomic DNA from neonates: A comparison between umbilical cord blood and buccal swabs. Am J Obstet Gynecol. 2011;204:362.e1–362.e6. doi: 10.1016/j.ajog.2010.12.013. [DOI] [PMC free article] [PubMed] [Google Scholar]
- 37.Thompson TM, Sharfi D, Lee M, Yrigollen CM, Naumova OY, Grigorenko EL. Comparison of whole-genome DNA methylation patterns in whole blood, saliva, and lymphoblastoid cell lines. Behav Genet. 2013;43:168–76. doi: 10.1007/s10519-012-9579-1. [DOI] [PMC free article] [PubMed] [Google Scholar]