Abstract
Purpose
To investigate psychophysical thresholds in Stargardt disease with the full-field stimulus test (FST).
Methods
Visual acuity (VA), spectral-domain optical coherence tomography (SD-OCT), full-field electroretinogram (ERG), and FST measurements were made in one eye of 24 patients with Stargardt disease. Dark-adapted rod FST thresholds were measured with short-wavelength stimuli, and cone FST thresholds were obtained from the cone plateau phase of dark adaptation using long-wavelength stimuli. Correlation coefficients were calculated for FST thresholds versus macular thickness, VA and ERG amplitudes.
Results
Stargardt patient FST cone thresholds correlated significantly with VA, macular thickness, and ERG cone-response amplitudes (all P<0.01). The patients’ FST rod thresholds correlated with ERG rod-response amplitudes (P<0.01), but not macular thickness (P=0.05). All Stargardt disease patients with flecks confined to the macula and most of the patients with flecks extending outside of the macula had normal FST thresholds. All patients with extramacular atrophic changes had elevated FST cone thresholds and most had elevated FST rod thresholds.
Conclusion
FST rod and cone threshold elevation in Stargardt disease patients correlated well with measures of structure and function, as well as ophthalmoscopic retinal appearance. FST appears to be a useful tool for assessing rod and cone function in Stargardt disease.
Background
Stargardt disease is the most common juvenile onset hereditary macular dystrophy.1,2 Mutations in the ABCA4 gene are responsible for the autosomal recessive form of the disease.3 Mutations of ABCA4 can also cause cone dystrophy, cone-rod dystrophy4, and more rarely retinitis pigmentosa phenotypes.5,6
Stargardt disease is ophthalmoscopically characterized by yellow or creamy white fundus flecks and macular degeneration. Most patients with Stargardt disease experience progressive central visual loss by the second or third decades of life, although later onset is not uncommon.7 Snellen visual acuity (VA) often stabilizes around 20/200 (1.0 logMAR), but further visual acuity loss is possible in cases where diffuse retinal degeneration occurs.8-11
Various systems of categorization have been devised for patients with Stargardt disease. Two such systems include categorization by “stage” based on fundus appearance,12,13 and by “group” based on electroretinogram (ERG) signals.14 Longitudinal studies have shown that the full-field ERG may have prognostic value in Stargardt disease.15,16
Another full-field measure of visual function is the full-field stimulus test (FST), which provides a psychophysical test of luminance threshold.17,18 As opposed to the focal stimuli used in traditional static and kinetic visual field perimetry, the FST utilizes a brief full-field (ganzfeld) flash. Subjects are typically fully dark-adapted, after which the full-field flash stimuli are presented. Short and long wavelength stimuli can be used to determine whether the thresholds are rod-mediated, cone-mediated, or a combination of both, which is particularly useful for patients with retinal disease. Cone-mediated responses can be elicited with the addition of either a bleach-recovery dark adaptation protocol17,19 or a background light.19 The thresholds measured with the FST are thought to be mediated by the most sensitive part of the visual field. Roman et al.17 demonstrated a strong correlation (r>0.95) between the most sensitive area of the visual field based on static perimetry and FST-based sensitivity in a cohort of more than 100 subjects with a variety of retinal diseases.
An advantage of the FST is that accurate fixation is not critical, given the full-field nature of the stimulus. In fact, the FST was primarily designed for testing patients with severe retinal degenerations such as Leber congenital amaurosis who often have nystagmus and difficulty with steady fixation.17 The FST has been found to be useful in other diffuse retinal diseases, such as retinitis pigmentosa20 and cone-rod dystrophy.21 A group of thirteen patients with Stargardt disease was tested with two-color dark adapted FST, but their results were reported as part of a larger group of macular dystrophy patients.17 The purpose of the present study was to evaluate the relationships among cone and rod mediated FST thresholds, retinal thickness as determined by spectral-domain optical coherence tomography (SD-OCT), and full-field ERG amplitudes measured under scotopic and photopic conditions, all of which are commonly used indices of either visual function or retinal structure in Stargardt disease.
Methods
Twenty-four patients with Stargardt disease (age range 21-52, mean 37.3, standard deviation (SD) 10.0 years) participated in the study. Nineteen patients had at least two known disease-causing variants of the ABCA4 gene, four patients had only one known disease causing variant, and one patient was the affected sibling of three affected patients with known mutations. None of the Stargardt disease patients had any other known ophthalmic condition or medical condition that would be expected to affect the testing results, and none were taking any medication that would be expected to affect the testing results. Stargardt disease patients were categorized by fundus appearance as Stage 1 (flecks confined to the macula, n=7), Stage 2 (flecks also outside the macula, n=6), or Stage 3 (resorbed flecks, n=10), or Stage 4 (extensive atrophy extending outside the macula, n=1).12 Some Stage 3 and 4 patients lack visible fundus flecks, and therefore the diagnosis of Stargardt disease in those cases was based partly on the presence of fundus flecks observed on prior exams at our clinic.
Stargardt disease patients were also categorized by group according to rod and cone results on FST testing. This categorization is based on an ERG group categorization proposed by Lois et al. (2001).14 Our FST groups are as follows: FST Group 1 (normal rod and cone FST thresholds), FST Group 2 (elevated cone and normal rod FST thresholds), and FST Group 3 (elevated cone and rod FST thresholds).
Best-corrected visual acuity of each eye was tested with ETDRS acuity charts, and the eye with better visual acuity was selected for further testing. If acuity in the two eyes was the same, then the patient's subjectively preferred eye was tested. The selected eye was tested with SDOCT, full-field ERG, and FST. This eye was dilated with 1.0% tropicamide and 2.5% phenylephrine, and was monitored to ensure consistent dilation throughout testing with FST and ERG procedures.
A SD-OCT 3D Retinal Topography protocol was tested on all Stargardt disease patients with the Optos Spectral OCT SLO (Optos, Dunfermline, Scotland; OCT SLO formerly OPKO/OTI). The total average thickness (macular thickness) was measured as the average retinal thickness within 3 mm of the foveal center.
Full-field ERGs were obtained with Burian-Allen contact lens electrodes under both dark adapted (scotopic) and light adapted (photopic) conditions with the Diagnosys ColorDome™ (Diagnosys LLC, Lowell, MA). ERG testing conformed to the ISCEV standard, with the exception that a blue stimulus (instead of achromatic) was used for the scotopic dim single flash, and the light adapted achromatic single flash stimulus was 4.5 cd-s/m2 (instead of 3.0 cd-s/m2). Each patient was dark adapted for at least 30 minutes prior to scotopic testing with the rod-isolating dim blue single flash 0.005 cd-s/m2 stimulus. After at least 7 minutes adapting to a 30 cd/m2 6500K white background, subjects were tested with an achromatic cone-isolating flash of 4.5 cd-s/m2. Further testing at 10 minutes with the same stimulus was performed only if amplitudes continued to rise during further light adaptation. After 10 minutes of light adaptation subjects were tested with a 32-Hz 3.0 cd-s/m2 flicker stimulus. B-wave amplitudes from single-flash ERGs and trough-to-peak amplitudes from flicker ERGs were used in statistical analysis. The ERG lower limit of normal was based on 90% tolerance limits with 90% coverage of the normal population (which provides limits close to the range of normal subjects).22 This statistical approach was employed to account for our range of normal ERG amplitudes, which are not normally distributed. Two of the Stargardt disease patients did not undergo ERG testing.
For dark adapted FST, we began with the protocol described by Klein and Birch (2009), using the Diagnosys Espion3, ColorDome™, and a button box (Diagnosys LLC, Lowell, MA).21 The software to run the FST protocol on the Diagnosys Espion3 can be obtained from Diagnosys LLC. The Diagnosys FST stimuli have been shown to provide reliable and repeatable dark adapted thresholds in patients with retinal degenerations.18,21 Subjects were dark adapted for 30 minutes prior to testing. The subject was provided a button box with two buttons (green and red), with textured tape placed on the green button.21 The light stimuli were presented simultaneously with an audible signal, and the subject was instructed to press the green (taped) button if they saw a light anywhere in the ColorDome, or press the red button if they saw no light. The first stimulus was 6500K achromatic (white), tested three times (results not reported here). Long-wavelength (red) and short-wavelength (blue) stimuli were similarly tested three times apiece (each test is run automatically by the Espion software), subsequent to the white stimulus tests. Dark adapted thresholds were assumed to be rod mediated if threshold was at least 2.2 log units lower for the blue stimulus than for the red stimulus, based on findings by Roman et al.18 and Park et al.24 that under rod mediated conditions, threshold for the blue and red stimuli generated by the ColorDome differed by approximately 2.3 log units.
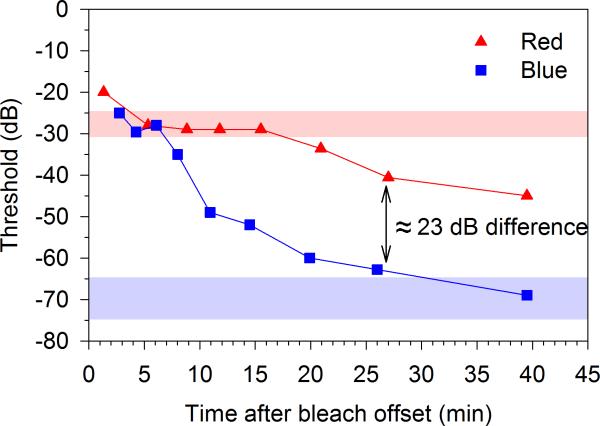
After the dark adapted FST testing, subjects underwent 5 minutes of a full-field bleach (3.1 log cd/m2 6500K achromatic full-field), which bleached approximately 67% of rhodopsin.23 Following the bleach, a dark adaptation protocol was tested using the red and blue full-field stimuli. We assumed that red stimulus thresholds were mediated by cones if the differences between red and blue responses were less than 2.2 log units (photopic cd-s/m2). A cone threshold was measured as the average response to red stimuli during the cone plateau, which occurred between 5 and 10 minutes post-bleach. An example result from our FST dark adaptation testing with red and blue stimuli is shown in Figure 1.
Figure 1.
Example FST thresholds to red (triangles) and blue (squares) stimuli during dark adaptation after a 5 minute bleach (3.1 log cd/m2 achromatic 6500K full-field) in a patient with Stage 1 Stargardt disease. Note the cone plateau with the red stimulus 5-10 minutes post bleach, from which the FST cone threshold is calculated. Normal ranges (+/- 2 standard deviations) are shown for the red stimulus cone final threshold (cone plateau, light red band) and blue stimulus rod final threshold (light blue band). In this example from patient, the thresholds fall well within those ranges. Note that rod dark adapted thresholds used in this study were obtained prior to the bleaching light in all subjects. The remainder of the dark adaptation curve after the cone plateau is shown here as a demonstration only. For the FST zero dB = 0.1 cd-s/m2.
Ten visually normal subjects (age range 21-51 years, mean 35.0, SD 9.7) also underwent the FST with the same protocol. The mean age of the control subjects did not differ significantly from that of the patients (P=0.54).
The Diagnosys FST software generates psychometric functions relating percent detected to stimulus intensity, which are fit with a two parameter Weibull function to determine threshold.21 FST results were expressed in decibels where zero dB = 0.1 cd-s/m2. Partial Pearson correlation coefficients were calculated for comparisons of FST thresholds to other tests (logMAR visual acuity, SD-OCT macular thickness, and ERG amplitudes), after controlling for the effect of age. Significance of correlation coefficients at P<0.01 was determined by the Bonferroni correction method.
This project was approved by an Institutional Review Board of the University of Illinois at Chicago and in compliance with the Declaration of Helsinki.
Results
For all subjects (visually normal or Stargardt disease), dark adapted FST blue stimulus thresholds were at least 22 dB (2.2 log) lower than dark adapted FST red stimulus thresholds (photopic units), indicating rod mediation of dark adapted thresholds for both stimuli. For the ten visually normal subjects, FST mean rod threshold was -69.8 dB (SD 2.5) and mean cone threshold (measured from the red stimulus cone plateau) was -27.7 dB (SD 1.5).
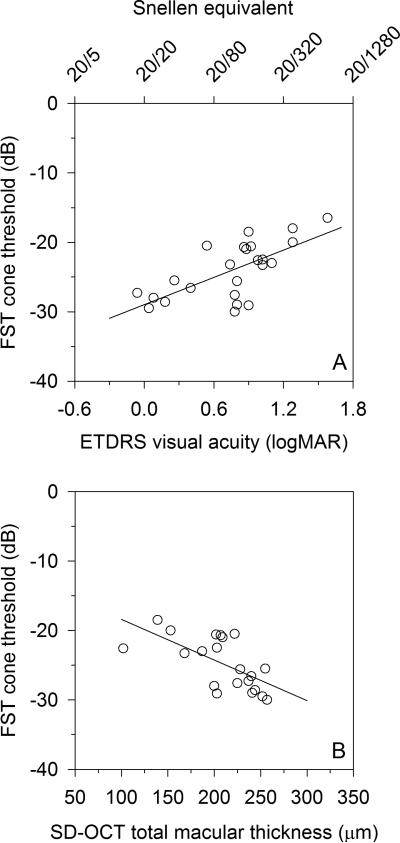
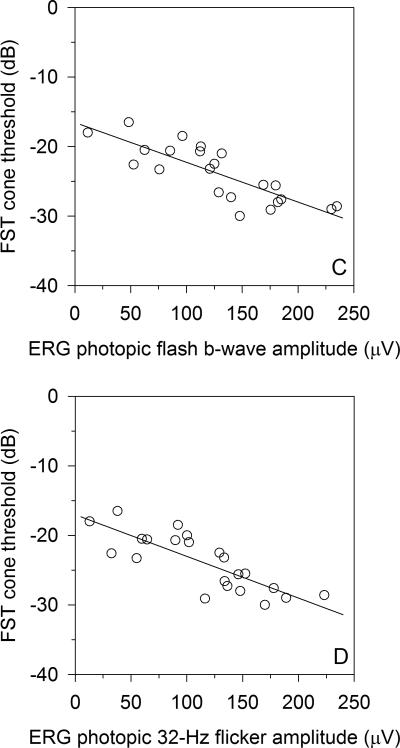
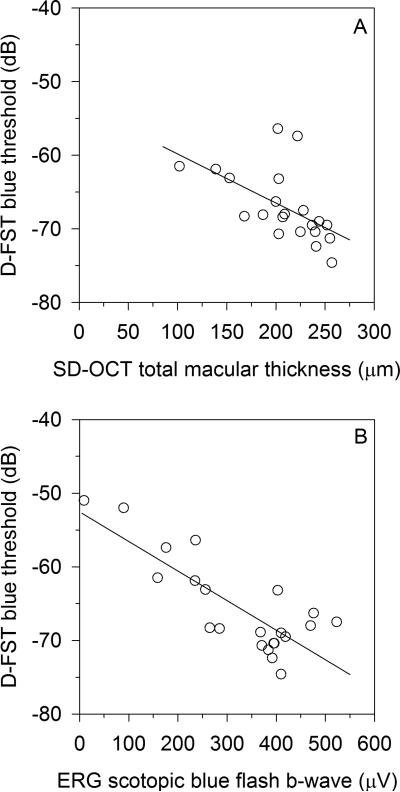
The 24 Stargardt disease patients’ visual acuities, FST rod and cone thresholds, and known ABCA4 mutations are listed in Table 1. The FST cone thresholds for the Stargardt disease patients correlated significantly with logMAR VA (r=0.67, P<0.001) (Figure 2A) and SD-OCT macular thickness (r=-0.65, P=0.002) (Figure 2B). The two patients with the most advanced disease had poor SD-OCT volume scans that could not be properly segmented, and a third patient did not undergo SD-OCT testing. Those three Stargardt disease patients were not included in the SD-OCT analysis. Stargardt patient FST cone thresholds also correlated with both ERG light-adapted single flash b-wave amplitude (r=-0.79, P<0.001) (Figure 2C) and ERG light-adapted 32-Hz flicker amplitude (r=-0.78, P<0.001) (Figure 2D). Stargardt patient FST rod thresholds weakly correlated with both SD-OCT macular thickness (r=-0.45, P=0.045) (Figure 3A), failing to meet statistical significance of P<0.01. On the other hand, Stargardt patient FST rod thresholds correlated well with ERG dark-adapted blue single flash b-wave amplitudes (r=-0.71, P<0.001) (Figure 3B).
Table 1.
Stargardt Patient Demographics, Stage (Fundus Appearance), Visual Acuity, Full-Field Stimulus Test (FST), And Known ABCA4 Mutations.
| Age/Gender | Stage | LogMAR Acuity | Tested Eye | FST Rod, Blue Stimulus (dB) | FST Cone, Red stimulus (dB) | FST Group | ABCA4 Mutations | ||
|---|---|---|---|---|---|---|---|---|---|
| OD | OS | ||||||||
| 1. | 48/M | 1 | 0.92 | 0.90 | OS | −70.7 | −29.1 | 1 | p.Gly863Ala; p.Gly863Ala |
| 2. | 31/F | 1 | 0.82 | 0.80 | OS | −67.5 | −25.6 | 1 | p.Gln636* |
| 3. | 20/M | 1 | 0.88 | 0.78 | OS | −70.4 | −27.6 | 1 | p.Arg1129Cys; p.Arg2077Trp |
| 4. | 30/F | 1 | −0.06 | 0.06 | OD | −69.5 | −27.3 | 1 | p.Arg2077Trp |
| 5. | 21/M | 1 | 0.36 | 0.26 | OS | −71.3 | −25.5 | 1 | p.Arg219Thr; p.Gly863Ala |
| 6. | 41/F | 1 | 0.18 | 0.30 | OD | −69.0 | −28.6 | 1 | p.Val989Ala; p.Val989Ala |
| 7. | 45/F | 1 | 0.06 | 0.04 | OS | −69.5 | −29.5 | 1 | p.Ile975Met; p.Lys1978Glu |
| 8. | 33/M | 2 | 0.80 | 0.84 | OD | −72.4 | −29.0 | 1 | p.Lys2056* |
| 9. | 42/F | 2 | 0.16 | 0.08 | OS | −66.3 | −28.0 | 1 | p.Gly550Arg; p.Arg2030Gln |
| 10. | 22/M | 2 | 0.78 | 0.82 | OD | −74.6 | −30.0 | 1 | p.Tyr850Cys; p.Gly1961Glu; c.5461-10T>C |
| 11. | 47/M | 2 | 0.94 | 0.40 | OS | −70.4 | −26.6 | 1 | p.Gly1087Lys |
| 12. | 21/F | 2 | 0.94 | 0.88 | OS | −68.0 | −21.0 | 2 | c.5018+2T>C; p.Tyr2036Cys |
| 13. | 34/F | 3 | 1.02 | 1.06 | OD | −68.3 | −23.3 | 2 | p.Gly818Glu; p.Cys1488Arg |
| 14. | 34/F | 3 | 0.86 | 0.94 | OD | −68.4 | −20.7 | 2 | p.[Leu541Pro;Ala1038Val]; p.Asp576His |
| 15. | 35/M | 3 | 1.00 | 0.74 | OS | −68.9 | −23.2 | 2 | p.Gly550Arg; c.5714+5G>A |
| 16. | 39/M | 3 | 1.10 | 1.10 | OD | −68.1 | −23.0 | 2 | c.5461-10T>C; c.5714+5G>A |
| 17. | 32/F | 2 | 1.02 | 1.02 | OD | −63.2 | −22.5 | 3 | p.Glu531Gly; c.5461-10T>C |
| 18. | 47/M | 3 | 0.54 | 0.76 | OD | −57.4 | −20.5 | 3 | c.67-2A>G; p.Gly863Ala |
| 19. | 34/M | 3 | 1.28 | 1.28 | OS | −63.1 | −20.0 | 3 | p.[Leu541Pro;Ala1038Val]; p.Asp645Asn; p.Asp645Asn |
| 20. | 40/M | 3 | 1.08 | 0.92 | OS | −56.4 | −20.6 | 3 | Sibling of 16, 21, and 22 (not genotyped) |
| 21. | 52/F | 3 | 0.98 | 1.08 | OD | −61.5 | −22.6 | 3 | c.5461-10T>C; c.5714+5G>A |
| 22. | 50/M | 3 | 0.90 | 1.06 | OD | −61.9 | −18.5 | 3 | c.5461-10T>C; c.5714+5G>A |
| 23. | 50/F | 3 | 1.58 | 1.64 | OD | −52.0 | −16.5 | 3 | p.Gly863Ala; c.5917delG |
| 24. | 47/M | 4 | 1.44 | 1.28 | OS | −51.0 | −18.0 | 3 | p.[Leu541Pro;Ala1038Val]; c.4634+1G>T |
FST normal (n=10) mean thresholds were −69.8 dB (SD 2.5) for the dark adapted blue (rod) stimulus and −27.7 dB (SD 1.5) for the cone plateau red stimulus.
Figure 2.
For Stargardt disease patients, FST cone plateau to a red stimulus (cone threshold) correlated well with A) logMAR visual acuity (r=0.67, P<0.001), and B) SD-OCT total macular thickness (r=-0.65, P=0.002). Stronger FST cone threshold correlations are found with C) light adapted single-flash ERG (r=-0.78, P<0.001), and D) light adapted 32-Hz flicker ERG (r=-0.78, P<0.001). For the FST zero dB = 0.1 cd-s/m2.
Figure 3.
For Stargardt disease patients, FST dark adapted thresholds to a blue stimulus (rod-mediated) weakly correlated with A) OCT total macular thickness (r=-0.45, P=0.05), failing to reach statistical significance of P<0.01. Stronger FST rod threshold correlation is found with B) Scotopic dark adapted single flash dim blue stimulus b-wave (r=-0.71, P<0.001). For FST zero dB = 0.1 cd-s/m2.
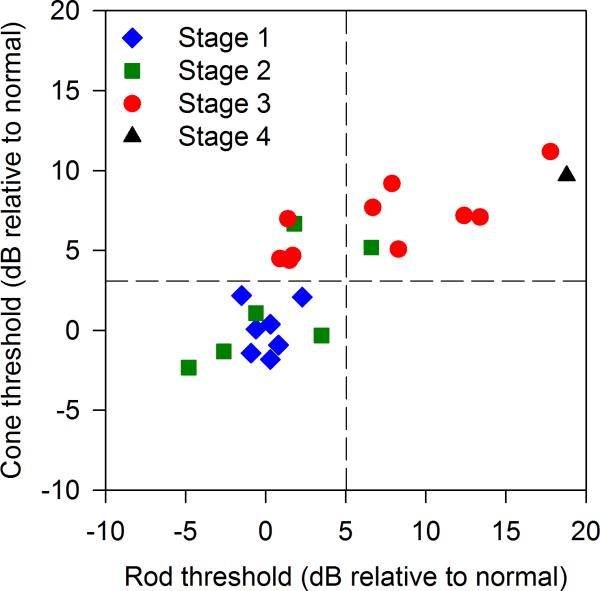
Figure 4 shows that for Stage 1 patients, FST rod thresholds (mean -69.7 dB, SD 1.2) and cone thresholds (mean -27.6 dB, SD 1.6) were all within 2 SD of the normal mean. For Stage 2 patients, FST rod thresholds (mean -69.2 dB, SD 4.2) and cone thresholds (mean -26.2 dB, SD 3.6) clustered mostly in the normal range, but the Stage 2 patients’ FST thresholds ranged from normal to 6.7 dB above the normal mean (rod or cone) due to two Stage 2 subjects with elevated FST thresholds. For Stage 3 patients, rod thresholds (mean -62.6 dB, SD 5.9) ranged from normal to 17.8 dB above the normal mean, whereas Stage 3 cone thresholds (mean -20.9 dB, SD 2.2) were all elevated by at least 4.4 dB above the normal mean. The single Stage 4 patient's rod and cone FST thresholds were both elevated at -51 dB and -18 dB, respectively.
Figure 4.
Stargardt disease patients are categorized by fundus appearance (Stages 1-4), plotting cone threshold (FST cone plateau) vs. rod threshold (FST dark adapted blue stimulus). Note zero dB in this figure is the mean threshold of ten normal subjects on both axes. Vertical and horizontal dotted lines represent 2 standard deviations above the normal mean for rod and cone thresholds, respectively. FST Group 1 (n=11) patient thresholds fall within 2 SD of the normal mean for both rod and cone FST. FST Group 2 patient thresholds (n=5) fall well outside the normal range for cones, but within 2 SD of the normal mean for rods. FST Group 3 (n=8) patient thresholds are all elevated by at least 5 dB above the normal mean (outside the normal range) for both rod and cone FST.
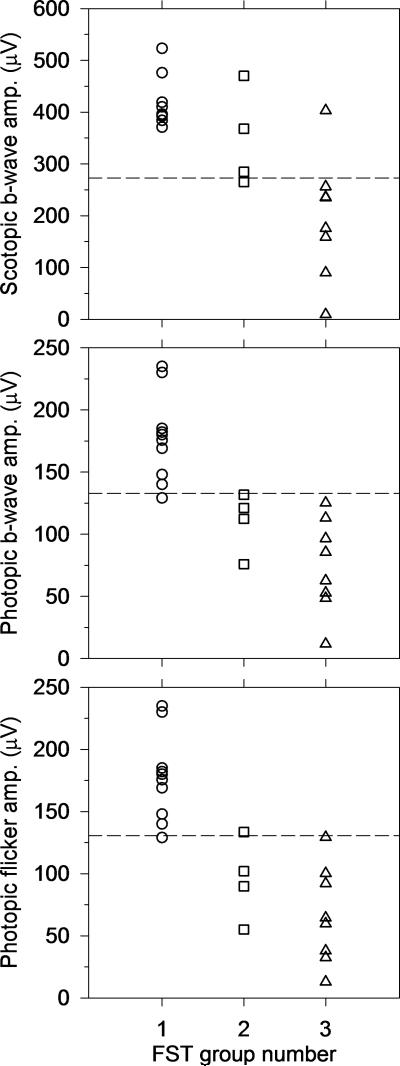
Figure 5 shows the correspondence between FST-based groups and ERG-based groups described by Lois et al.14 All FST Group 1 Stargardt disease patients who underwent ERG (n=10) had normal ERG dark adapted dim blue single flash (rod) b-wave amplitudes, and all but one FST Group 1 Stargardt disease patient had normal cone ERG amplitudes (light adapted single flash b-wave and 32-Hz trough-to-peak). Three out of four FST Group 2 patients who underwent ERG testing had normal dark adapted (rod) b-wave amplitudes. All four of these FST Group 2 patients had sub-normal photopic single-flash b-wave amplitude, and three out of the four had sub-normal 32-Hz flicker trough-to-peak amplitude. Of the eight FST Group 3 Stargardt disease patients, all but one had sub-normal dark adapted (rod) b-wave amplitude, and all eight had sub-normal cone ERG amplitudes.
Figure 5.
With few exceptions, FST groups correspond to ERG-based groups described by Lois et al.,14 where in both systems Group 1 has normal rod and cone (thresholds or signals), Group 2 has normal rods and dysfunctional cones, and Group 3 has dysfunctional rods and cones. Dark-adapted dim blue single flash (rod mediated) ERG amplitudes, light adapted single flash b-wave ERG amplitudes, and ERG light adapted 32-Hz flicker amplitudes are plotted by FST group. Dotted lines represent lower limit of normal ERG amplitudes.
Discussion
The FST has been primarily used for testing visual function in patients with severe retinal degenerations. It may also be useful as an efficient measure of visual function in patients with less severe retinal dystrophies who have difficulty fixating during other tests of visual function, such as visual field testing, microperimetry, or Goldmann-Weekers dark adaptometry. The large dynamic range of the FST permits testing of thresholds in the super-normal and severely elevated ranges without either ceiling or floor effects. A theoretical floor effect is possible for our cone plateau measurements if cone thresholds are elevated greatly in the presence of relatively normal rod thresholds. This limitation is simply a function of the fact that rods would mediate thresholds even after exposure to a bleaching light if cones are non-functional and is not a limitation of the testing procedure or instrumentation.
In all of our visually normal and Stargardt disease subjects, the dark adapted thresholds were rod mediated, based on the differences in response to long- and short-wavelength stimuli. Since rods may contribute to red stimulus thresholds under dark adapted conditions, either a dark adaptation protocol or a background light must be used to measure cone thresholds in normal subjects and Stargardt disease patients. With the addition of a dark adaptation protocol to FST, we were able to measure cone mediated full field thresholds during the cone plateau phase with a long wavelength stimulus, as described by previous investigators.17,19
Perhaps not surprisingly, the FST rod and cone thresholds were within 2 SD of the normal mean in all seven cases where fundus flecks and retinal degeneration were clinically confined to the macula (Stage 1). In many Stage 1 Stargardt disease patients, and some Stage 2 patients, both fixation and macular sensitivity can be less impaired, lessening the utility of FST in favor of conventional perimetry or microperimetry.
In Stage 2 cases (n=6), where fundus flecks are visible outside the macula, but retinal degeneration is primarily confined to the macula, we found mixed results for rod and cone FST thresholds. Most Stage 2 patients had normal rod and cone FST thresholds, but two of our six Stage 2 patients had elevation of either cone threshold only or both cone and rod thresholds.
Stage 3 patients (n=11), as well as our single Stage 4 patient, all had elevated cone thresholds, and most had elevated rod thresholds. Even in some Stage 3 Stargardt disease patients, dark adapted FST thresholds, which are rod mediated, can be within normal limits.
Although the stimuli used in FST and ERG are similar, the results of the two tests have different meanings.17,18,19 Full-field ERG amplitudes are summed (integrated) responses from the entire retina. FST, on the other hand, is a threshold response that is assumed to be mediated by the most sensitive part of the visual field.17 In spite of these differences between ERG and FST, we found that FST may be a reasonable psychophysical correlate of ERG signals in Stargardt disease. Stargardt disease patients with reduced cone and rod ERG amplitudes are considered to have diffuse photoreceptor dysfunction.16 It is therefore logical that the “best” area of the retina that detects the FST stimulus at threshold will still be reduced in sensitivity, accounting for the correlation between FST and ERG results. On the other hand, diffuse retinal degeneration alone may not explain reduced sensitivity on FST or reduced amplitudes on ERG. For a thorough discussion of central scotoma (macular lesion) size versus diffuse photoreceptor degeneration in ABCA4-related retinal degenerations, see Cideciyan et al. (2009).11 Given the complexity of comparing FST to ERG, it is a little surprising that the two procedures correlated as well as they did in our study.
A limitation of this study is that it does not provide longitudinal data to demonstrate whether FST has predictive value. However, longitudinal studies of Stargardt disease progression have demonstrated that full field ERG at a baseline exam has prognostic value. In a retrospective study, Zahid et al. (2013) found that lower amplitude baseline ERG predicted more rapid scotoma enlargement and ERG reduction.15 Fujinami et al. (2013) found that lower amplitude baseline ERG predicted greater ERG deterioration; however, Fujinami et al. did not find a correlation between baseline ERG and Snellen visual acuity loss.16 The authors of both studies suggest that ERG could be used for patient selection in clinical trials, and Fujinami et al. suggest that ERG could be used in monitoring patients in such trials.15,16
Cideciyan et al. (2009) showed that Stargardt disease patients with reduced extramacular sensitivity on dark adapted static perimetry tend to progress to further vision loss.11 On the other hand, Stargardt disease patients with normal extramacular visual field sensitivity tended to maintain that normal extramacular sensitivity at follow-up several years later. Given the strong correlation found between static visual field sensitivity and FST shown by Roman et al. (2005),17 our notion that elevated FST threshold may be predictive of further vision loss in Stargardt disease is consistent with the findings of Cideciyan et al. (2009).11
The correlation of FST rod and cone thresholds with tests of retinal structure and function suggest that the FST could be a useful psychophysical test in clinical trials for patient selection, natural history of visual sensitivity loss, and measuring rod and cone sensitivity change during treatment in patients with Stargardt disease.
Summary Statement.
Rod and cone mediated full field stimulus test thresholds were found to correlate with visual acuity, full field electroretinogram amplitudes and macular thickness in twenty-four patients with Stargardt disease. FST appears to be a useful tool for assessing rod and cone function in Stargardt disease.
Acknowledgements
Cless Family Foundation (Northbrook, IL), Foundation Fighting Blindness (Owings Mills, MD), Pangere Corporation, Grousbeck Family Foundation (Stanford, CA) (GAF); NIH R01EY021163 and R24EY019861 (RA); NIH R00EY0195510 (JJM); and an unrestricted departmental grant from Research to Prevent Blindness.
References
- 1.Riveiro-Alvarez R, Aguirre-Lamban J, Lopez-Martinez MA, Trujillo-Tiebas MJ, Cantalapiedra D, Vallespin E, Avila-Fernandez A, Ramos C, Ayuso C. Frequency of ABCA4 mutations in 278 Spanish controls: an insight into the prevalence of autosomal recessive Stargardt disease. Br J Ophthalmol. 2009 Oct;93(10):1359–64. doi: 10.1136/bjo.2008.148155. [DOI] [PMC free article] [PubMed] [Google Scholar]
- 2.Blacharski PA. In: Fundus flavimaculatus, in Retinal dystrophies and degenerations. Newsome DA, editor. Raven Press; New York: 1988. pp. 135–159. [Google Scholar]
- 3.Allikmets R, Singh N, Sun H, Shroyer NF, Hutchinson A, Chidambaram A, Gerrard B, Baird L, Stauffer D, Peiffer A, Rattner A, Smallwood P, Li Y, Anderson KL, Lewis RA, Nathans J, Leppert M, Dean M, Lupski JR. A photoreceptor cell-specific ATP-binding transporter gene (ABCR) is mutated in recessive Stargardt macular dystrophy. Nat Genet. 1997;15:236–246. doi: 10.1038/ng0397-236. [DOI] [PubMed] [Google Scholar]
- 4.Thiadens AA, Phan TM, Zekveld-Vroon RC, Leroy BP, van den Born LI, Hoyng CB, Klaver CC, Writing Committee for the Cone Disorders Study Group Consortium. Roosing S, Pott JW, van Schooneveld MJ, van Moll-Ramirez N, van Genderen MM, Boon CJ, den Hollander AI, Bergen AA, De Baere E, Cremers FP, Lotery AJ. Clinical course, genetic etiology, and visual outcome in cone and cone-rod dystrophy. Ophthalmology. 2012 Apr;119(4):819–26. doi: 10.1016/j.ophtha.2011.10.011. [DOI] [PubMed] [Google Scholar]
- 5.Martínez-Mir A, Paloma E, Allikmets R, Ayuso C, del Rio T, Dean M, Vilageliu L, Gonzàlez-Duarte R, Balcells S. Retinitis pigmentosa caused by a homozygous mutation in the Stargardt disease gene ABCR. Nat Genet. 1998 Jan;18(1):11–2. doi: 10.1038/ng0198-11. [DOI] [PubMed] [Google Scholar]
- 6.Mullins RF, Kuehn MH, Radu RA, Enriquez GS, East JS, Schindler EI, Travis GH, Stone EM. Autosomal recessive retinitis pigmentosa due to ABCA4 mutations: clinical, pathologic, and molecular characterization. Invest Ophthalmol Vis Sci. 2012 Apr 18;53(4):1883–94. doi: 10.1167/iovs.12-9477. [DOI] [PMC free article] [PubMed] [Google Scholar]
- 7.Westeneng-van Haaften SC, Boon CJ, Cremers FP, Hoefsloot LH, den Hollander AI, Hoyng CB. Clinical and genetic characteristics of late-onset Stargardt's disease. Ophthalmology. 2012 Jun;119(6):1199–210. doi: 10.1016/j.ophtha.2012.01.005. [DOI] [PubMed] [Google Scholar]
- 8.Fishman GA, Farber M, Patel BS, Derlacki DJ. Visual acuity loss in patients with Stargardt's macular dystrophy. Ophthalmology. 1987 Jul;94(7):809–14. doi: 10.1016/s0161-6420(87)33533-x. [DOI] [PubMed] [Google Scholar]
- 9.Oh KT, Weleber RG, Oh DM, Billingslea AM, Rosenow J, Stone EM. Clinical phenotype as a prognostic factor in Stargardt disease. Retina. 2004 Apr;24(2):254–62. doi: 10.1097/00006982-200404000-00011. [DOI] [PubMed] [Google Scholar]
- 10.Kim LS, Fishman GA. Comparison of visual acuity loss in patients with different stages of Stargardt's disease. Ophthalmology. 2006 Oct;113(10):1748–51. doi: 10.1016/j.ophtha.2006.04.027. [DOI] [PubMed] [Google Scholar]
- 11.Cideciyan AV, Swider M, Aleman TS, Tsybovsky Y, Schwartz SB, Windsor EA, Roman AJ, Sumaroka A, Steinberg JD, Jacobson SG, Stone EM, Palczewski K. ABCA4 disease progression and a proposed strategy for gene therapy. Hum Mol Genet. 2009 Mar 1;18(5):931–41. doi: 10.1093/hmg/ddn421. [DOI] [PMC free article] [PubMed] [Google Scholar]
- 12.Fishman GA. Fundus flavimaculatus. A clinical classification. Arch Ophthalmol. 1976 Dec;94(12):2061–7. doi: 10.1001/archopht.1976.03910040721003. [DOI] [PubMed] [Google Scholar]
- 13.Walia S, Fishman GA. Natural history of phenotypic changes in Stargardt macular dystrophy. Ophthalmic Genet. 2009 Jun;30(2):63–8. doi: 10.1080/13816810802695550. [DOI] [PubMed] [Google Scholar]
- 14.Lois N, Holder GE, Bunce C, Fitzke FW, Bird AC. Phenotypic subtypes of Stargardt macular dystrophy-fundus flavimaculatus. Arch Ophthalmol. 2001 Mar;119:359–369. doi: 10.1001/archopht.119.3.359. [DOI] [PubMed] [Google Scholar]
- 15.Zahid S, Jayasundera T, Rhoades W, Branham K, Khan N, Niziol LM, Musch DC, Heckenlively JR. Clinical phenotypes and prognostic full-field electroretinographic findings in Stargardt disease. Am J Ophthalmol. 2013 Mar;155(3):465–473. doi: 10.1016/j.ajo.2012.09.011. [DOI] [PMC free article] [PubMed] [Google Scholar]
- 16.Fujinami K, Lois N, Davidson AE, Mackay DS, Hogg CR, Stone EM, Tsunoda K, Tsubota K, Bunce C, Robson AG, Moore AT, Webster AR, Holder GE, Michaelides M. A Longitudinal Study of Stargardt Disease: Clinical and Electrophysiologic Assessment, Progression, and Genotype Correlations. Am J Ophthalmol. 2013 Jun;155(6):1075–1088. doi: 10.1016/j.ajo.2013.01.018. [DOI] [PubMed] [Google Scholar]
- 17.Roman AJ, Schwartz SB, Aleman TS, Cideciyan AV, Chico JD, Windsor EA, Gardner LM, Ying GS, Smilko EE, Maguire MG, Jacobson SG. Quantifying rod photoreceptor-mediated vision in retinal degenerations: dark-adapted thresholds as outcome measures. Exp Eye Res. 2005 Feb;80(2):259–72. doi: 10.1016/j.exer.2004.09.008. [DOI] [PubMed] [Google Scholar]
- 18.Roman AJ, Cideciyan AV, Aleman TS, Jacobson SG. Full-field stimulus testing (FST) to quantify visual perception in severely blind candidates for treatment trials. Physiol Meas. 2007 Aug;28(8):N51–6. doi: 10.1088/0967-3334/28/8/N02. [DOI] [PubMed] [Google Scholar]
- 19.Jacobson SG, Cideciyan AV, Peshenko IV, Sumaroka A, Olshevskaya EV, Cao L, Schwartz SB, Roman AJ, Olivares MB, Sadigh S, Yau KW, Heon E, Stone EM, Dizhoor AM. Determining consequences of retinal membrane guanylyl cyclase (RetGC1) deficiency in human Leber congenital amaurosis en route to therapy: residual cone-photoreceptor vision correlates with biochemical properties of the mutants. Hum Mol Genet. 2013 Jan 1;22(1):168–83. doi: 10.1093/hmg/dds421. [DOI] [PMC free article] [PubMed] [Google Scholar]
- 20.Messias K, Jägle H, Saran R, Ruppert AD, Siqueira R, Jorge R, Messias A. Psychophysically determined full-field stimulus thresholds (FST) in retinitis pigmentosa: relationships with electroretinography and visual field outcomes. Doc Ophthalmol. 2013 Oct;127(2):123–9. doi: 10.1007/s10633-013-9393-y. [DOI] [PubMed] [Google Scholar]
- 21.Klein M, Birch DG. Psychophysical assessment of low visual function in patients with retinal degenerative diseases (RDDs) with the Diagnosys full-field stimulus threshold (DFST). Doc Ophthalmol. 2009 Dec;119(3):217–24. doi: 10.1007/s10633-009-9204-7. [DOI] [PMC free article] [PubMed] [Google Scholar]
- 22.Fishman GA, Weinberg AB, McMahon TT. X-linked recessive retinitis pigmentosa. Clinical characteristics of carriers. Arch Ophthalmol. 1986 Sep;104(9):1329–35. doi: 10.1001/archopht.1986.01050210083030. [DOI] [PubMed] [Google Scholar]
- 23.Fishman GA, Farbman JS, Alexander KR. Delayed rod dark adaptation in patients with Stargardt's disease. Ophthalmology. 1991 Jun;98(6):957–62. doi: 10.1016/s0161-6420(91)32196-1. [DOI] [PubMed] [Google Scholar]
- 24.Park JC, Moura AL, Raza AS, Rhee DW, Kardon RH, Hood DC. Toward a clinical protocol for assessing rod, cone, and melanopsin contributions to the human pupil response. Invest Ophthalmol Vis Sci. 2011 Aug 22;52(9):6624–35. doi: 10.1167/iovs.11-7586. [DOI] [PMC free article] [PubMed] [Google Scholar]


