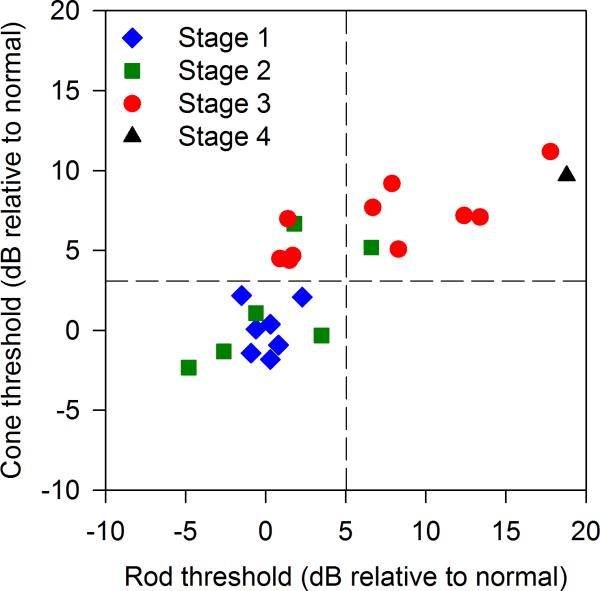
Figure 4.
Stargardt disease patients are categorized by fundus appearance (Stages 1-4), plotting cone threshold (FST cone plateau) vs. rod threshold (FST dark adapted blue stimulus). Note zero dB in this figure is the mean threshold of ten normal subjects on both axes. Vertical and horizontal dotted lines represent 2 standard deviations above the normal mean for rod and cone thresholds, respectively. FST Group 1 (n=11) patient thresholds fall within 2 SD of the normal mean for both rod and cone FST. FST Group 2 patient thresholds (n=5) fall well outside the normal range for cones, but within 2 SD of the normal mean for rods. FST Group 3 (n=8) patient thresholds are all elevated by at least 5 dB above the normal mean (outside the normal range) for both rod and cone FST.

