Abstract
A microwave imaging system for real-time 3D imaging of differential temperature has been developed for the monitoring and feedback of thermal therapy systems. Design parameters are constrained by features of a prototype focused microwave thermal therapy system for the breast, operating at 915 MHz. Real-time imaging is accomplished with a precomputed linear inverse scattering solution combined with continuous Vector Network Analyzer (VNA) measurements of a 36-antenna, HFSS modeled, cylindrical cavity. Volumetric images of differential change of dielectric constant due to temperature are formed with a refresh rate as fast as 1 frame per second and 1°C resolution. Procedures for data segmentation and post-processed S-parameter error-correction are developed. Antenna pair VNA calibration is accelerated by using the cavity as the unknown thru standard. The device is tested on water targets and a simple breast phantom. Differentially heated targets are successfully imaged in cluttered environments. The rate of change of scattering contrast magnitude correlates 1:1 with target temperature.
Index Terms: Microwave breast hyperthermia, microwave breast imaging, inverse scattering, Born Approximation, Distorted Born Approximation, vector network anlayzer (VNA), biomedical imaging, microwave imaging, biomedical monitoring, calibration, temperature measurement
I. Introduction
In recent years, thermal therapies have seen increased use in the treatment of a variety of diseases, particularly in cases of subcutaneous cancers of soft tissue, [1]. In general, these treatments can be classified into two types: (1) thermal ablation, which employs extreme temperatures to induce rapid and localized tissue destruction and (2) hyperthermia, which employs moderately elevated temperatures (typically between 40–45°C) to sensitize tumor cells to the effects of radiation or chemotherapy. Ablative methods include cryoablation, high intensity focused ultrasound, radio frequency ablation, and microwave ablation [2]–[4]. Hyperthermia is typically induced using radio frequencies [5], non-focused ultrasound, and focused microwaves which have been used as an adjuvant to radiation therapy or chemotherapy [6], [7]. For overviews on hyperthermia, heating methods, and the physiological effects of hyperthermia see [8]–[10].
As thermal treatment systems evolve, the need for thermal monitoring has motivated research in several modalities. The use of fiber optic catheter temperature sensors dates back decades across a range of treatment methods [11]–[13]. Probes are fast and accurate, but coverage is limited to the sensor tip and inherently invasive. MRI has been extensively studied for thermal monitoring [14]–[16], especially in ultrasound ablation [17] and microwave hyperthermia [18]. MRI provides full coverage of a treatment region, but is limited by expense, access, and the requirement that a thermal delivery system be MRI compatible. Ultrasonic thermal monitoring has received attention in shear-wave, speed of sound, backscatter variation, and optoacoustic thermal imaging [19]–[22]. Also, microwave thermal imaging in a medical setting has been reported for 2D antenna geometries with inverse scattering techniques [23]. The same system was used to monitor HIFU with 35 second refresh rates [24]. Finally, monitoring provides a mechanism for controlled feedback, which has been reported using real-time MRI guided microwave hyperthermia [25], [26].
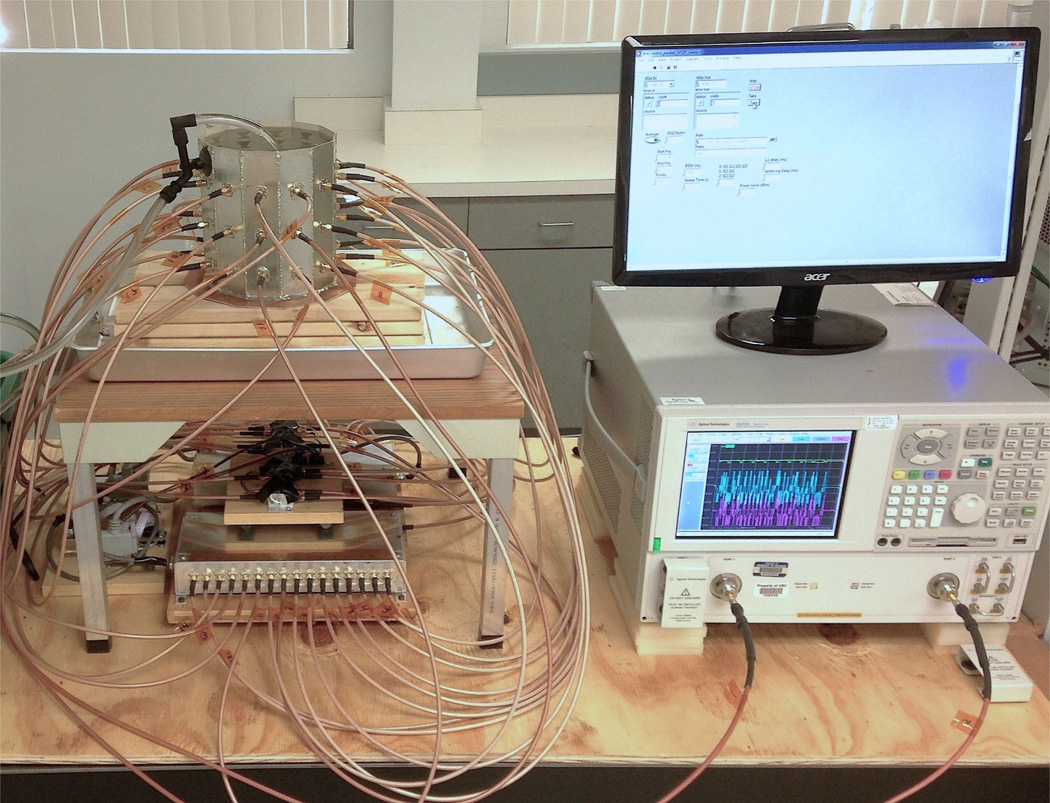
Our interest is the development of microwave-based real-time thermal monitoring within the constraints of focused microwave thermal therapy system parameters in order to avoid the cost and complexities of dual modality implementations. This is done within the design parameters of a previously developed pre-clinical focused microwave prototype for breast cancer therapy [27]. The imaging system here is composed of a cavity-like antenna array at 915 MHz with coupling fluid, vector network analyzer (VNA), and solid-state switching matrix, shown in Figure 1. Using a VNA in this context, with experimental features we developed to do so, obviates the need for custom radar hardware in order to accomplish real-time thermal monitoring. Note that this system, as presented, is designed to image changes in dielectric constant due to the application of microwave heating, rather than image the structure of the breast for diagnostic purposes.
Fig. 1.
Cavity-imaging system for differential temperature imaging with switching matrix, Vector Network Analyzer, Labview control, and fluid circulation.
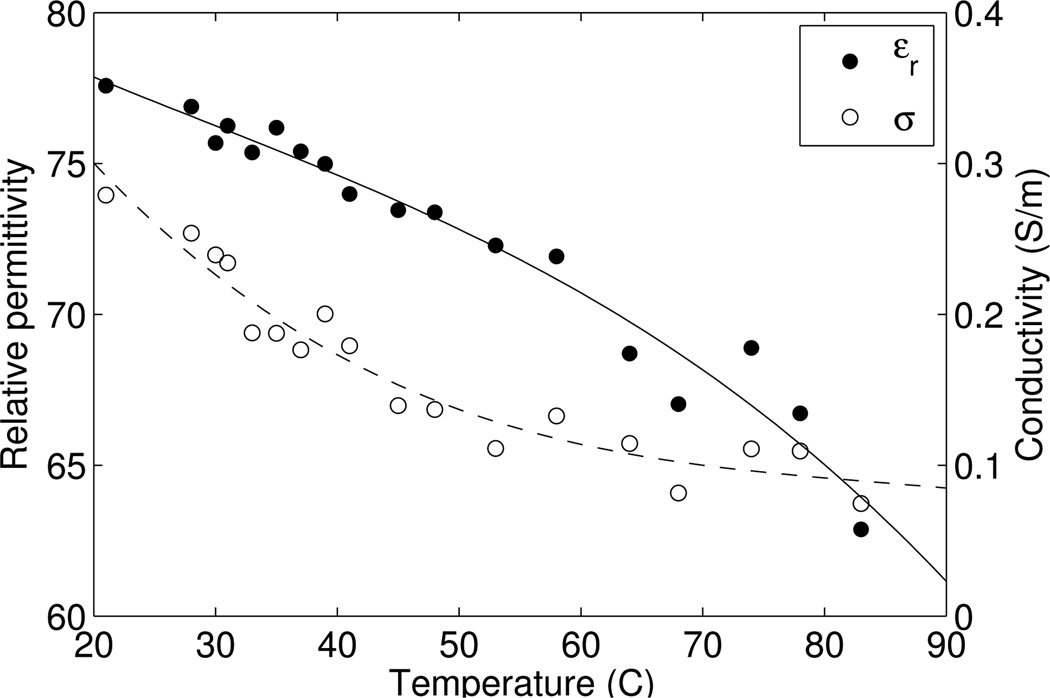
Microwave imaging of differential temperature is predicated on the change in dielectric properties of water with temperature. It is well known that the dielectric properties of water change as a function of temperature [29], [30]. The relative permittivity and conductivity of distilled water as a function of temperature at 915 MHz are plotted in Figure 2. Within the range of thermal therapy temperatures (35°C – 60°C), the relative permittivity of water changes by as much as a few units, and the conductivity up to a factor of 2. The dielectric change of animal liver tissue has been reported to be approximately 1% per C° between 28°C and 53°C at 915 MHz, [31]. Studies of excised breast tissue show that soft-tissue dielectric properties are dominated by water fraction, [32], and are expected to change proportionally with temperature. Thus, even though the dielectric change is small, the ability to detect it has been reported in both medical and non-medical settings [23], [33].
Fig. 2.
Relative permittivity and conductivity of distilled water as a function of temperature at 915 MHz, measured with the Agilent 85070E dielectric probe.
The paper is organized as follows: System design and formulations are given in some detail throughout Section II. We develop new procedures to accelerate VNA calibration by using the cavity itself as an unknown thru standard. Full-wave imaging is enabled by a complete electromagnetic model of the cavity electric fields using Ansys HFSS that is linked to the scattered field integral equations [28]. Real-time imaging is accomplished through a precomputed linear inverse scattering solution that is applied continuously to an updating VNA data stream. Lastly, procedures for data stream segmentation and VNA error-correction are developed. Section III contains imaging results and discussions, where the system is tested on a target with changing temperature in different cluttered environments, including a simple breast phantom. The major findings of this study are listed in the conclusions of Section IV.
II. Methods
A. Imaging System
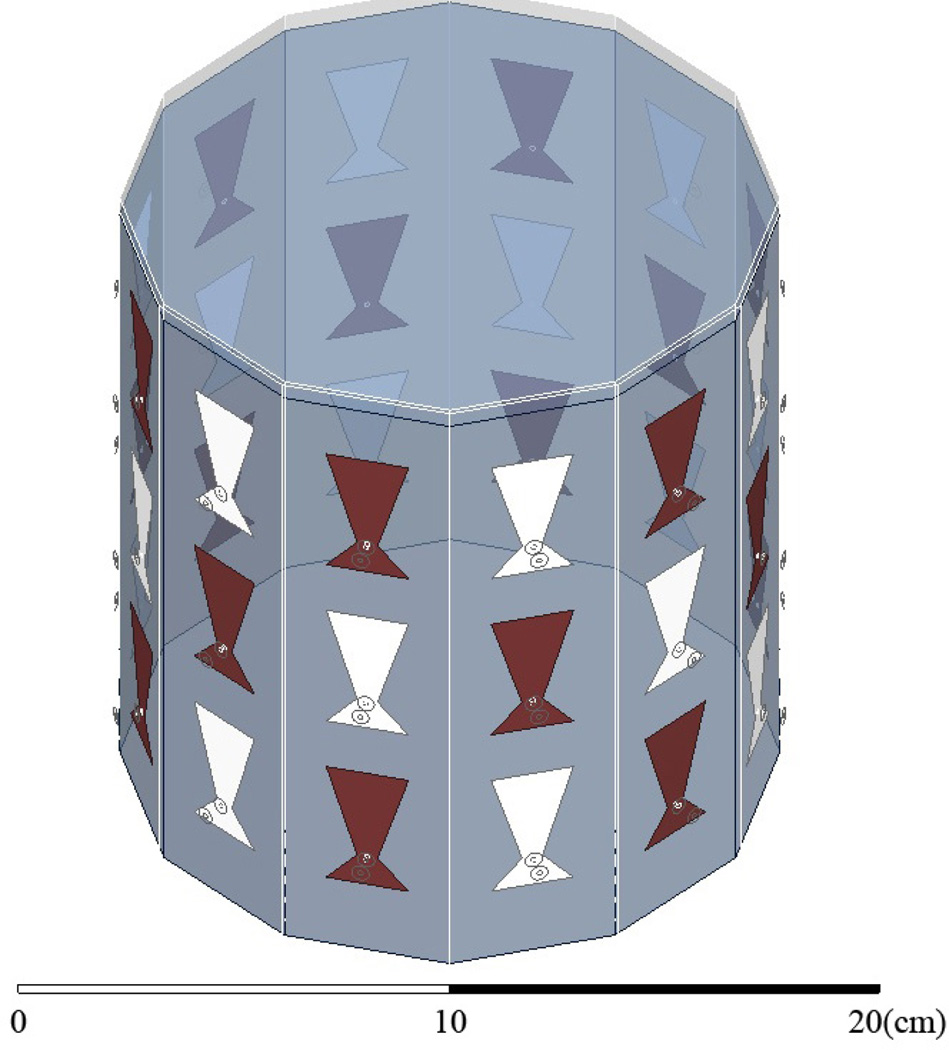
The imaging enclosure is a cavity, shown in Figure 1. It consists of twelve vertical panels of microwave substrate soldered to each other and to a conducting base. Opposing panels are separated by 15 cm, and the cavity is 17 cm tall. There are three antennas per panel for a total of 36 antennas, designed to operate at 915 MHz in a coupling fluid. 2-port S-parameter measurements are taken with an Agilent PNA-5230A Vector Network Analyzer (VNA) between antenna pairs. Pair-wise measurements are routed through 18 transmit (T) antennas and 18 receive (R) antennas using two SP18T solid state switching matrices that connect to Ports 1 and 2, respectively, of the VNA, providing 182 = 324 pair-wise measurements. T/R antennas alternate around the rows of the cavity and between the rows, as shown in Figure 4.
Fig. 4.
HFSS CAD model of the cavity. Antenna shading designates transmitter and receiver. Fluid is filled to 0.5 cm below the top.
The coupling medium is an mixture of isopropyl alcohol and water designed to couple microwave energy into breast tissue. Other fluids have been investigated in the literature: safflower oil [34], oil/water emulsion [28], glycerin [35], and acetone [36], to name a few. The medium is usually chosen to balance conductive loss, relative permittivity, toxicity, antenna match, and ease of use. An alcohol/water mixture is inexpensive, clean, controllable, and not prohibitively lossy at 915 MHz. A 20:7 alcohol:water ratio is used. The dielectric properties of the fluid are measured with the Agilent 85070E dielectric probe kit, at 915 MHz the relative permittivity and conductivity are (εr, σ) = (24.5, 0.460 S/m).
Because the medium is a mixture, it must be circulated to prevent separation. An external aquarium pump recirculates the fluid through a drain in the bottom of the cavity to a nozzle at the top. The drain consists of seven 3 mm holes, mimicking a wire mesh, and thus a continuous boundary at 915 MHz. The fluid exchanges once per minute.
The antennas are bow-tie patch antennas designed originally to operate at 915 MHz in an oil/water emulsion with (εr, σ) = (23, 0.05 S/m), [27], [37]. In the current coupling medium, the resonance remains, but the impedance match is degraded to about −6 dB.
The SP18T switches each consist of one SP16T switch with two Minicircuits ZYSWA-2-50DR SPDT switches connected to two of the paths. The SP16T switches are described in [28]. The ensemble is controlled via computer parallel port. Path isolation is better than 60 dB, except for the Minicircuits switch paths, which are isolated to 40 dB. Differences in attenuation between individual paths are not critical, because each path is individually calibrated.
To maximize the signal to noise ratio (SNR), +13 dBm output power is used, which is the maximum levelled ouput power of the VNA. In addition, the VNA’s 2-port testset is configured to bypass the Port 2 receiver (RCVR) coupler. This increases the Port 2 receiver sensitivity, and thus S21 measurements, by +15 dB, while degrading S12 by −15 dB. However, only S21 is used for imaging.
B. Imaging Cavity used as Unknown ‘Thru’
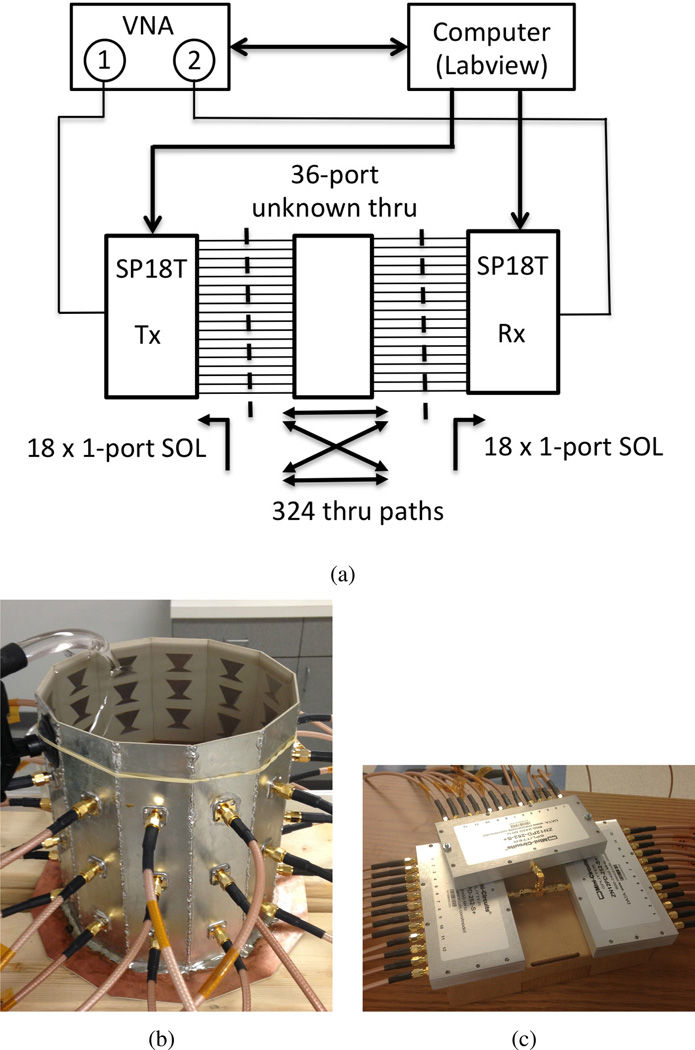
In order to compare cavity S-parameter measurements to HFSS and forward scattering predictions (below), a unique 2-port calibration is required between every T/R combination, 324 in total. To accelerate the process, we use the 2-port unknown ‘thru’ calibration, [38], [39], wherein the cavity itself provides ‘thru’ paths for every T/R pair. Thru measurements are spliced with individual 1-port calibrations to complete the calibration sets (calsets), diagrammed in Figure 3.
Fig. 3.
36-port unknown ‘thru’ calibration. a) Calibration diagram and instrumentation setup. b) fluid-filled cavity used as the unknown thru standard, c) 3 × 1:12 power divider network also tested as an unknown thru.
The calibration procedure follows:
1-port Short-Open-Load (SOL) calibrations are saved for each of the 18 transmit and 18 receive paths.
The paths are connected to the fluid-filled cavity.
A Labview routine selects and switches to a T/R combination.
The VNA loads the 1-port SOL calibrations for that combination, completes the unknown thru measurement, computes the error terms, and saves the calset.
Process repeats at 3).
Excluding time taken for 1-port SOL calibrations, all 324 2-port calsets are completed in 5 minutes.
Unknown thru calibration is accurate to within the sign of S12 and S21. The sign ambiguity is resolved by having rough knowledge of the corrected thru measurement phase, which we do by comparing the phase of corrected S12 and S21 to that predicted by the HFSS cavity model.
The method is validated by comparing cavity measurements collected with two calibration sets. The first set uses the fluid-filled cavity as the thru, the second set uses a 36-port power-divider network shown in Figures 3(b) and 3(c), respectively. The divider network is created by connecting three Minicircuits ZN12PD-252-S+ 1:12 power dividers with a tee. The power divider thru provides nearly equal transmission between all ports, which is not the case for the cavity. Data collection, switching, and calset loading are all automated with Labview. We find that cavity measurements of the incident field S-parameters using either calibration set are identical to within a sign of S12 and S21, confirming that either the cavity or power divider can be used as a multi-way unknown thru standard.
In general, any 36-port device with reasonable transmission characteristics can be used as the thru; the advantage of using the cavity itself is that the thru measurements can be repeated without disassembling the setup. However, recalibration is only necessary if the system configuration changes. Overall, this addresses for the first time the unsolved problem in microwave medical imaging of how to efficiently and repeatedly calibrate multi-sensor systems for VNA measurements.
C. HFSS Numerical Model
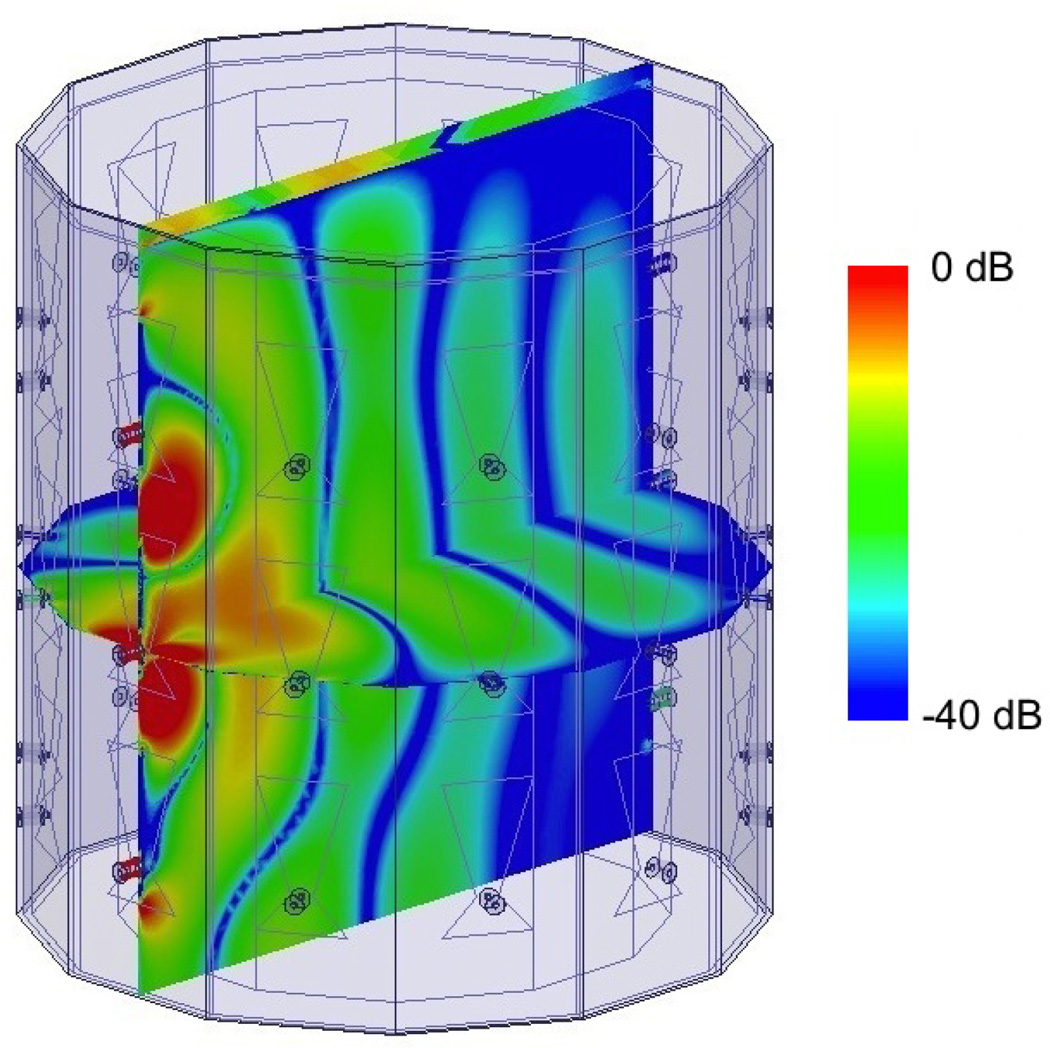
We use Ansys HFSS to numerically model the cavity, similar to our work in [27], [28], which requires us to match the S-parameter reference planes between simulation and experiment. We use HFSS to estimate the incident fields throughout the cavity, which include all background multiple scattering not present between the object and the cavity, and are used in the forward scattering model (below). Figure 4 shows the HFSS CAD model; antennas are shaded as transmitters and receivers. Figure 5 shows the incident field of one antenna. The drain is assumed to be a continuous copper sheet.
Fig. 5.
Cross cuts of log(|ℜe(Ez)|) of the normalized incident field for an antenna in the middle row. The walls are PEC; the top surface radiates to air.
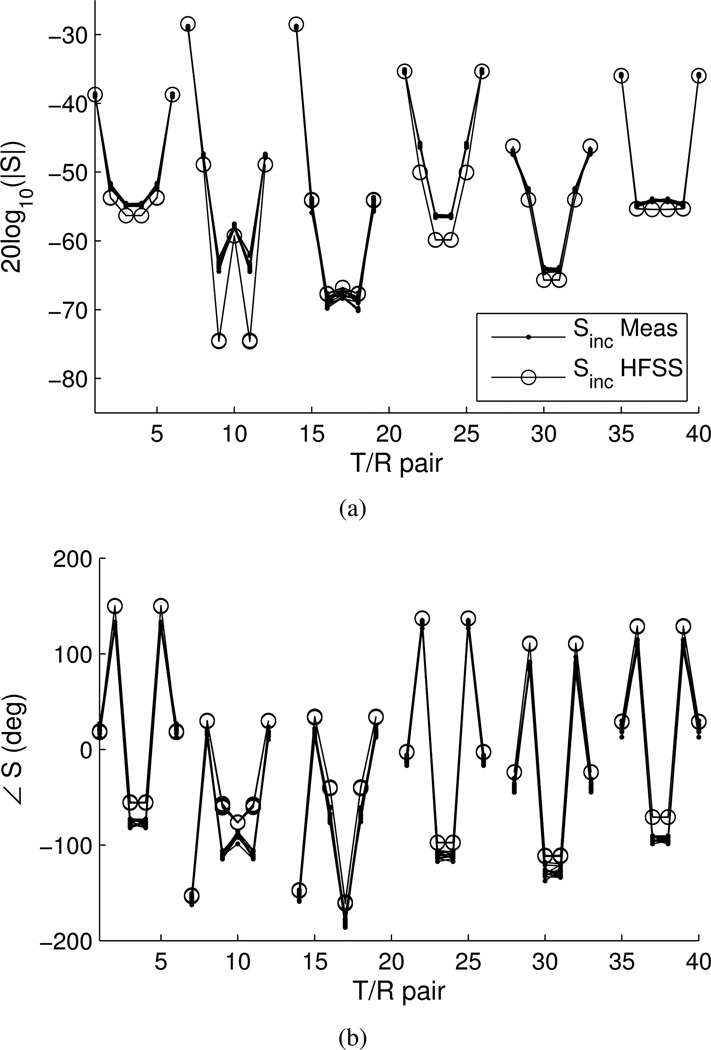
We compare measured and simulated incident S-parameters to assess the accuracy of the HFSS model. Figure 6 shows the magnitude and phase, respectively, of the measured and simulated incident S21 S-parameters. The plots overlay circular-symmetric T/R paths, grouped according to the 6 row-row interaction combinations. The groupings from left to right are: middle-middle, middle-top, middle-bottom, top-top, top-bottom, bottom-bottom. We plot the data this way to assess the symmetry of both the cavity measurements and HFSS simulation, as well as compare them. In general, the magnitude agrees to within 2 dB, and the phase agrees as well as 5 degrees but no worse than 30 degrees. Agreement is best between antennas in the same row.
Fig. 6.
Measured and HFSS incident S-parameters. a) Magnitude, b) phase. Symmetric combinations are overlaid and grouped by row-row interaction.
D. Forward Scattering Model
The forward scattering model predicting the scattered field S-parameter between a transmitter i and receiver j in the presence of an object is given by [28], [40],
| (1) |
where Ei is the total object field produced by the transmitter and Einc,j is the incident field of the receiver.
The object function is defined as
| (2) |
where ω is the operating frequency in radians, and the background permittivity is εb = εoεrb with relative permittivity εrb. The contrasts are given by
| (3) |
| (4) |
where σb is the background conductivity, δε(r) is unitless and δσ(r) is an absolute measure of conductivity with units of S/m.
The constant is given by, [40],
| (5) |
where ko is the lossless background wavenumber, , is the characteristic impedance of the receiver transmission line, and and are the excitations at the S-parameter reference planes of the transmit and receive antennas, respectively.
When we estimate the cavity fields with HFSS, the constant simplifies. In simulation, the average transmit power is set to 1 Watt, thus the line voltage is
| (6) |
where the phase of ao is zero because the S-parameter reference planes of the HFSS model and the cavity are the same. Equation (5) reduces to
| (7) |
Finally, in measurement, the scattered field S-parameters are obtained by subtracting the S-parameters for the total and incident fields
| (8) |
To increase the accuracy of (1) when we compare it with measurement, we normalize both sides by the incident field S-parameters, careful to distinguish simulation from measurement,
| (9) |
This helps eliminate multiplicative systematic errors, such as a phase shifts.
E. Differential Scattering
Because the change in the dielectric constant of water due to temperature is small, we can formulate the inverse scattering problem as a perturbation about a background object, where a distorted-type volume integral equation (VIE) is most natural [41], [42]. Formulating the inverse scattering problem this way permits the use of differential total field measurements between heated and unheated objects, which helps eliminate additive systematic errors. We further augment the distorted VIE with the normalizations and multiplying constant of Equation 9. Also, real-time imaging relies on precomputing the inverse scattering solution, as described in the next section. This can only been done with a constant field estimate: two such estimates are provided in this section.
Let the unheated background object be designated Ob(r), with total field Eb, and scattered fields , and let the heated objected be Oh(r), with total field Eh, and scattered fields . For the case of a differential object measured against a background inhomogeneity, Equation (1) becomes, [41],
| (10) |
where the volumetric differential scattering contrast between the heated and unheated objects is given by
| (11) |
and the differential scattered field is given by
| (12) |
The right side of Equation (12) results from cancellation of the incident S-parameters, where is the baseline object measurement and changes with temperature. Note that and are direct measurements.
Two approximations of Equation (10) are possible. The first is the traditional Born Approximation (BA), in which the total fields are equal to the incident field. The second is the Distorted Born Approximation (DBA), where Eh = Eb. Both are conceptually similar: in the BA, the incident fields are those of the empty cavity, in the DBA, the incident fields are those in the background object. Differential scattered fields for the two cases are given by
| (13) |
| (14) |
The choice of approximation depends largely on the information available. The BA requires simulation of only the empty cavity. The DBA requires knowledge of the total fields in the background object, and thus the dielectric properties of the unheated object. These properties can be estimated through a full inverse scattering treatment (e.g., BIM, DBIM, [41]), that simultaneously estimates the total fields. Alternatively, the object properties can be inferred, for instance, from an MRI study, [43], after which the total fields are computed with one pass of a full-wave solver that captures object-cavity scattering interactions. In general, the DBA is preferred because it is the appropriate approximation for differential scattered field measurements. For simplicity, we use the BA in the experiments below, and show that it yields reasonable results.
F. Precomputed Linear Inverse Scattering Solution
The crux of real-time quantitative imaging is precomputing the inverse scattering solution. This can only be done with a fixed field approximation, such as before. Linearization consists of discretizing the integral equation, after which the object is estimated by comparing forward model predictions to differential scattered field measurements. The cost function we use to measure the difference between forward model predictions and data is, [44],
| (15) |
The vector norms and are defined by the inverse data and model covariance operators, and , respectively. G is the discretized linear forward operator, the vector d contains S-parameter measurements, and m is a complex vector of pixels of the differential object.
The least squares solution of Equation (15) in matrix form is, [44],
| (16) |
where m̃ is the object estimate. If the data and image pixels are separately independent, and the noise and pixel uncertainties are constant, then the inverse covariance matrices are scalars equal to and , respectively. Equation (16) reduces to
| (17) |
which is the familiar regularized normal equations solution with Tikhonov parameter λ = σd/σm.
Given an SVD decomposition G = USV*, Equation (17) can be written
| (18) |
where
| (19) |
The matrix M, once computed and stored, is applied in real-time to d to obtain a new object estimate.
G. Real-time Data Processing
We use Labview and Matlab in tandem to collect the scattered field measurements and process and display images in real-time. Labview controls the VNA and the switches; Matlab processes the data and computes the image. We trigger the VNA to save a single data stream as the switches cycle through every T/R pair. Matlab actively checks for new data files, and then segments the data stream and produces the image. Details follow:
1) VNA data stream
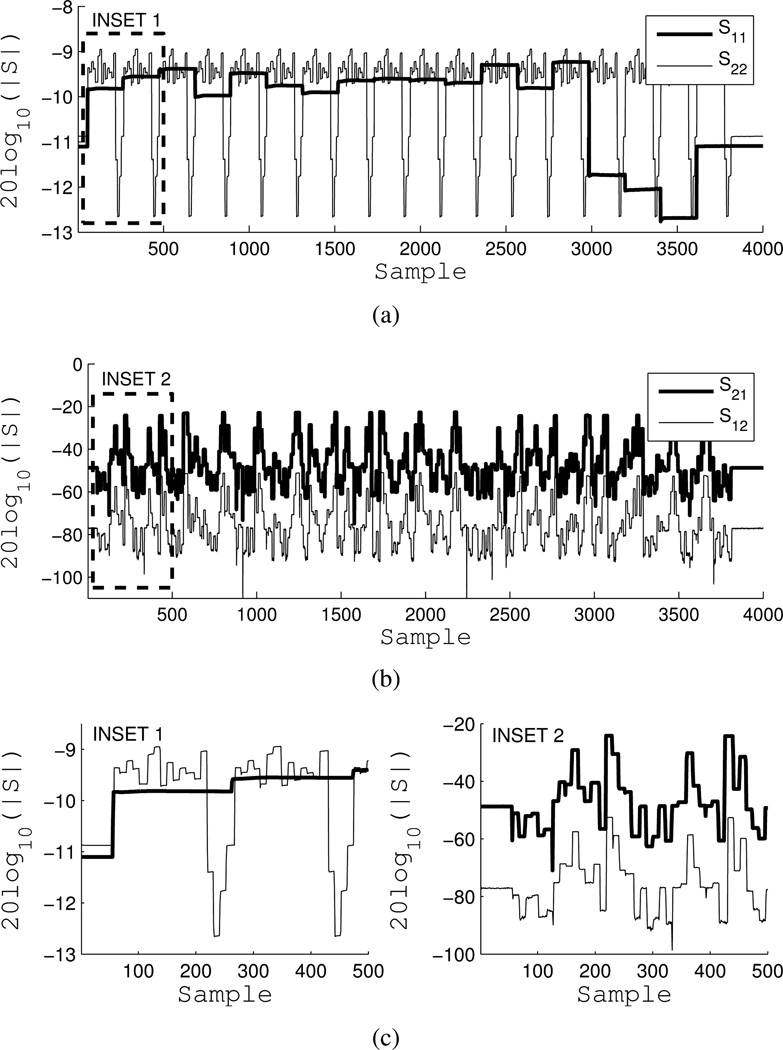
All pair-wise scattering parameters are collected by the VNA in a single measurement. The VNA triggers a 4000 point, 2.1 second CW measurement at 915 MHz with an IF bandwidth of 2 kHz. The switches are cycled through all 324 T/R combinations throughout the duration of the measurement to produce a data stream of S-parameters for all T/R combinations. 6 milliseconds per path yields approximately 10 points per T/R pair. In actuality, the VNA triggers twice: the first trigger sources Port 1 to record S11 and S21, the second trigger sources Port 2 to record S22 and S12. As a result, the switches are cycled twice, and an entire data set is collected every 4 seconds. Because the data stream is a single measurement and captures the response of all T/R paths, S-parameter error correction must be turned off and applied in post-processing.
Figure 7 shows the magnitude of a raw incident field data stream of all four S-parameters. S22 and S12 are retrospectively aligned with S11 and S21. S11 is measuring the reflection coefficients of the transmit antennas, while S22 measures the reflection coefficients of the receive antennas. Receivers are cycled per transmitter, hence the 18 × 18 nested pattern in Figure 7(a). Lower reflection coefficient magnitudes are due to longer uncorrected paths through the SPDT Minicircuits switches. Figure 7(b) shows S21 and S12. S21 is approximately 30 dB higher than S12, due to the power level asymmetry created by the Port 2 RCVR coupler bypass and the fact that error correction is off. Figure 7(c) shows insets of the same.
Fig. 7.
VNA data stream of a single 2-port S-parameter measurement while the switching matrix cycles over all 324 T/R combination. Sweep is 4000 points, 2.1 seconds, at 915 MHz. a) S11 (transmitters) and S22 (receivers), b) S21 and S12 (30 dB differential from RCVR bypass), c) insets of a) and b).
2) S-parameter error correction
As mentioned, error correction is turned off during the sweep and applied after segmentation (below). The 12-term error model is given in Appendix A. The error terms for all T/R 2-port calibrations are downloaded with Labview using Agilent VNA-SCPI commands. The 12-term model was cross checked against VNA-calibrated data sets, including those from the unknown thru tests, with identical results.
Technically, all 4 S-parameters are required in the 12-term error model, but for imaging we only use S21. In the equation for corrected S21, the contribution of S12 is third order, so it is safely set to zero since it is already 30 dB lower. In future work, we will investigate the possibility of treating S11 and S22 as constant in differential scattering scenarios to reduce data collection time. In initial tests not reported here, we have been able to refine the data collection to less than one second.
3) Data stream segmentation
After a new data set is detected and loaded by Matlab, the data streams for S11, S21 and S22 are segmented to extract individual T/R measurements as follows:
Separate real and imaginary parts.
Apply a fast 1D Total Variation (TV) filter [45]. This preserves the block-like pattern of the data stream while smoothing the steps.
Compute the next-neighbor discrete difference. Take the absolute value. Spikes denote segment transitions. The TV filter is necessary to prevent noise from corrupting this step.
Threshold the combined discrete differences of the real and imaginary parts.
Check for 324 segments; discard the data set if fewer are detected.
Average the points within a segment, excluding transitions.
Apply error correction to the segmented T/R data (Appendix A).
Correct the S21 phase ambiguity with the HFSS model (correction is predetermined).
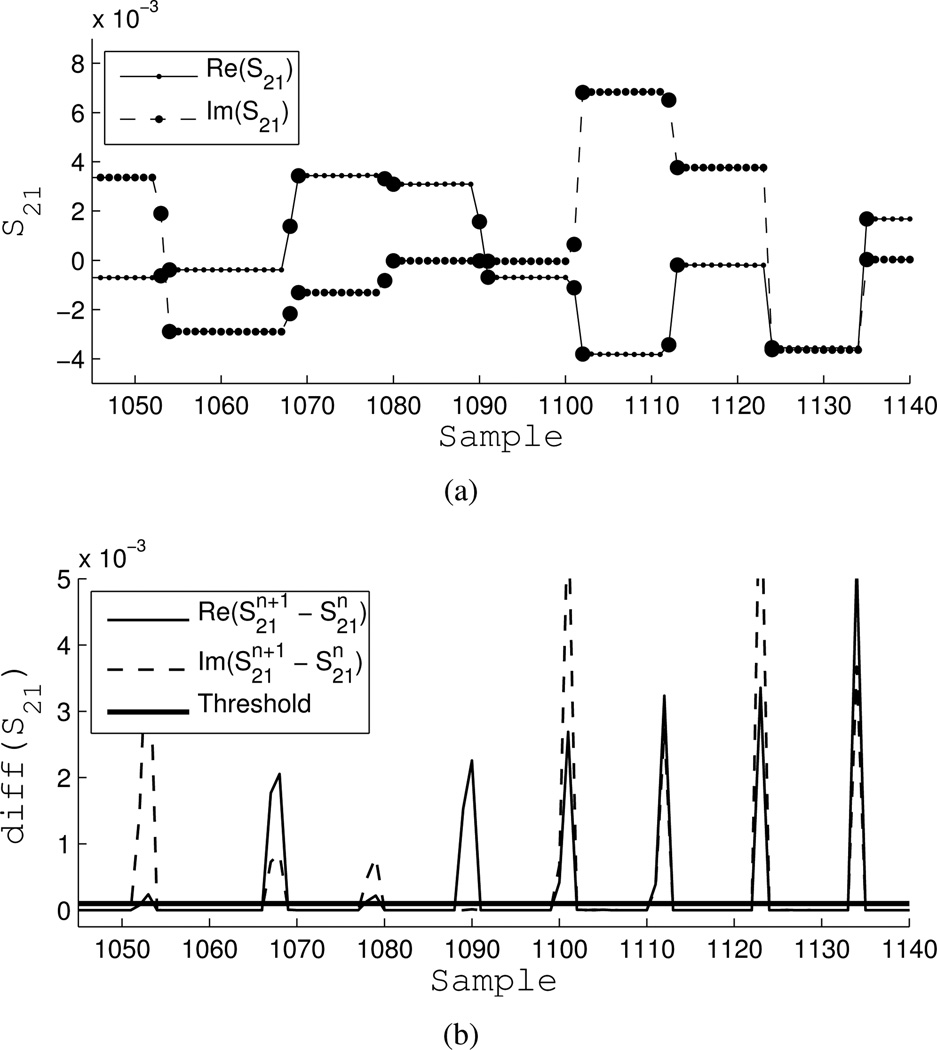
Figure 8(a) illustrates the segmentation of the real and imaginary parts of a portion of the S21 data stream. Transition points are highlighted and excluded. Figure 8(b) shows the absolute value of the next-neighbor discrete differences with the threshold. The threshold was chosen by trial and error.
Fig. 8.
Example of segmentation. a) Real and imaginary parts of S21, large circles are transition samples. b) Threshold of absolute value of next-neighbor discrete difference.
Because segmentation is based on a discrete-difference, it is robust to timing inconsistencies. This is important because the exact number of points per segment can vary due to VNA triggering, CPU allocation, or parallel port signaling. However, it is now sensitive to noise, hence the need for the TV filter. Also, counting errors can occur if two adjacent data are exactly the same. Practically speaking, this is rare and usually due to bit errors, and will be handled in future versions of this system.
After segmentation and error correction, data are mapped to the vector d in Equation (18) and a new image is formed by multiplying it with the precomputed inverse scattering solution. The entire post-processing and image formation sequence takes a fraction of a second.
III. Results and Discussion
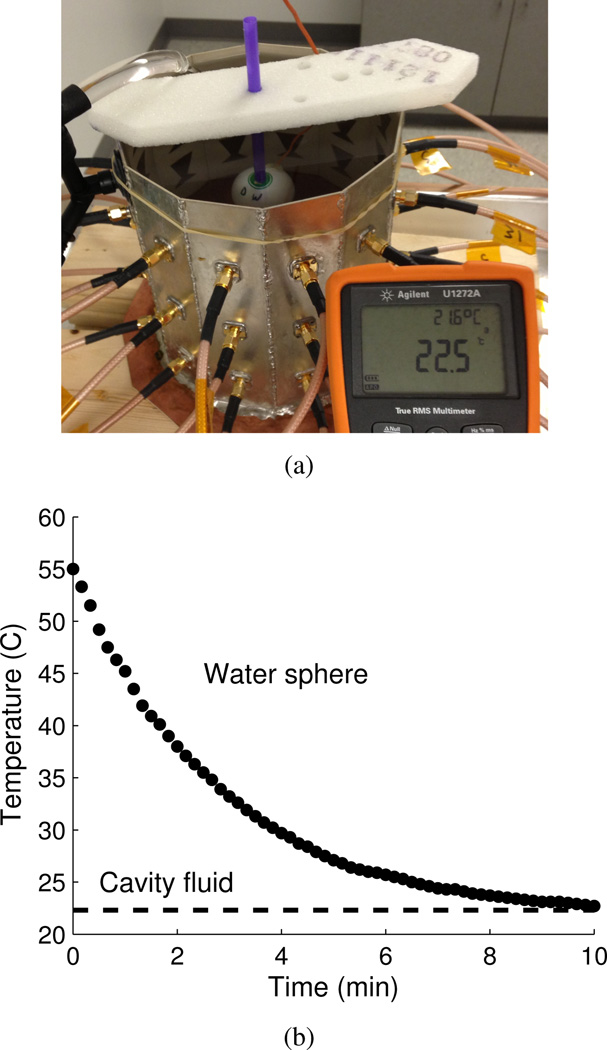
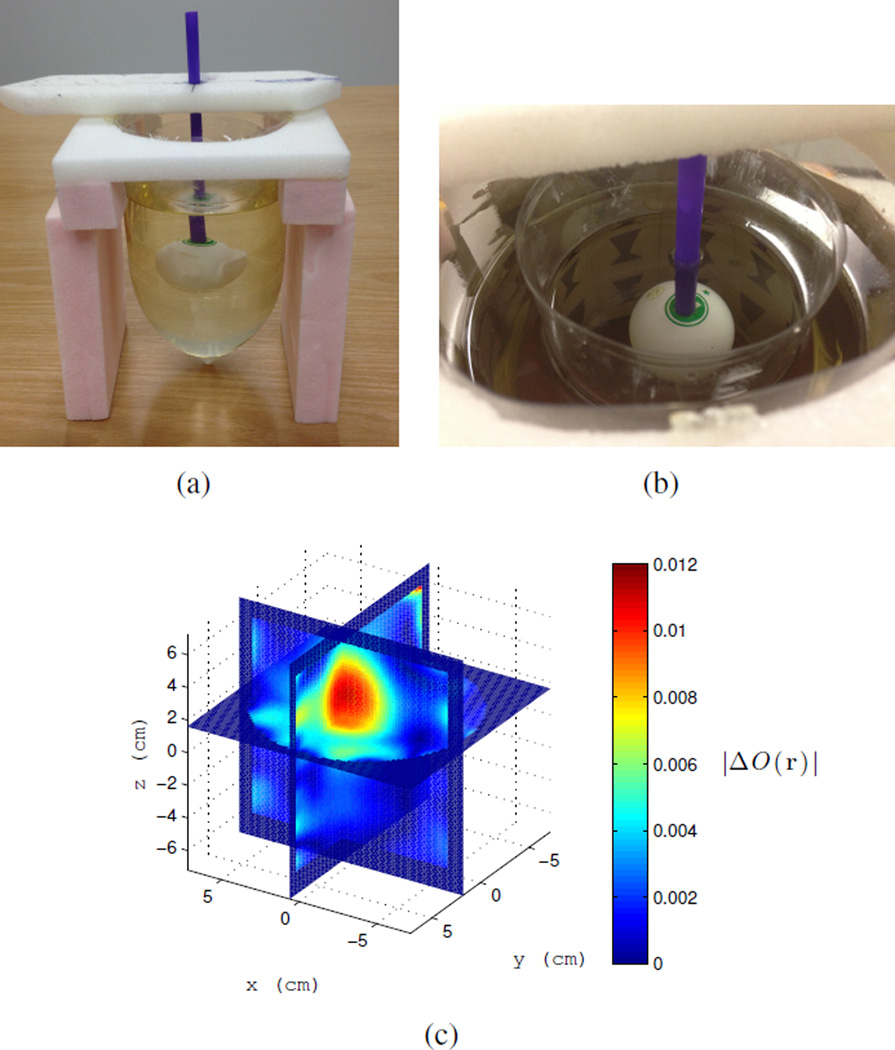
The target used to create a differential change in dielectric properties due to a change in temperature is a 4 cm diameter ping-pong ball that is filled with water and sealed. This is meant to emulate the size and shape of a thermal therapy focal spot in this cavity at 915 MHz, which is approximately 3 cm in diameter, [27]. The target is heated to approximately 55°C in a water bath then placed in the cavity and imaged while it cools. The target is held with a thin plastic straw and suspended from a piece of rigid, low-dielectric ROHACELL foam as shown in Figure 9(a). As a control, we measure the change in temperature with an embedded thermistor as the target cools to the ambient cavity temperature of about 22.5°C, the plot is shown Figure 9(b). In reality, the time-dependent temperature profile of the target is more complicated than can be represented by a single thermistor measurement; improvements to this method are listed in the conclusion.
Fig. 9.
a) Control target: water-filled ping-pong ball with embedded thermistor, shown here cooling in the cavity from approximately 55°C to 22.5°C. b) Plot of ping-pong ball control target temperature vs. time in the cavity. Dotted line is the ambient temperature of the cavity fluid of 22.5°C.
In the examples that follow, the thermistor is removed and we assume that the target cools at the same rate as the control. Also, the heated object at time zero is taken as the background object. Thus, we track a differential change in dielectric properties as the target goes from a higher temperature to lower temperature. This is the reverse of what occurs in most thermal therapy systems. We do this for experimental convenience since the temperature dependence of dielectric constant of water remains the same whether the water heats up or cools down, which we will detect as an overall change in scattering contrast.
In addition, although the inversion estimates complex ΔO(r), we display images of |ΔO(r)|. This is because |ΔO(r)| is a measure of the overall change in scattering contrast relative to the background. It avoids ambiguity in simultaneous inversion of both relative permittivity and conductivity, without the need to assert stringent a priori relations between them. In its current form, the inversion obtains the correct sign of the complex contrast for non-differential images of simple targets. For differential imaging and the BA, we have found that the inversion can split the scattering contribution differently between the two properties for different objects. This issue will be improved upon in future versions. Despite this, the relation between |ΔO(r)| and the total scattered field power is conserved through the L2 norm of the cost function. Thus, it is theoretically sufficient to correlate |ΔO(r)| with temperature to accomplish differential thermal monitoring provided that the contrast changes. This is verified empirically in the following examples.
In all the examples that follow, 3D images of |ΔO(r)| are computed every 4 seconds, pixelated at 2 mm. The imaging regions are cylindrical, and we note that the images are not interpolated.
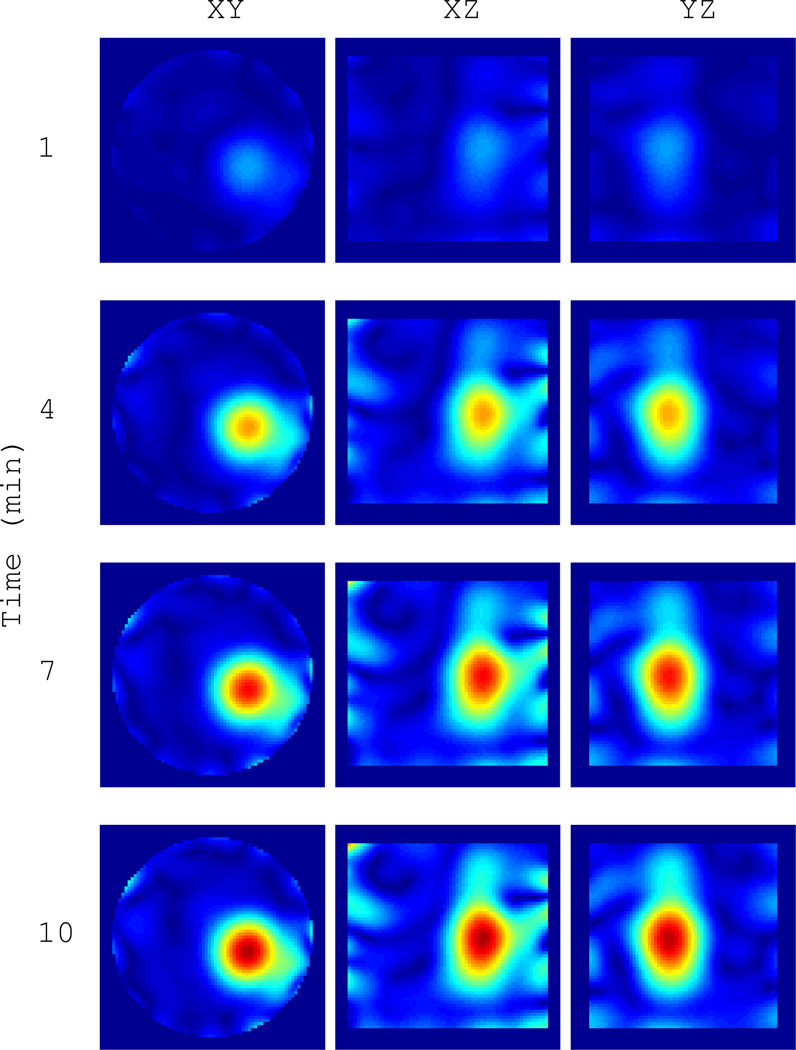
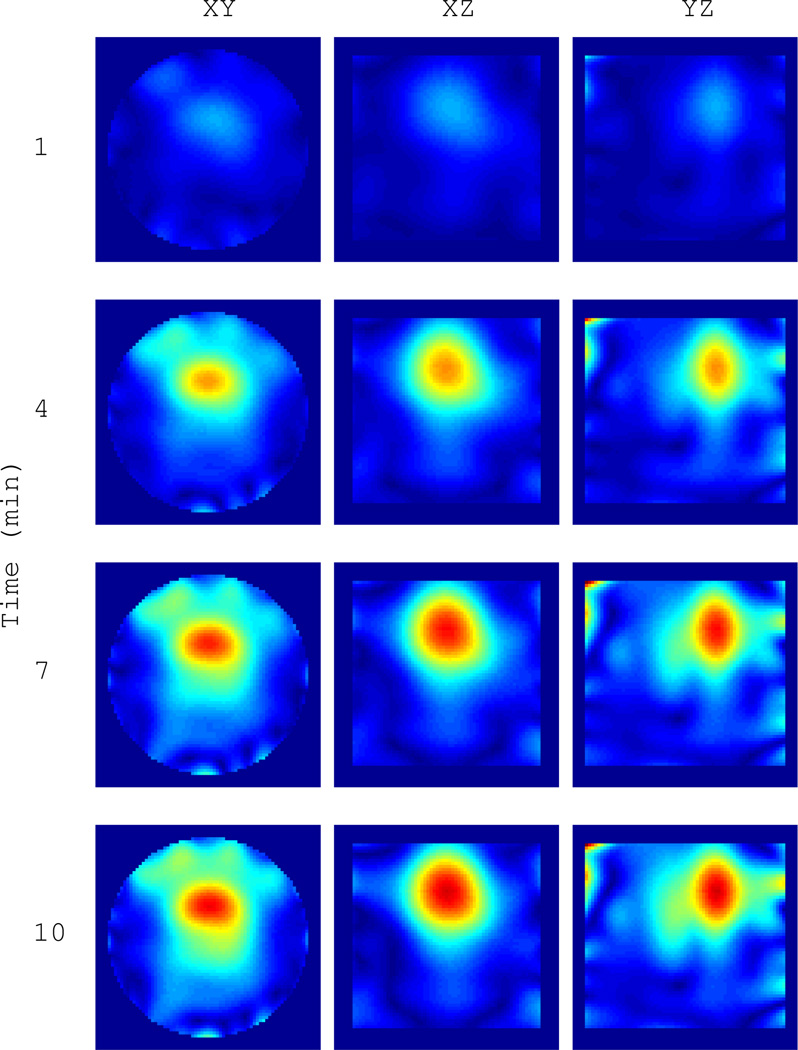
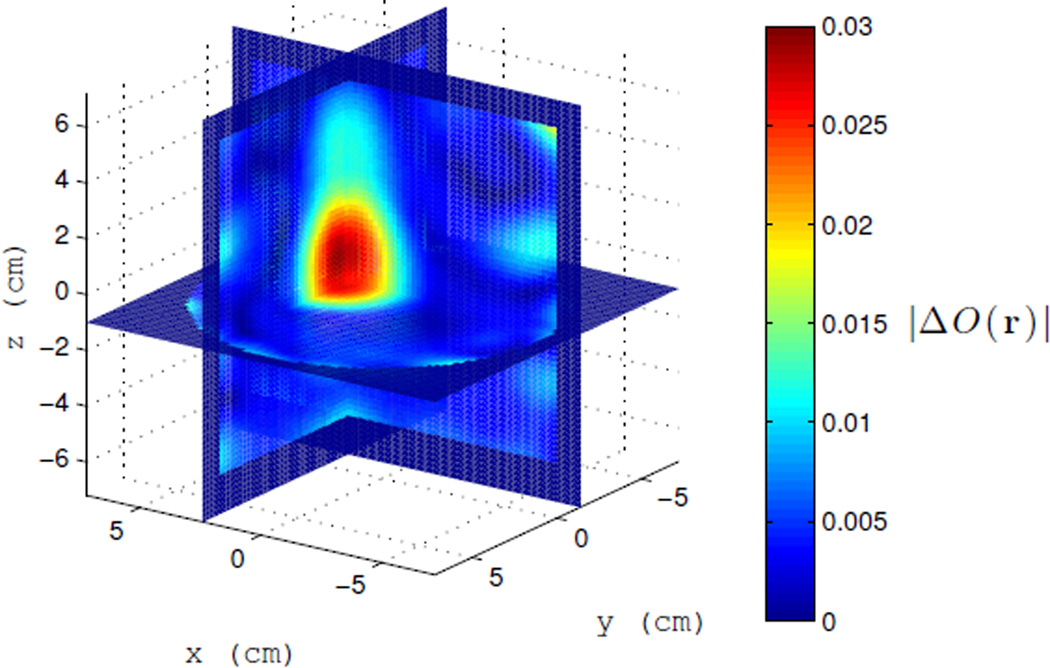
Example 1: We first image one 4 cm isolated water-filled ping-pong ball as it cools from 55°C to about 22.5°C. This is the same ball as shown in Figure 9(a) without the thermistor. The heated ball is taken as the background object and the BA is appropriate for the field estimate. A 3D slice view of the final image in the sequence, after the ball has reached the ambient cavity temperature, is shown in Figure III. This represents the maximum differential change in the scattering contrast. A time series at {1,4,7,10} minutes is shown in Figure 11. The magnitude of the contrast clearly increases and settles after 10 minutes. The sphere is well resolved, demonstrating a resolution of 3–4 centimeters, which is on the order of the thermal therapy focal spot size in this cavity.
Fig. 11.
Time series of |ΔO(r)| for the water target in Figure 10 as it cools from 55°C to 22.5°C over 10 minutes. Images are formed every 4 seconds. The heated sphere at time zero is taken as the background object. Cuts are through the peak contrast.
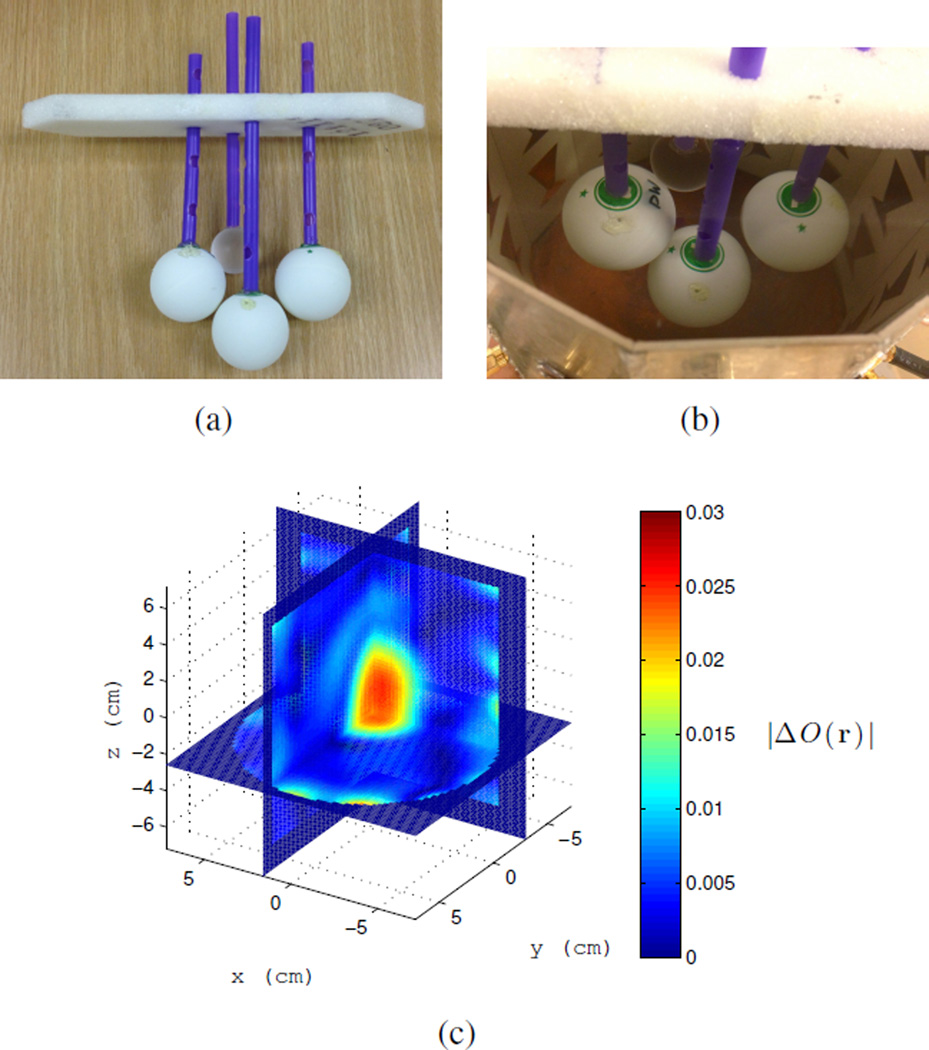
Example 2: The same 4 cm water-filled ping-pong ball is heated and imaged as it cools while in the presence of three other objects. These objects consist of two water filled ping-pong balls and a 1 inch diameter acrylic sphere that act as clutter shown in Figure 12(a). Again the BA is used for the fields. This example is meant to test how well the differential contrast can be detected under the BA in the presence of clutter. A 3D slice of the final image and its time series are shown in Figures 12(c) and 13, respectively. The change in contrast with temperature is clearly visible. The peak contrast is slightly lower than Example 1 and more artifacts are present. The artifacts are likely due to decreased accuracy of the BA as well as the fact that the imaging domain encroaches on the near-field of the antennas, where fields have high spatial gradients. The latter effect can be reduced with a larger diameter cavity. Overall, this shows that a change in temperature can be imaged in the presence of clutter and that the differential measurement successfully subtracted most of the unwanted object scattering.
Fig. 12.
a) Cluster of four targets; only the left target is heated. b) Targets in the cavity. c) |ΔO(r)| after the water target in clutter has cooled from 55°C to 22.5°C. Cluster with heated target is taken as the background object at time zero. Time series shown in Figure 13.
Fig. 13.
Time series of |ΔO(r)| for the water target in clutter in Figure 12(c) as it cools from 55°C to 22.5°C over 10 minutes. Cuts are through the peak contrast.
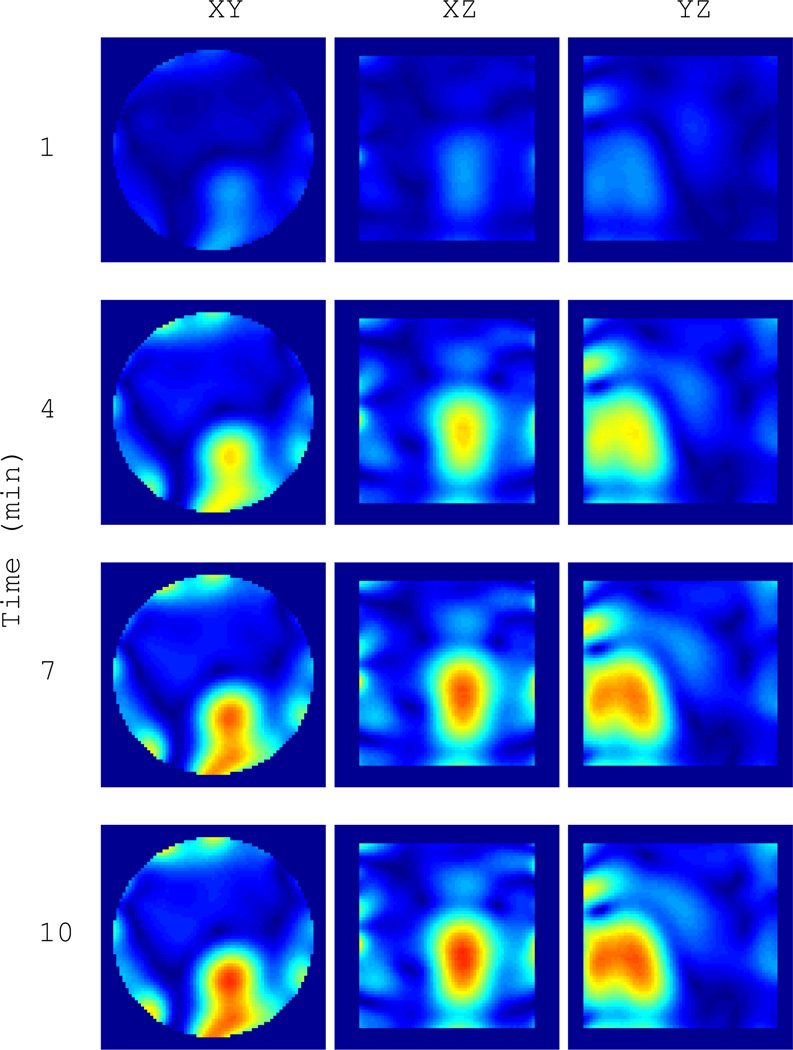
Example 3: The final example is a simple breast phantom with heated target, shown in Figure 14. The phantom consists of two plastic bottles creating inner and outer chambers. The inner chamber is filled with the cavity fluid, meant to mimic the dielectric properties of glandular breast tissue; the outer chamber is filled with vegetable oil to mimic the lower dielectric properties of fatty breast tissue. A 3D slice view of the final image and the time series are shown in Figures 14(c) and 15. The target and time-varying contrast are clearly distinguishable. The peak magnitude is slightly lower than that in Examples 1 and 2. Similar to Example 2, the decrease in contrast magnitude and target blurring is attributed to decreased accuracy of the BA, with the additional possibility that the heat from the object is not convected from the immediate surroundings of the target as it was in the other examples. Still, the ability of the differential formulation to successfully subtract the background scattering of the phantom is apparent. It also demonstrates that the BA is actually sufficient for an object where we might otherwise expect the BA to fail. Thus, it is reasonable to conclude that the system, as realized, has met the requirements for practical thermal monitoring.
Fig. 14.
Double chambered breast phantom with vegetable oil and coupling fluid. Heated target placed in inner chamber. a) Breast phantom with target. b) Phantom in cavity. c) |ΔO(r)| after the water sphere has cooled. Time series shown in Figure 15. Only differential temperature is detected.
Fig. 15.
Time series of |ΔO(r)| for the phantom in Figure 14(c). Phantom and heated target are taken as the background object at time zero. Cuts are through the peak contrast.
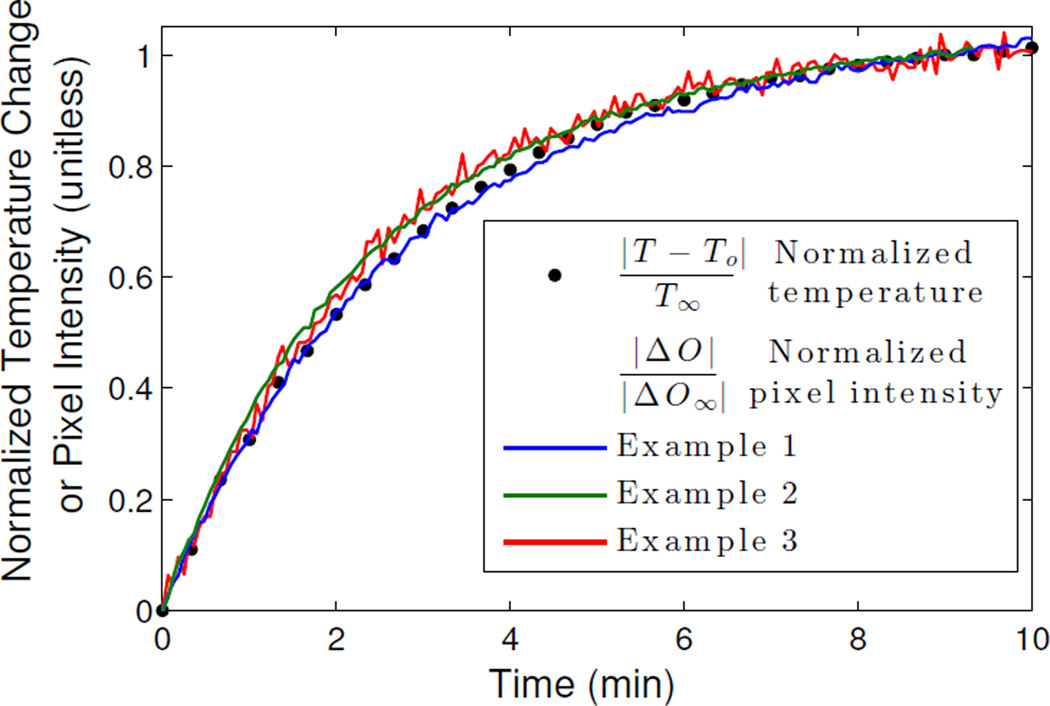
To correlate the image with temperature, we compared the pixel intensity at the center of the detected target in each example over time against the temperature curve of the control target in Figure 9(b). We have normalized the curves in order to compare the rates of change with time. Again, complete images are formed every 4 seconds, from which we take the pixel of peak contrast. As shown in Figure 16, we find that the scattering contrast of all three targets correlates nearly 1:1 with temperature as function of time. We can also infer from these plots that the change in scattering contrast of water is nearly linear with temperature in the range of hyperthermia temperatures, which is consistent with the findings in [23]. Furthermore, this relation is observed across all of the imaged scenarios (sphere, clutter, phantom), despite using the BA for the field estimate.
Fig. 16.
Normalized pixel intensity at the center of the detected target in Figures 11, 13, and 15 at every time step plotted against the normalized temperature of the control target in Figure 9(b). Pixel intensity rate of change tracks 1:1 with temperature.
To determine the temperature resolution, we fit a fourth-order polynomial to each of the three pixel intensity curves of Figure 16, and compute the standard deviations of the residuals. For Examples {1, 2, 3}, respectively, the standard deviations are σ = {0.0062, 0.0045, 0.0163}. The temperature resolution is taken as ΔT = 2σ|T∞ − To|. The temperature of the target ranges from approximately 55°C to 22°C, thus we conclude that we can resolve a temperature change in each case to ΔT = {0.41, 0.30, 1.1} °C.
IV. Conclusion
We have developed a real-time microwave imaging system to image differential temperature based on change in dielectric properties of water with the goal of achieving non-invasive temperature monitoring for thermal therapy systems.
The system and method consist of a cavity-like imaging structure that is fully modeled in HFSS and coupled with a precomputed linear inverse scattering solution. The solution is applied in real-time to a segmented VNA data stream that captures all pairwise scattered field measurements. VNA calibration of T/R antenna pairs is accelerated by using the cavity as an unknown thru standard. The system is tested on water targets with changing temperature. Changes in scattering contrast due to temperature were successfully imaged in cluttered environments, including a simple breast phantom.
This study has produced five findings: 1) the dielectric change of water over the hyperthermia temperature range (35°C – 60°C) is easily detectable with the proposed noninvasive setup at 915 MHz, 2) real-time microwave imaging of differential temperature is possible within the constraints of microwave thermal therapy system parameters using a VNA, 3) The spatial resolution of thermal imaging is on the order of the thermal therapy focal spot size in this cavity, 4) 3D images of differential temperature can be formed with 1°C sensitivity at refresh rates of 4 seconds or better, 5) the rate of change of scattering contrast magnitude correlates 1:1 with target temperature for a variety of objects.
Future work will expand on these findings to hone the system for clinical use. In particular, we will evaluate the sensitivity of the system in moderate-temperature hyperthermia regimes (3–8°C change above the background), as different from the large temperature gradients used in thermal ablation. We will investigate integration of this system with a focused microwave heating system, such as [27]. Also, metrics needed to quantitatively relate differential scattering contrast to absolute temperature will be further developed. This will be done by reexamining the inverse scattering formulation together with more extensive empirical testing of dielectric-temperature relationships. In addition, work will also include more detailed temperature mapping of the control target by using multiple thermistors as well as comparison with theoretical heat-diffusion profiles. We will also investigate the effects on image quality of having better knowledge of the object fields through full-wave modeling of numerically realistic phantoms in order to assess the benefits of the DBA versus the BA. Finally, faster limits of data collection and image formation will be investigated. The refresh rate is limited primarily by the data acquisition system, and initial investigations suggest that the current system can provide refresh times better than 1 second.
Fig. 10.
Image of |ΔO(r)| after the target has cooled from 55°C to 22.5°C. The initial heated object is taken as the background object at time zero. The time series shown in Figure 11.
Acknowledgments
This research was supported in part by the Department of Defense, Breast Cancer Research Program, DoD/BCRP award number BC095397 and the National Institute of Health T32 EB005172.
Appendix A
VNA 12-Term Error Model
Given uncorrected 2-port measurements S11m, S21m, S12m, and S22m, the corrected S-parameters computed with the standard 12-term error model are [46],
| (20) |
| (21) |
| (22) |
| (23) |
where
| (24) |
| (25) |
| (26) |
| (27) |
| (28) |
For convenience, Table I lists the error terms and their corresponding SCPI designations in Agilent PNA-type network analyzers at the time of publication.
TABLE I.
| Error Term |
Description | VNA SCPI Name |
|
|---|---|---|---|
| e00 | Directivity(1,1) | EDIR,1,1 | |
| e33 | Directivity(2,2) | EDIR,2,2 | |
| e11 | Sorce Match(1,1) | ESRM,1,1 | |
|
|
Source Match(2,2) | ESRM,2,2 | |
|
|
Load Match(1,2) | ELDM,1,2 | |
| e22 | Load Match(2,1) | ELDM,2,1 | |
| e10e01 | Reflection Tracking(1,1) | ERFT,1,1 | |
| e23e32 | Reflection Tracking(2,2) | ERFT,2,2 | |
| e10e32 | Transmission Tracking(2,1) | ETRT,2,1 | |
| e23e01 | Transmission Tracking(1,2) | ETRT,1,2 | |
| e30 | Cross Talk(1,2) | EXTLK,1,2 | |
| e03 | Cross Talk(2,1) | EXTLK,2,1 |
References
- 1.Stauffer PR. Evolving technology for thermal therapy of cancer. International Journal of Hyperthermia. 2005;21(8):731–744. doi: 10.1080/02656730500331868. [DOI] [PubMed] [Google Scholar]
- 2.Diederich CJ. Thermal ablation and high-temperature thermal therapy: overview of technology and clinical implementation. International journal of hyperthermia. 2005;21(8):745–753. doi: 10.1080/02656730500271692. [DOI] [PubMed] [Google Scholar]
- 3.Kennedy JE. High-intensity focused ultrasound in the treatment of solid tumours. Nature Rev. Cancer. 2005;5:321327. doi: 10.1038/nrc1591. [DOI] [PubMed] [Google Scholar]
- 4.Ni Y, Mulier S, Miao Y, Michel L, Marchal G. A review of the general aspects of radiofrequency ablation. Abdominal imaging. 2005;30(4):381–400. doi: 10.1007/s00261-004-0253-9. [DOI] [PubMed] [Google Scholar]
- 5.Nagata Y, Masahiro H, Nishimura Y, Masunaga S, Mitumori M, Okuno Y, Fujishiro M. Clinical results of radiofrequency hyperthermia for malignant liver tumors. International Journal of Radiation Oncology. 1997;38(2):359–365. doi: 10.1016/s0360-3016(96)00625-6. [DOI] [PubMed] [Google Scholar]
- 6.Hildebrandt B, Wust P, Ahlers O, Dieing A, Sreenivasa G, Kerner T, Felix R, Riess H. The cellular and molecular basis of hyperthermia. Critical Rev. Oncology/Hematology. 2002;43(1):3356. doi: 10.1016/s1040-8428(01)00179-2. [DOI] [PubMed] [Google Scholar]
- 7.Vernon CC, Hand JW, Field SB, Machin D, Whaley JB, van der Zee J, van Putten WLJ, van Rhoon GC, van Dijk JDP, Gonzalez DG, Liu F, Goodman P, Sherar M. Radiotherapy with or without hyperthermia in the treatment of superficial localized breast cancer: Results from five randomized controlled trials. Int. J. Radiat. Oncol. Biol. Phys. 1996;35:731744. doi: 10.1016/0360-3016(96)00154-x. [DOI] [PubMed] [Google Scholar]
- 8.Sneed PK, et al. Hyperthermia. In: Hoppe R, Phillips TL, Roach M III, editors. Textbook of Radiation Oncology: Expert Consult. 3rd ed. ch. 74. Elsevier Health Sciences; 2010. pp. 1564–1593. [Google Scholar]
- 9.Dewhirst M, Jones EL, Samulski T, Das S, Craciunescu O, Vujaskovic Z, Li C, Prosnitz L. Hyperthermia. In: Gunderson L, Tepper J, editors. Clinical Radiation Oncology. 3rd ed. Philadelphia: Elsevier - Saunders; 2012. pp. 385–403. [Google Scholar]
- 10.Habash R. Bioeffects and therapeutic applications of electromagnetic energy. Boca Raton, FL: CRC press; 2010. [Google Scholar]
- 11.Wickersheim KA, Sun MH. Fiberoptic thermometry and its applications. J. Microwave Power. 1987;22(2):85–94. [Google Scholar]
- 12.Katzir A, Bowman HF, Asfour Y, Zur A, Valeri CR. Infrared fibers for radiometer thermometry in hypothermia and hyperthermia treatment. IEEE Trans. Biomedical Engineering. 1989;36(6):634–637. doi: 10.1109/10.29459. [DOI] [PubMed] [Google Scholar]
- 13.Samulski TV, Fessenden P. Methods of hyperthermia control. Berlin: Springer; 1990. Thermometry in therapeutic hyperthermia; pp. 1–34. [Google Scholar]
- 14.Gellermann J, Hildebrandt B, Issels R, Ganter H, Wlodarczyk W, Budach V, Felix R, Tunn PU, Reichardt P, Wust P. Noninvasive magnetic resonance thermography of soft tissue sarcomas during regional hyperthermia. Cancer. 2006;107(6):1373–1382. doi: 10.1002/cncr.22114. [DOI] [PubMed] [Google Scholar]
- 15.Gellermann J, Wlodarczyk W, Ganter H, Nadobny J, Fahling H, Seebass M, Felix R, Wust P. A practical approach to thermography in a hyperthermia/magnetic resonance hybrid system: Validation in a heterogeneous phantom. International Journal of Radiation Oncology. 2005;61(1):267–277. doi: 10.1016/j.ijrobp.2004.05.009. [DOI] [PubMed] [Google Scholar]
- 16.Denis de Senneville D, Quesson B, Moonen CTW. Magnetic resonance temperature imaging. International Journal of Hyperthermia. 2005;21(6):515–531. doi: 10.1080/02656730500133785. [DOI] [PubMed] [Google Scholar]
- 17.Hynynen K, McDannold N. MRI guided and monitored focused ultrasound thermal ablation methods: a review of progress. International Journal of Hyperthermia. 2004;20(7):725–737. doi: 10.1080/02656730410001716597. [DOI] [PubMed] [Google Scholar]
- 18.Das SK, Jones EA, Samulski TV. A method of MRI-based thermal modelling for a RF phased array. International Journal of Hyperthermia. 2001;17(6):465–482. doi: 10.1080/02656730110068320. [DOI] [PubMed] [Google Scholar]
- 19.Arnal B, Pernot M, Tanter M. Monitoring of thermal therapy based on shear modulus changes: II. Shear wave imaging of thermal lesions. IEEE Trans. Ultrasonics, Ferroelectrics and Frequency Control. 2011;58(8):1603–1611. doi: 10.1109/TUFFC.2011.1987. [DOI] [PubMed] [Google Scholar]
- 20.Nasoni RL, Bowen T, Connor WG, Sholes RR. In vivo temperature dependence of ultrasound speed in tissue and its application to noninvasive temperature monitoring. Ultrasonic Imaging. 1979;1(1):34–43. doi: 10.1177/016173467900100103. [DOI] [PubMed] [Google Scholar]
- 21.Arthur RM, Straube WL, Trobaugh JW, Moros EG. Non-invasive estimation of hyperthermia temperatures with ultrasound. International Journal of Hyperthermia. 2005;21(6):589–600. doi: 10.1080/02656730500159103. [DOI] [PubMed] [Google Scholar]
- 22.Larina IV, Larin KV, Esenaliev RO. Real-time optoacoustic monitoring of temperature in tissues. Journal of Physics D. 2003;38(15):2633–2639. [Google Scholar]
- 23.Meaney PM, Fanning MW, Paulsen KD, Li D, Pendergrass SA, Fang Q, Moodie KL. Microwave thermal imaging: Initial in vivo experience with a single heating zone. International Journal of Hyperthermia. 2003;19(6):617–641. doi: 10.1080/0265673031000140822. [DOI] [PubMed] [Google Scholar]
- 24.Meaney PM, Zhou T, Fanning MW, Geimer SD, Paulsen KD. Microwave thermal imaging of scanned focused ultrasound heating: Phantom results. International Journal of Hyperthermia. 2008;24(7):523–536. doi: 10.1080/02656730801944922. [DOI] [PMC free article] [PubMed] [Google Scholar]
- 25.Cheng KS, Stakhursky V, Stauffer P, Dewhirst M, Das SK. Online feedback focusing algorithm for hyperthermia cancer treatment. International Journal of Hyperthermia. 2007;23(7):539–554. doi: 10.1080/02656730701678877. [DOI] [PMC free article] [PubMed] [Google Scholar]
- 26.Behnia B, Suthar M, Webb AG. Closedloop feedback control of phasedarray microwave heating using thermal measurements from magnetic resonance imaging. Concepts in Magnetic Resonance. 2002;15(1):101–110. [Google Scholar]
- 27.Stang J, Haynes M, Carson P, Moghaddam M. A preclinical system prototype for focused microwave thermal therapy of the breast. IEEE Trans. Biomedical Engineering. 2012;59(9):2431–2438. doi: 10.1109/TBME.2012.2199492. [DOI] [PMC free article] [PubMed] [Google Scholar]
- 28.Haynes M, Stang J, Moghaddam M. Microwave breast imaging system prototype with integrated numerical characterization. Journal of Biomedical Imaging. 2012;2012:18. doi: 10.1155/2012/706365. Article ID 706365. [DOI] [PMC free article] [PubMed] [Google Scholar]
- 29.Komarov V, Wang S, Tang J. Permittivity and measurements. Encyclopaedia of RF and Microwave Engineering. 2005;(308):1–20. [Google Scholar]
- 30.Komarov V, Tang J. Dielectric permittivity and loss factor of tap water at 915 MHz. Microwave and Optical Technology Letters. 2004 Sep;42(5):419–420. [Google Scholar]
- 31.Lazebnik M, Converse MC, Booske JH, Hagness SC. Ultrawideband temperature-dependent dielectric properties of animal liver tissue in the microwave frequency range. Phys. Med. Biol. 2006;51:194155. doi: 10.1088/0031-9155/51/7/022. [DOI] [PubMed] [Google Scholar]
- 32.Lazebnik M, McCartney L, Popovic D, Watkins CB, Lindstrom MJ, Harter J, Sewall S, Magliocco A, Booske JH, Okoniewski M, Hagness SC. A large-scale study of the ultrawideband microwave dielectric properties of normal breast tissue obtained from reduction surgeries. Physics in Medicine and Biology. 2007;52 doi: 10.1088/0031-9155/52/10/001. pp. pp. 26372656. [DOI] [PubMed] [Google Scholar]
- 33.Bolomey JC, Jofre L, Peronnet G. On the possible use of microwave-active imaging for remote thermal sensing. IEEE Trans. on Microwave Theory and Techniques. 1983 Sep;31(9):777–781. [Google Scholar]
- 34.Al-Joumayly MA, Aguilar SM, Behdad N, Hagness SC. Dual-band miniaturized patch antennas for microwave breast imaging. IEEE Antennas and Wireless Propagation Letters. 2012;9:268–271. doi: 10.1109/LAWP.2010.2045871. [DOI] [PMC free article] [PubMed] [Google Scholar]
- 35.Meaney PM, Fanning MW, Dun L, Poplack SP, Paulsen KD. A clinical prototype for active microwave imaging of the breast. IEEE Trans. Microwave Theory and Techniques. 2000 Nov;48(11):1841–1853. [Google Scholar]
- 36.Stang J. Ph.D. dissertation. Durham NC: Dept. Elect. and Comp. Eng., Duke Univ; 2008. A 3D active microwave imaging system for breast cancer screening. [Google Scholar]
- 37.Stang J, Joines WT. Tapered microstrip patch antenna array for microwave breast imaging. Microwave Symposium Digest, 2008 IEEE MTT-S International. 2008 Jun [Google Scholar]
- 38.Ferrero A, Pisani U. Two-port network analyzer calibration using an unknown ”thru”. IEEE Microwave and Guided Wave Letters. 1992 Dec;2(12):505–507. [Google Scholar]
- 39.Rehnmark S. On the calibration process of automatic network analyzer systems. IEEE Trans. on Microwave Theory and Techniques. 1974 Apr;:457–458. [Google Scholar]
- 40.Haynes M, Moghaddam M. Vector Green’s Function for S-parameter Measurements of the Electromagnetic Volume Integral Equation. IEEE Trans. Antennas Propagation. 2012 Mar;60(3):1400–1413. [Google Scholar]
- 41.Chew WC. Waves and Fields in Inhomogeneous Media. New York: IEEE; 1995. [Google Scholar]
- 42.Chew WC, Wang YM. Reconstruction of two-dimensional permittivity distribution using the distorted Born iterative method. IEEE. Trans. Medical Imaging. 1990;9(2):218–225. doi: 10.1109/42.56334. [DOI] [PubMed] [Google Scholar]
- 43.Zastrow E, Davis SK, Lazebnik M, Kelcz F, Van Veen BD, Hagness SC. Development of anatomically realistic numerical breast phantoms with accurate dielectric properties for modeling microwave interactions with the human breast. IEEE Trans. Biomedical Engineering. 2008;55(12):2792–2800. doi: 10.1109/TBME.2008.2002130. [DOI] [PMC free article] [PubMed] [Google Scholar]
- 44.Tarantola A. Inverse Problem Theory. Philadelphia: SIAM; 2005. [Google Scholar]
- 45.Selesnick IW, Bayram I. Total Variation Filtering. White paper. 2010 [Google Scholar]
- 46.Rytting D. Network analyzer error models and calibration methods. White paper. 1998 Sep [Google Scholar]


