

Abstract
Based on quantitative cluster analyses of 52 constitutively expressed or behaviorally regulated genes in 23 brain regions, we present a global view of telencephalic organization of birds. The patterns of constitutively expressed genes revealed a partial mirror image organization of three major cell populations that wrap above, around, and below the ventricle and adjacent lamina through the mesopallium. The patterns of behaviorally regulated genes revealed functional columns of activation across boundaries of these cell populations, reminiscent of columns through layers of the mammalian cortex. The avian functionally regulated columns were of two types: those above the ventricle and associated mesopallial lamina, formed by our revised dorsal mesopallium, hyperpallium, and intercalated hyperpallium; and those below the ventricle, formed by our revised ventral mesopallium, nidopallium, and intercalated nidopallium. Based on these findings and known connectivity, we propose that the avian pallium has four major cell populations similar to those in mammalian cortex and some parts of the amygdala: 1) a primary sensory input population (intercalated pallium); 2) a secondary intrapallial population (nidopallium/hyperpallium); 3) a tertiary intrapallial population (mesopallium); and 4) a quaternary output population (the arcopallium). Each population contributes portions to columns that control different sensory or motor systems. We suggest that this organization of cell groups forms by expansion of contiguous developmental cell domains that wrap around the lateral ventricle and its extension through the middle of the mesopallium. We believe that the position of the lateral ventricle and its associated mesopallium lamina has resulted in a conceptual barrier to recognizing related cell groups across its border, thereby confounding our understanding of homologies with mammals.
INDEXING TERMS: forebrain, brain pathways, brain organization, neural activity, motor behavior, primary sensory, brain evolution, neurotransmitter receptors, immediate early genes, pallium, cortex, striatum, pallidum, basal ganglia, amygdala, claustrum
Early comparative neurobiologists who developed the classic view of vertebrate brain evolution argued that the subdivisions of the telencephalon evolved in a stepwise progressive fashion from simpler forms in fish, containing almost exclusively basal ganglia structures, to more advanced forms in mammals, containing a great amount of pallial “neocortex” structures (Edinger, 1885, 1908). In this view, nearly all of the avian telencephalon was considered basal ganglia, with very few cortical regions (Fig. 1A). This classical view was recently challenged by a consortium of current neurobiologists, where they proposed a major revision to the avian telencephalon terminology that matched a new consensus view of comparative vertebrate brain organization (Reiner et al., 2004b; Jarvis et al., 2005). In this modern view, they proposed that all telencephalic subdivisions in vertebrates can be classified into three major domains: pallial, striatal, and pallidal, with the pallial domain making up most of the avian telencephalon (~75%) (Fig. 1B). The avian striatal and pallidal domains were proposed to be well-conserved with their counterparts in the basal ganglia of mammals and other vertebrates in developmental origin, cell types, and cellular organization. The avian pallial domain was proposed to be conserved with mammals in developmental origin and some cell types, but quite divergent in cellular organization; most of the mammalian pallium (i.e., cortex) consists of 3–6 layers of cells, whereas most of the avian pallium, similar to the basal ganglia, consists of nuclear subdivisions. As such, the names and boundaries of the avian pallial subdivisions were revised from having striatum in their name to having pallium in their name, namely, to the arcopallium, nidopallium, mesopallium, and hyperpallium to maintain continuity of terminology with the older nomenclature and to acknowledge a global homology of the pallium with mammals, but not yet a one-to-one homology of specific cell types, if any (Fig. 1B). The arcopallium is the main output of the avian telencephalon; the nidopallium is said to contain primary sensory neuron groups, including Field L2 (an auditory region), entopallium [E] (a visual region), and basorostralis [B] (a somatosensory region), that receive input from the thalamus and higher order neurons that make intracerebral connections; the mesopallium also makes intracerebral connections; and the hyperpallium is said to also contain a primary sensory neuron subdivision (intercalated hyperpallium [IH] containing visual and somatosensory parts), and a higher-order hyperpallium apicale that makes intracerebral connections, and like the arcopallium sends projections out of the telencephalon (Reiner et al., 2004b; Jarvis et al., 2005). This revision and its general principles have now been adopted by the neuroscience community.
Figure 1.
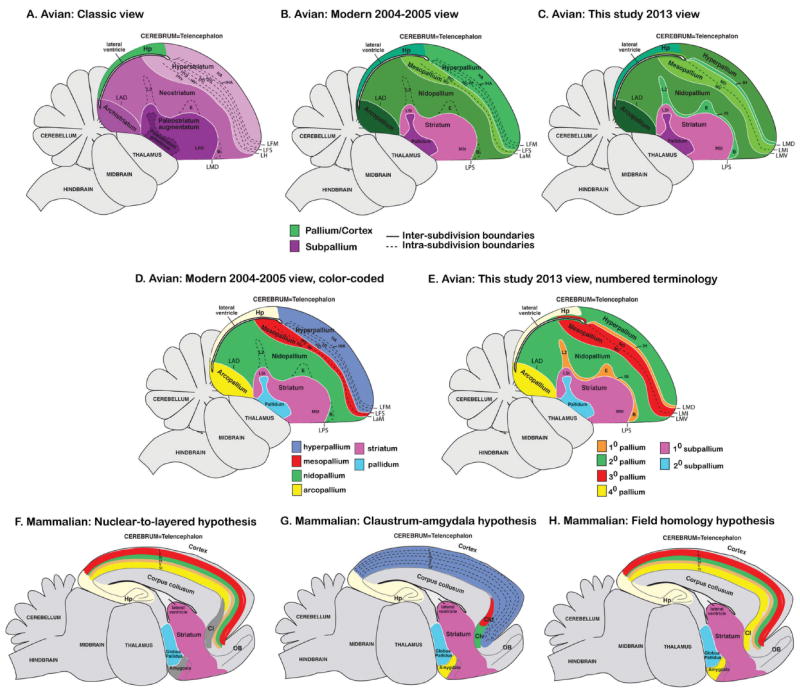
Classical and modern views of avian cerebral organization. Shown are sagittal views of a songbird (zebra finch) brain with subdivisions colored-coded according to the meaning of the names given to those brain regions in different nomenclature schemas over time. A: Classic view of avian brain relationships according to popular terminology given to those regions (Edinger, 1885, 1908; Ariëns Kappers et al., 1936), although past authors had different opinions about which brain regions are pallium versus subpallium. B: Modern 2004–2005 consensus view of avian brain relationships according to the conclusions of the Avian Brain Nomenclature Forum (Reiner et al., 2004b; Jarvis et al., 2005). C: Revised modern view according to this study. D: Higher contrast color-coded scheme for the modern 2004–2005 view to highlight contrast of pallial regions with each other. E: Higher contrast color-coded scheme for the view presented in this study to highlight the alternative new numbered terminology based on shared gene expression profiles and connectivity. F: Color-coded scheme of the rodent brain according to the nuclear-to-layered hypothesis of homology with the avian brain (D). G: Color-coded scheme of the rodent brain according to the claustrum-amygdala hypothesis of homology with the avian brain (D). H: Color-coded scheme of the rodent brain according to the field hypothesis of homology with the avian brain proposed in this study (E). For all images, solid white lines are lamina (relatively cell sparse zones) that separates subdivisions; dashed lines divide regions within a subdivision, whether a lamina is present or not. Comparison of spelled out names with abbreviations for each of the views is shown in Table 2 and Fig. 3B.
Although the revised terminology and associated views were a significant improvement over the classical view and were necessary, we knew that there were still imperfections and room for improvement when more evidence would be obtained. For example, there were still conflicting hypotheses on specific homologies of different cell types or cell populations between the avian and mammalian pallium (Reiner et al., 2004b; Jarvis et al., 2005). The nuclear-to-layered hypothesis posited that the different nuclear subdivisions of the avian telencephalon below the lateral ventricle, called the dorsal ventricular ridge (DVR), contain cell types that are homologous to different layers I–VI of the mammalian cortex (Fig. 1D vs. 1F) (Karten, 1991; Jarvis et al., 2005). The nuclear-to-claustrum/amygdala hypothesis posited that the DVR sub-divisions are instead homologous to the mammalian amygdala and claustrum (Fig. 1D vs. 1G) (Puelles et al., 1999; Jarvis et al., 2005). Both hypotheses claimed that the pallial regions above the lateral ventricle are homologous to parts of the mammalian cortex (Medina and Reiner, 2000; Jarvis et al., 2005). A third, but less acknowledged, hypothesis is that the different subdivisions of the anterior DVR as a field are homologous to both cortical and claustrum/amygdala cell types (Butler and Molnar, 2002; Molnar and Butler, 2002). To address these hypotheses, a number of elegant comparative and manipulation experiments have since been performed, but still with continued conflicting conclusions (Yamamoto et al., 2005; Medina and Abellan, 2009; Nomura et al., 2009; Uchida et al., 2010; Wang et al., 2010; Aboitiz, 2011; Butler et al., 2011; Kuenzel et al., 2011; Medina et al., 2011; Puelles, 2011; Tanaka et al., 2011; Atoji and Karim 2012; Dugas-Ford et al., 2012; Suzuki et al., 2012).
Resolving these hypotheses, we believe, is in part hampered by yet another set of unanswered questions on our still limited understanding of overall avian brain organization. To address this issue, here we quantitatively analyzed telencephalic expression profiles of 46 constitutive and 6 activity-responsive genes (52 total; Table 1) to decipher the molecular and functional relationships between different avian telencephalic cell populations. Our approach was based on the hypothesis that similar brain areas should express similar gene sets. We included genes that have a wide range of functions and cellular locations, from inside the nucleus to the extracellular space, including 21 glutamate neurotransmitter receptors (Wada et al., 2004), five dopamine neuromodulatory receptors (Kubikova et al., 2010), the SEMA6A axon guidance receptor (Lovell et al., 2008), cannabinoid receptor (Soderstrom et al., 2004), and retinoic acid orphan related receptor beta (ROR-β; this study); the NRN, BDNF, and SCUBE1 protein ligands (Wada et al., 2006; Lovell et al., 2008); the DLX6 (this study), FOXP1, FOXP2, ER81, COUP-TF2, LHX8, LHX9, NKX2.1, PAX6, EGR1, C-FOS, and C-JUN transcriptions factors (Jarvis and Nottebohm, 1997; Kimpo and Doupe, 1997; Haesler et al., 2004; Jarvis et al., 2005; Yamamoto et al., 2005; Abellan et al., 2009); the FKBP1A (this study), DUSP1 (a.k.a. map kinase phosphatase 1 [mkp1]), and PPAPDC1A enzymes (Lovell et al., 2008; Horita et al., 2010, 2012); and a diverse set of membrane and cytoplasmic genes, including ARPP16 (this study), TMEM100 (this study), ARC, CADPS2, and S100B (Wada et al., 2006; Lovell et al., 2008) (Table 1). Among these genes, BDNF, EGR1, C-FOS, C-JUN, DUSP1, and ARC are activity regulated in the brain by sensory and motor behaviors (Mello et al., 1992; Jarvis and Nottebohm, 1997; Kimpo and Doupe, 1997; Wada et al., 2006; Horita et al., 2010). To quantitatively infer unbiased relationships between cell populations, we performed computational cluster-dendrogram analyses that we called “phylo-gene expression trees”. For additional evidence, we analyzed Nissl and myelin stains, 3D brain reconstructions, three planes of sectioning, behaviorally activated gene expression patterns, and known connectivity. Based on the totality of the findings, we propose that the avian pallium is organized into four major cell populations that are molecularly distinguishable, have counterparts below and above the lateral ventricle and an associated lamina through the mesopallium, which in turn contribute to functionally adjacent columns for different sensory and motor systems. This view has novel implications on the competing hypotheses of pallial homologies with mammals.
TABLE 1.
Genes Examined in This Study in the Avian Telencephalon
| Receptors
|
||||||
|---|---|---|---|---|---|---|
| Gene | Gene name | Original study | Accession # | Anti/Sense | ||
| 1 | AMPA | GRIA1 | Glutamate receptor ionotropic AMPA type 1 | Wada et al 2004 | AB042749 | Sp6/T7 |
| 2 | GRIA2 | Glutamate receptor ionotropic AMPA type 2 | Wada et al 2004 | AB042750 | Sp6/T7 | |
| 3 | GRIA3 | Glutamate receptor ionotropic AMPA type 3 | Wada et al 2004 | AB042751 | Sp6/T7 | |
| 4 | GRIA4 | Glutamate receptor ionotropic AMPA type 4 | Wada et al 2004 | AB042752 | Sp6/T7 | |
| 5 | Kainate | GRIK1 | Glutamate receptor ionotropic kainate type 1 | Wada et al 2004 | AB107127 | T7/Sp6 |
| 6 | GRIK2 | Glutamate receptor ionotropic kainate type 2 | Wada et al 2004 | AB107128 | Sp6/T7 | |
| 7 | GRIK3 | Glutamate receptor ionotropic kainate type 3 | Wada et al 2004 | AB107129 | T7/Sp6 | |
| 8 | GRIK4 | Glutamate receptor ionotropic kainate type 4 | Wada et al 2004 | AB107131 | Sp6/T7 | |
| 9 | GRIK5 | Glutamate receptor ionotropic kainate type 5 | Wada et al 2004 | AB107131 | T7/Sp6 | |
| 10 | NMDA | GRIN1 | Glutamate receptor ionotropic NMDA type 1 | Wada et al 2004 | AB042756 | Sp6/T7 |
| 11 | GRIN2A | Glutamate receptor ionotropic NMDA type 2A | Wada et al 2004 | AB042757 | Sp6/T7 | |
| 12 | GRIN2B | Glutamate receptor ionotropic NMDA type 2B | Wada et al 2004 | AB107125 | Sp6/T7 | |
| 13 | GRIN2C | Glutamate receptor ionotropic NMDA type 2C | Wada et al 2004 | AB042758 | Sp6/T7 | |
| 14 | GRIN2D | Glutamate receptor ionotropic NMDA type 2D | Wada et al 2004 | AB042759 | Sp6/T7 | |
| 15 | GRIN3A | Glutamate receptor ionotropic NMDA type 3A | Wada et al 2004 | AB107126 | Sp6/T7 | |
| 166 | Metabotropic | GRM1 | Glutamate receptor metabotropic type 1 | Wada et al 2004 | AB042753 | Sp6/T7 |
| 17 | GRM2 | Glutamate receptor metabotropic type 2 | Wada et al 2004 | AB042754 | Sp6/T7 | |
| 18 | GRM3 | Glutamate receptor metabotropic type 3 | Wada et al 2004 | AB107132 | Sp6/T7 | |
| 19 | GRM4 | Glutamate receptor metabotropic type 4 | Wada et al 2004 | AB042759 | T7/Sp6 | |
| 20 | GRM5 | Glutamate receptor metabotropic type 5 | Wada et al 2004 | AB107133 | Sp6/T7 | |
| 21 | GRM8 | Glutamate receptor metabotropic type 8 | Wada et al 2004 | AB107134 | Sp6/T7 | |
| 22 | D1 | D1A | Dopamine receptor 1A | Kubikova et al 2010 | AB372107 | Sp6/T7 |
| 23 | D1B | Dopamine receptor 1B | Kubikova et al 2010 | AB372108 | T7/Sp6 | |
| 24 | D1C | Dopamine receptor 1C | Kubikova et al 2010 | AB372109 | T7/Sp6 | |
| 25 | D2 | D2 | Dopamine receptor 2 | Kubikova et al 2010 | AB372110 | Sp6/T7 |
| 26 | D3 | Dopamine receptor 3 | Kubikova et al 2010 | AB372111 | Sp6/T7 | |
| 27 | other | SEMA6A | Semaphorin-6A | Mello & Lovell 2008 | CK308635 | T3/T7 |
| 28 | CB1 | Cannabinoid receptor type 1 | Soderstorm et al 2004 | Anti-CB1 finch | NA | |
| 29 | ROR-b | RAR-related orphan receptor beta | This study | XM002190956 | SP6/T7 | |
| Protein ligands | ||||||
| 30 | BDNF | Brain derived growth factor | Wada et al 2006 | DQ213413 | Sp6/T7 | |
| 31 | NRN | Neuritin | This study | AB543000 | T3/T7 | |
| 32 | SCUBE1 | Signal peptide, CUB domain, EGF-like 1 | Mello & Lovell 2008 | DV947442 | T3/T7 | |
| Transcription factors | ||||||
| 33 | DLX6 | Distal-less homeobox 6 | This study | 0063P0006H11 | T3/T7 | |
| 34 | FOXP1 | Forkhead box P1 | Haesler et al 2004 | AY549152.1 | T7/Sp6 | |
| 35 | FOXP2 | Forkhead box P2 | Haesler et al 2004 | AY549150 | Sp6/T7 | |
| 36 | ER81 | Ets-related protein 81 | This study | DV582565 | T3/T7 | |
| 37 | COUP-TF2 | Chicken ovalbumin upstream promoter-TF2 | Yamamoto et al 2005 & this study | AB542998 | T7/Sp6 | |
| 38 | LHX8 | LIM homeobox 8, zinc finger | This study | EH122589 | T3/T7 | |
| 39 | LHX9 | LIM homeobox 9, zinc finger | This study | AB542999 | SP6/T7 | |
| 40 | NKX2.1 | NK2 homeobox 1 | This study | HM633194 | T7/SP6 | |
| 41 | PAX6 | Paired box gene 6 | This study | DV580106 | T3/T7 | |
| 42 | EGR1 | Early growth response gene 1 | Wada et al 2006; Feenders et al 2008 | JX296528 | T7/Sp6 | |
| 43 | C-FOS | Cellular – FBJ osteosarcoma oncogene | Wada et al 2006; Feenders et al 2008 | DV571132 | T7/Sp6 | |
| 44 | C-JUN | Cellular – jun oncogene | Wada et al 2006 | DV573183 | Sp6/T7 | |
| Enzymes | ||||||
| 45 | DUSP1 | Dual specificity phosphatase 1 | Horita et al 2010, 2012 | AB476742 | SP6/T7 | |
| 46 | FKBP1A | FK506 binding protein 1A; isomerase | This study | 0058P0025C02 | T3/T7 | |
| 47 | PPAPDC1A | Phosphatidic acid phosphatase 2 domaincontaining 1A | Mello & Lovell 2008 | CK305549 | T3/T7 | |
| Other genes | ||||||
| 48 | ARC | Activity-regulated cytoskeleton protein | Wada et al 2006 | 0065P0027D05 | T3/T7 | |
| 49 | CADPS2 | Calcium-dependent secretion activator 2 | Mello & Lovell 2008 | DV955943 | T3/T7 | |
| 50 | ARPP16 | cAMP regulated phosphoprotein 16000 | This study | 0058P0003A02 | T3/T7 | |
| 51 | S100B | S100 calcium binding protein B | Mello & Lovell 2008, This study | DV950377 | T3/T7 | |
| 52 | TMEM100 | Trans membrane protein 100 | This study | 0064P0009H05 | T3/T7 | |
| 53 | MOAB | Monoamine oxidase B | This study | Sp6/T7 | ||
| 54 | SP | Substance P | Shimizu & Karten 1990 | Anti-SP rat | NA | |
Listed are the gene family when more than one gene of a family was analyzed, the gene symbol abbreviation, the molecular function/annotated gene name, the original source of the adult brain gene expression pattern if not this study, the NCBI accession no. or clone ID of the cDNA used for in situ hybridization, and the RNA polymerase enzymes used to make the antisense and sense riboprobes. The two genes at the bottom of the list (MOAB and SP) were added for validation at the end of the study. More information on individual nucleotide sequences, insert sizes, and portion of the gene represented in the cDNA clones can be found with a search of the ID# in the NCBI nucleotide (http://www.ncbi.nlm.nih.gov/nucleotide) or songbird transcriptome (http://songbirdtranscriptome.net) databases. Vector clones used were the pFLC1, pBS SK1, or pGEM T-easy vectors, as described in the database files for each clone. Gene nomenclature follows current standards, including revised nomenclature for glutamate receptors.
MATERIALS AND METHODS
Species, stimulus, and behavioral paradigms
We analyzed brain gene expression profiles in eight avian species to validate our findings across this vertebrate class. The species include: Songbirds: zebra finches (Taeniopygia guttata), song sparrows (Melospiza melodia), garden warblers (Sylvia borin); Doves: ring doves (Streptophilia risoria) and pigeons (Columbia livia); Hummingbirds: Anna’s hummingbird (Calypte anna), sombre hummingbird (Aphantochroa cirrochloris), and rufous-breasted hermit (Glaucis hirsuta); a Parrot: budgerigars (Melopsittacus undulatus); and a Galliform: Japanese quail (Coturnix cortunix japonica) (n = 3–4 individuals per species). All animals were laboratory raised except the hummingbirds, which were captured from wild populations in Santa Theresa, Espirito Santo, Brazil (sombre hummingbird and rufous-breasted hermit) and in Riverside, California (Anna’s hummingbird) (Jarvis et al., 2000; Feenders et al., 2008), and the garden warblers which were caught on Helgoland and around Oldenburg, Germany (Mouritsen et al., 2005). These wild-caught birds and some of the brain sections from the other species are from animals collected in our prior studies (Jarvis et al., 1997; Wada et al., 2004; Mouritsen et al., 2005; Feenders et al., 2008; Horita et al., 2010, 2012; Kubikova et al., 2010). However, unlike those studies, we analyzed the data in this study for quantitative, comparative brain gene expression profiles. In those studies, where relevant, a citation was mentioned to the current study as unpublished findings in preparation.
Because sensory stimuli or behavioral performance are associated with changes in expression of activity-dependent genes in the associated brain circuits, to assess basal expression patterns we measured gene expression in the brains of animals that were in silent control conditions, either with lights off or on after an overnight period of silence. To examine stimulus and behaviorally regulated patterns of the activity-dependent genes (BDNF, EGR1, C-FOS, C-JUN, ARC, and DUSP1), we used brain sections from animals that had undergone controlled behavioral experiments in our prior studies. These include birds that heard song playbacks while in the dark and sat still (determined with infrared video cameras) to activate auditory pathways (Feenders et al., 2008; Horita et al., 2010); stimulated with daylight after an overnight period in the dark to activate visual pathways (Feenders et al., 2008); stimulated with dim light and changing magnetic fields for migratory garden warblers to activate magnetic sensing pathways (Mouritsen et al., 2005); deaf or hearing intact, in light- or dark-housed animals hopping in a rotating wheel to activate motor pathways (Feenders et al., 2008); or singing alone after lights on to activate vocal pathways (Wada et al., 2006; Feenders et al., 2008; Horita et al., 2012). All animal procedures in these and the current study were approved by the Duke Animal Care and Use Committee.
cDNA clones and in situ hybridization
For in situ hybridization analyses, besides having a broad functional representation, we selected genes that met at least two of three additional criteria: 1) Those that represent nearly entire gene families, namely, the glutamate (AMPA, kainate, NMDA, metabotropic) and dopamine (D1 and D2) receptors, which in turn represent an unbiased selection of half of the genes (Table 1); 2) Those that show differential expression across known brain subdivision/cell population boundaries; and 3) The six activity-regulated genes mentioned above to identify functionally associated brain regions.
In situ hybridizations were conducted as previously described (Wada et al., 2004; Chen et al., 2012). In brief, brains were embedded in OCT compound (Sakura Fine Technical, Tokyo, Japan), frozen on dry ice, and stored at −80°C. Frozen sections were cut at 12 μm in the sagittal, coronal, or horizontal planes for the zebra finch or sagittal and coronal planes for all other species. Sections were fixed in 3% paraformaldehyde and hybridized with anti-sense 35S-UTP labeled riboprobes from zebra finch cDNAs cloned for this study or cloned in prior brain transcriptome studies (Table 1) (Wada et al., 2006; Li et al., 2007; Replogle et al., 2008). The first use of an antisense riboprobe hybridization experiment also included a sense probe to test for probe specificity; in all cases the sense probe was not observed to give signals above background. Hybridization temperature and washes were conducted at 65°C for zebra finch cDNA generated riboprobes on brain sections of songbird species, and at 60°C for the zebra finch riboprobes on all nonsongbird species due to a need for cross-species hybridization. The specific temperature was determined by trial and error to obtain a maximum difference between background and signal. The hybridized sections were exposed to x-ray film (Biomax MR, Kodak, Rochester, NY) for 1–4 days, then dipped in autoradiographic emulsion (NTB2, Kodak), incubated for 1–3 weeks, processed with D-19 developer (Kodak) and fixer (Kodak), Nissl-stained with 2–3% cresyl-violet acetate solution (Sigma, St. Louis, MO), and coverslipped with Permount (Fisher Scientific, Pittsburgh, PA). For the SEME6A and SCUBE1 genes we also used images from the zebra finch brain gene expression database by Mello, Lovell, and colleagues (version 1; http://www.zebrafinchatlas.org/). The cannabinoid receptor (CB1) was the only gene for which we used an immunocytochemistry label (Soderstrom et al., 2004) for quantification due to its prominent pattern in primary sensory neural populations.
Brain phylo-gene expression trees
We measured gene expression levels from the brain section images following a described procedure (Wada et al., 2004). In brief, images from x-ray film or emulsion-dipped slides of the in situ hybridizations were digitized using a macrozoom microscope (Olympus MVX10 MacrZoom microscope and Olympus DP Controller 3.2.1.276 software). Images were transferred to Photoshop (Adobe, San Jose, CA) and converted to grayscale to reduce intensity differences created by differences in cresyl violet staining between experiments and to have a comparable grayscale range among images. The levels function was used to expand the image information in the full 250-pixel range. All images of sections hybridized to the same gene from the same in situ hybridization experiment were treated the same. Regions of interest were outlined (~1–2 mm2 in size) with the highlighting tool and the average pixel density calculated using the histogram function. Care was taken to measure the same brain locations for each gene. The average adjacent background level on the glass slide without tissue was subtracted, and then the resultant values were averaged across at least two different brain sections. We then created three datasets: 1) leaving the data as continuous raw values; 2) normalizing the values to a scalar range from 0–1 to reduce technical variability between genes due to differences in exposure time and experiment; and 3) discretizing the data into three levels to reduce the effect of small differences among brain regions. For normalization, we used the “normalize4” function in R, which takes a matrix of values and generates output with the maximum value of a row to 1 and the minimum to 0. For discretization, each gene with the expression range (min, max) was given the value = 0 if the original value was in the range of [min, min*2/3+max/3], a value = 1 if the original value was in the range of [min*2/ 3+max/3, min/3+max*2/3], or a value = 2 if the original value was in the range of [min/3+max*2/3, max].
The expression values (raw or normalized) for each brain region were converted into a vector x⃗i and similarity scores between all pairs of vectors (i.e., pairs of brain regions) was calculated using either Distance-Correlation or Euclidean-Distance (Elmore and Richman, 2001) with either our own code (C++) or similar functions in R. The Distance-Correlation or Euclidean-Distance similarity values between all pairs of brain regions was used to generate a hierarchical cluster tree. Each brain region was a starting point, represented by the vector containing 50 gene expression values. The most similar pairs of brain regions (points) were grouped together to form a new point, represented by the average of the expression values of the grouped brain regions. This was then repeated, consecutively grouping the most similar pair of points at each step until there was only one point left. By recording the process of grouping brain regions, a hierarchical graphical tree was formed. To calculate bootstrap probability (BP) and approximately unbiased (AU) probability values of the brain relationships, we used the R program called Pvclust (statistical computing and graphics http://www.r-project.org/) (Suzuki and Shimodaira, 2006), with Distance-Correlation and ran it for 1,000 iterations. BP values of 70–100 were considered to reveal highly closely related brain regions, and AU values of 95 represent a P < 0.05 significance. However, both BP and AU values can also be interpreted as continuous values for the strength of the relationship above and below these standard cutoffs, and for brain regions that have hybrid cell type population relationships.
To determine more refined relationships, we used the Biedl et al. (2001) method to optimize the ordering of the leaves (brain regions) in our final tree (http://erikdemaine.org/papers/GeneExpression_UWTR2001/). Biedl et al.’s approach is a fast optimal leaf-ordering algorithm for hierarchical clustering, in which gene vectors are placed in a linear order such that those with similar expression profiles are closer to each other in the tree. This method minimizes the sum of the distances between expression profiles of adjacent brain regions in the ordering. In our main summary tree, the closest related brain regions were grouped together at the top and the most distantly related at the bottom of the page. We call these cluster-dendrogram analyses “brain phylo-gene expression trees” because they infer relationships of cell populations between brain regions based on their expression profiles.
Nissl staining and cell density measurements
To generate high-quality Nissl stained images for cell density measurements, we perfused male and female zebra finches with phosphate-buffered saline (PBS, pH 7.0) and then 4% paraformaldehyde. The brains were then frozen in a tissue block mold with Tissue-Tek OCT compound (Sakura) in a dry ice ethanol bath, and 40-μm sections cut on a cryostat either in the sagittal (n = 3 each sex), coronal (n = 3 each sex), or horizontal (n = 1 each sex) plane. Sections were mounted onto Superfrost+ charged (VWR) or gelatin-coated slides, and then stored at −80°C until further use. Representative sections were removed from the −80°C and placed in 3% PBS buffered paraformaldehyde for 1 minute to adhere to the slides, rinsed twice in PBS, dehydrated for 2 minutes each in 70%, 95%, 95%, 100%, and 100% ethanols, and delipidized twice in xylene for 5 minutes each. The sections were rehydrated by going through the ethanols in the opposite direction, then rinsed in tap water, stained in 3% cresyl violet in tap water for 2–5 minutes, rinsed in tap water, and dehydrated again in a separate series of ethanols. They were placed twice in xylene and coverslipped from the xylene solution with Permount mounting medium (Fisher).
To count cells and cell clusters, Nissl-stained brain regions were examined at 100× magnification on an Olympus BX61 microscope, projected onto a computer screen using a RETIGA-SRV Fast1394 digital camera and SlideBook v5 software (Olympus). All cells within the screen view in all planes of focus were counted (n > 300 cells/region/animal; n = 2 animals, one male and one female). We also counted the number of cells per cluster of cells (including single isolated cells), with the criteria that to be included in a cluster the Nissl-defined cresyl violet stained boundaries of the cell must contact each other. We had two independent observers perform counts on one of the animals to determine the criteria to obtain reliable counts. We did not perform stereology, as our purpose was not to generate an absolute value of the density of cells or cell clusters within each brain region, but to determine relative differences across brain regions using the same criteria across all brain regions. To determine statistical differences, we applied an analysis of variance (ANOVA) to the cell density measurements and a Kolmogorov–Smirnov Test (one-way test of predictions) to the cell cluster measurements using available online calculators (Holliday, 2012). Differences were considered significant at P < 0.05.
Myelin stain and autoluminescence of fiber tracts
We used images of the myelin fiber stain generated by Karten et al. (2008, 2013 [in press]), made publicly available as a zebra finch brain atlas databases (http://www.zebrafinch.org/atlas/; http://zebrafinch.brainarchitecture.org/images/). In addition, we also analyzed fibers using darkfield autoillumination, by perfusing animals as described above for Nissl staining, cutting 40-μm sections on a cryostat, free-floating the sections in deionized water, mounting them on Super-frost+ glass slides (Fisher), and coverslipping with deionized water. We then took pictures of the mounted sections in darkfield under the Olympus MVX10 macro-zoom microscope. In these conditions, axons reflect light and appear white, whereas populations of cell bodies appear gray. The water coverslipping is short-lived, lasting several days. Thus, pictures need to be taken immediately after coverslipping.
3D reconstructions
To generate 3D reconstructions of the brain, we obtained the complete high-resolution triple Nissl, Giemsa, and tyrosine hydroxylase-stained serial images from Harvey Karten (Karten et al., 2008, 2013 [in press]), also part of the zebra finch atlas database. We then used Aperio to analyze the sections and the manual and auto-contour functions of Neurolucida to draw the brain and telencephalic subdivision boundaries for every sagittal section in the series and every other coronal section. We then compiled the tracings of each slide, used the serial section manager to stack the tracings together, a smoothing function to smooth the surface of the stacks, and then created movies of 3D rotating images. Several rotation schemes were made with different brain regions color-coded, and presented as either snapshots in the main text figures or as online Supporting movies in .MOV format.
Figure preparation
To generate figures for publication, the digitized microscope images were adjusted in Adobe Photoshop. The “Levels” function was used to expand the image information within the 250-pixel range. When necessary, images for figures were color adjusted using the “Color Balance” function, particularly to remove red darkfield reflectance from the Nissl stain overshadowing the white silver grain mRNA signal. Some images differed in Nissl stain color, due to differences in the batch of cresyl violet used for staining. The background outside of the tissue was cut out in order to help visualize the brain boundaries. All images of the same experiment were adjusted in the same way to avoid creating artificial differences within a serial sectioned set of images of the same gene.
Detailed histological data from this article are available as virtual slides or whole-slide images using Biolucida Cloud image streaming technology from MBF Bioscience. The collection can be accessed at http://Wiley.Biolucida.net/JCN521-16Jarvis_Chen.
RESULTS
We separated the presentation of the results into into six major sections, depending on the type of evidence used to test hypotheses: I) Cell population gene expression relationships; II) Cell densities; III) Lamina; IV) Cell populations continuities; V) Other species; and VI) Columns.
Section I: Cell population gene expression relationships
Six major cerebral expression domains
We quantified the basal expression levels of 50 genes (Table 1) in 20 telencephalic regions and 3 cerebellum layers as outgroups (asterisk in Fig. 2); we did not include EGR1 and C-FOS genes due to barely detectable basal expression in quiet control animals. We chose the zebra finch as our focal species because of its wide use in neuroscience (Zeigler and Marler, 2004). We chose the specific genes based on their distinct expression patterns in the telencephalon, their diverse molecular functions (glutamate receptors, FOXP2), and their use to distinguish cell types in the mammalian brain, including dopamine receptors in striatal neurons, ROR-β in layer IV cortex neurons, ER81 in layer V cortex and amygdala neurons, and LHX9 in amygdala neurons (Molnar and Cheung, 2006; Watakabe et al., 2007; Garcia-Lopez et al., 2008). We chose the specific brain regions to test the relationships proposed in the 2004–2005 brain nomenclature (Reiner et al., 2004a; Jarvis et al., 2005) and to resolve alternative views on which brain regions constitute the newly defined hyperpallium, mesopallium, and arcopallium (Yamamoto and Reiner, 2005; Feenders et al., 2008; Puelles et al., 2008). For most subdivisions we quantified two distantly located regions as positive controls (Fig. 2). The basal expression patterns of all 50 genes in at least 3–4 serial sagittal sections (and some also in the coronal and horizontal planes) are shown in a Supporting Database Folder 1 (Supporting F1; Biolucida URL). Camera lucida drawings of a representative sagittal and coronal series are shown in Figure 2.
Figure 2.

Camera lucida drawings of the major subdivisions of the avian brain based on the zebra finch. Drawings are based on FoxP1 images in Supporting folder F1, with additional information from all other genes, Nissl, and fiber staining. A–E: Medial to lateral sagittal series. F–O: Anterior to posterior coronal series. Solid lines divide brain subdivisions with both distinct lamina and gene expression profiles. Dashed line is the LMI lamina between the dorsal (MD) and ventral (MV) mesopallium. Dotted lines are brain nuclei within brain subdivisions; the song nuclei (HVC, RA, MAN, Av, MO, and Area X) are unique to vocal learners; v, the ventricular space; *, regions quantified for brain phylo-gene expression tree analyses. Nomenclature is that proposed in this study. Boundaries of some brain subdivisions differ from the available zebra brain atlas (Nixdorf-Bergweiler and Bischof, 2007), as the atlas was based only on Nissl staining, which is more difficult for identifying boundaries than gene expression profiles. Scale bar = 1 mm.
Regardless of which similarity measure we used, Distance-Correlation or Euclidian-Distance, the phylogene expression tree analyses grouped the 20 telencephalic regions into at least six major expression clusters at high similarity (0.7–0.99 correlation coefficient; high bootstrap probability [BP; 70–100%] and approximate unbiased probability [AU = 93–100] supports; color-coded in Fig. 3A; all trees shown in Fig. 4). Of the 20 telencephalic regions, 11 clustered according to the 2004–2005 terminology, whereas the remaining nine (asterisk in Fig. 3B) grouped according to a more global clustering into the six domains. These six expression clusters, using the modified terminology developed in this study, were:
Figure 3.

Brain phylo-gene expression tree. A: Tree (left) and gene expression heatmap (right) showing molecular relationships of 23 brain regions of the zebra finch based on 50 genes. The six major telencephalic subdivisions revealed by the tree are color-coded. The tree was generated with Distance-Correlation (red values inside nodes) on normalized gene expression data, followed by Biedl’s ordering of leaves according to similarity of gene expression vectors. Also shown are the Approximately Unbiased (AU) probability values above the nodes and Bootstrap Probabilities (BP) below the nodes for 1,000 replicates using Pvclust. Far right is the more global numbered pallial and sub-pallial terminologies based on this tree and known connectivity. The gene expression heatmap shows relative expression levels for each gene scaled between 0–1 (red, higher than the average for that region relative to other regions; blue, lower than the average). Above the heatmap is the tree relationship of the genes based on brain expression. B: The same tree as in (A), but with all three nomenclatures compared: the classical, 2004–2005 revisions, and this study. Bold text are newly defined terms in this study.
Figure 4.

Phylo-gene expression trees using Pvclust on different similarity measures (Distance-Correlation vs. Euclidean-Distance) and processing of gene expression data (normalized vs. discretized). A: Distance correlation tree using normalized gene expression data scaled between 0–1. B: Distance-Correlation tree using discretized gene expression data into three levels (0, 1, 2). C: Euclidean-Distance tree using normalized gene expression data scaled between 0–1. D: Euclidean distance tree using discretized gene expression data into three levels (0, 1, 2). Values inside nodes represent the strongest (1) to the weakest (21) similarity; values outside are bootstrap supports (BS, green) and approximate unbiased (AU, red) probabilities. Branches boxed in red represent the deepest node that brings regions together at 95–100 AU support (equivalent to P < 0.05).
The primary sensory input fields L2, E, and B and hyperpallium intercalatum [IH] at ~0.8 correlation, which together we refer to as primary pallium.
The nidopallium and hyperpallium [apicale part] minus primary sensory input fields [L2, E, B, and IH] at 0.86–0.99 correlation, which together we refer to as secondary pallium.
The dorsal mesopallium [hyperpallium densocellulare in the 2004–2005 view] and ventral mesopallium [mesopallium in the 2004–2005 view] with near identity at 0.99, which together we refer to as tertiary pallium.
The arcopallium regions, surprisingly only at ~0.75, which together we refer to as quaternary pallium.
The lateral and medial striatum plus the intermediate striatum [intrapeduncular nucleus in the classical view] at ~0.9.
The dorsal and ventral pallidum at ~0.97.
At a lower level in the tree (i.e., more ancestral), the recently designated pallium subdivisions clustered together at ~0.4 correlation (BP = 64%, AU = 98), separate from the striatum and the pallidum (Fig. 3A), supporting the consensus view of the new nomenclature (Reiner et al., 2004b); the high AU indicates that the relationship within the pallium is highly significant, but the modest BP indicates that the exact relationship of the primary sensory fields with other pallial populations is either not fully resolved or is a diverse hybrid of related cell types. The cerebellum layers were distant from the telencephalon but also more different from each other (longer branch lengths and weaker distance correlations; Fig. 3A).
Despite some BP supports less than 70 and AU less than 95, the topology of the phylogene expression tree was relatively stable to gene content at over 40 genes, as removal of any 1–10 genes, including those with prominent differences in different pallial regions (e.g., FOXP1, ARC, COUP-TF2, FKBP1A, DUSP1, CB1, S100B), did not change the major six clusters (Fig. 5A–F). There were some changes in the position of the anterior arcopallium, hippocampus, and cerebellum molecular layer. The anterior arcopallium switched places with the hippocampus and clustered with the arcopallium when the arcopallium enriched gene ER81 was removed (Fig. 5B); the anterior arcopallium and hippocampus clustered together with all arcopallial regions when using Euclidean-Distance (Fig. 4A–C). For this reason, we have not assigned the anterior arcopallium nucleus and hippocampus to one of the six expression clusters. The cerebellum molecular layer moved from the cerebellum to group with the pallidum when using Euclidean-Distance (Fig. 4A–C). We believe that these less stable relationships in the tree reflect real alternative shared expression profiles captured by different methods.
Figure 5.

Effect on phylo-gene expression tree topology of removing one or up to 10 genes with distinctive brain subdivision expression profiles. A: Removal of a mesopallium enriched gene (ARC). B: Removal of an arcopallium-hippocampus enriched gene (ER81). C: Removal of a nidopallium enriched gene (COUP-TF2). D: Removal of an intercalated pallium enriched gene (S100B). E: Removal of a nidopal-lium+hyperpallium gene (PPAPDC1A). F: Removal of 10 genes (those removed in panels A–E, plus SCUBE2 [mesopallium], FOXP2 [stria-tum], GRIA1 [mesopallium+striatum], GRM8 [pallium], TMEM100 [pallium+pallidum]). Values inside nodes represent the strongest (1) to the weakest (21) similarity; values outside are bootstrap supports (BS, green) and approximate unbiased (AU, red) probabilities. Branches boxed in red represent the deepest node that brings regions together at 95–100 AU support (equivalent to P < 0.05).
Some of the genes that distinguished the three major cerebral domains with higher expression were: NRN, BDNF (basal levels), D1C, GRM2, and GRIA4, and GRM8 for most pallial regions (Fig. 6A–F); several dopamine receptors (D1A, D1B, and D2), the FOXP2 and DLX6 transcription factors, the GRM5 glutamate receptor, and the cAMP regulated phosphoprotein ARPP16 for the striatal regions (Fig. 7A–H); and the NMDA receptor subunits GRIN2C and GRIN2D and the LHX8 transcription factor for the pallidal regions (Fig. 8A–C). Below we discuss the gene expression anatomical relationships within these divisions in order of most similar to the least similar (Fig. 3A).
Figure 6.

Examples of pallium enriched genes. A: Neuritin (NRN) is expressed at baseline in most pallial regions except the intermediate arcopallium (Ai). B: Brain derived neurotrophic factor (BDNF) is expressed at baseline in most nonprimary sensory pallial regions. C: Dopa-mine receptor 1C (D1C) is expressed at high levels in most pallial regions, except for the pallial song nuclei (HVC, RA, LMAN). D: Glutamate receptor metabotrophic 2 (GRM2) is expressed throughout the pallium, with lower levels in caudal pallial regions. E: Glutamate receptor ionotropic AMPA 4 (GRIA4) is expressed throughout the pallium, with lower levels in the arcopallium and song nucleus HVC. F: Glutamate receptor metabotrophic 8 (GRM8) is expressed throughout the pallium, with lower expression in the caudal nidopallium. G: Glutamate receptor ionotropic NMDA type 2A (GRIN2A) is expressed in all pallial regions along with localized expression in one basal ganglia region, the lateral striatum (LSt); it is also higher in all major song nuclei (HVC, RA, LMAN, and Area X). H: Transmembrane protein 100 (TMEM100) is expressed in all pallial regions and also in one basal ganglia population, the pallidum (P). Sections are mid-sagittal brain of male, quiet control, zebra finches. Brain region labels are shown only in panels A and C, in order to allow visualization of the signal without text interference in the other panels. White, mRNA signal. Red, cresyl violate label. Color differences are due to different batches of cresyl violate used. Grayscale image of TMEM100 is from x-ray film; all others are from emulsion-dipped slides. Sets of serial sections are in the Supporting database folder. Scale bar = 1 mm.
Figure 7.

Examples of striatum enriched genes. A: Dopamine 1A (D1A) receptor is expressed in striatal regions, with higher expression in the Area X song nucleus. B: Dopamine 1B (D1B) receptor is a paralog gene with a similar expression pattern, but with expression also in the posterior arcopallium (Ap). C: Dopamine 2 (D2) receptor has a similar pattern, with expression also in the anterior arcopallium (Aa) and a gradient of low to higher levels in MV and MD towards the LMI lamina. D: D1B receptor expression in a section more lateral to that in panel (B) showing expression in the intrapeduncular nucleus renamed here as intermediate striatum (ISt). E: Forkhead box protein 2 (FOXP2) transcription factor expression enriched in the striatum. F: Distal-less homeobox 6 (DLX6) transcription factor expression enriched in the striatum. G: Glutamate receptor metabotropic 5 (GRM5) expression enriched the striatum, lower expression in Area X, and some detectable expression in the caudal nidopallium. H: cAMP regulated phosphoprotein 16000 (ARPP16) expression enriched in the striatum. Grayscale image of ARPP16 is from x-ray film; all others are from emulsion-dipped slides. Sets of serial sections are in the Supporting database folder. Scale bar = 1 mm.
Figure 8.
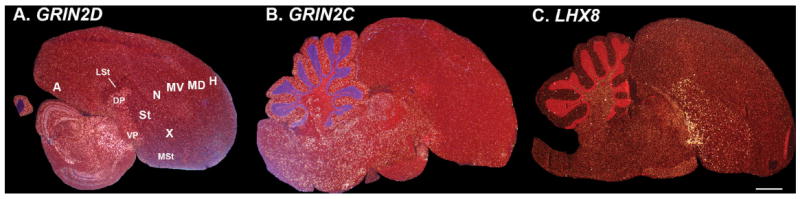
Examples of pallidum enriched genes. A: Glutamate receptor ionotropic NMDA subunit 2D (GRIN2D) enriched in the dorsal and ventral pallial regions. B: Glutamate receptor ionotropic NMDA subunit 2C (GRIN2C) shows a similar pattern. These two genes are also enriched in the brainstem. C: LIM homeobox 8 (LHX8) transcription factor is enriched in the pallidum, particularly ventral pallidum, and is expressed at high levels in scattered cells of the striatum. More complete sets of serial sections are in the Supporting database folder. Scale bar = 1 mm.
Dorsal mesopallium and ventral mesopallium, sister profiles
In the revised 2004–2005 nomenclature, the regions named hyperstriatum in birds in the classical nomenclature were redefined and divided in up to six subdivisions and called: hyperpallium apicale (HA), interstitial nucleus of the hyperpallium apicale (IHA), hyperpallium intercalatum (HI), hyperpallium densocellulare (HD), mesopallium dorsale (MD), and mesopallium ventrale (MV) (Fig. 1A,B). However, here we found that the hyperpallium densocellulare (classical hyperstriatum dorsale) in the dorsal pallium and the mesopallium (classical hyperstriatum ventrale) in the ventral pallium1 have nearly identical profiles (~0.99 correlation; Fig. 3A,B, red shading). This similarity was higher than between regions within previously accepted brain subdivisions (e.g., within nidopallium, arcopallium, striatum, and pallidum). Genes with selectively enriched expression specific to these two brain regions (except specializations in song nuclei) included ARC (basal levels), the CADPS2 calcium regulatory protein, and the D3 dopamine receptor (Fig. 9A–C). Other genes with pallial enrichment in these two regions as well as striatal enrichment were the FOXP1 transcription factor, the GRIA1, GRIK3, GRIK2, and GRM4 glutamate receptors (Fig. 9D–H), and the D1B and D2 dopamine receptors (Fig. 7B–D). The later correlation of pallial and striatal expression for 7 of 50 genes, however, was not strong enough to bring the mesopallium as a sister brain region with the striatum (Fig. 3A). With some genes it was difficult to distinguish the lamina that separates the two pallial regions, such that they could easily be interpreted as one region, which is what happened in the gene expression brain images published in the 2004–2005 revised avian brain nomenclature (Reiner et al., 2004b). Due to their similar expression profiles of the D1B and GRIA1 receptors (Figs. 7E, 9D, respectively), these two regions were inadvertently labeled just mesopallium or “dorsal mesopallium” and “ventral mesopallium,” respectively, in the gene expression images (fig. 7 of Reiner et al., 2004b, for pigeon and zebra finch), but named hyperpallium dorsale and mesopallium, respectively, in the drawings of the Nissl-stained images, the text, and tables of the same report (table 3 of Reiner et al., 2004b). We also could not find a gene that marked the hyperpallium intercalatum (classical hyperstriatum intercalatum superior) separate from the hyperpallium dorsale and mesopallium. We conclude that from a molecular perspective with at least these 50 genes the hyperpallium dorsale, hyperpallium intercalatum, and mesopallium as recently defined (Reiner et al., 2004b) are the most similar of all brain regions measured. Thus, we propose that they might be two halves (ventral and dorsal) of the same brain subdivision, which we prefer to simply call the “mesopallium (M)” or dorsal mesopallium (MD) and ventral mesopallium (MV) in order to distinguish it from the hyperpallium apicale and other brain subdivisions that they are less like (Figs. 1E vs. 3A; Table 2, red shading).
Figure 9.

Examples of mesopallium (30-pallium) enriched genes. A: Activity-regulated cytoskeleton-associated gene (ARC) is expressed at high levels in the mesopallial regions (MD and MV) relative to all other regions at baseline, in quiet control animals. B: Calcium-dependent secretion activator 2 (CADPS2) has selectively enriched expression in the mesopallium, less but specific expression in the arcopallium (A), and specialized expression in several song nuclei (HVC, Area X). C: Dopamine 3 (D3) receptor has a similar pattern as CADPS2, but with arcopallial expression restricted to its intermediate part (Ai). D: Forkhead box protein 1 (FOXP1) is enriched equally in the mesopallium and striatum (St). E: Glutamate receptor ionotropic AMPA 1 (GRIA1) has a similar pattern as FOXP1, but with greater differential expression in song nuclei. F: Glutamate receptor ionotropic kainate 3 (GRIK3) also has a similar pattern as FOXP1, but with comparable arcopal-lium expression (minus expression in the RA song nucleus). G: Glutamate receptor ionotropic kainate 2 (GRIK2) has similar mesopallial and striatal enrichment. H: Glutamate receptor metabotropic 4 (GRM4) expression is also similar, but in the arcopallium higher expression was restricted to RA. Sets of serial sections are in the Supporting database folder. Scale bar = 1 mm.
TABLE 2.
Comparison of Terminology and Cell Population Connectivity
| Name classical | Names 2004–2005 | Names this study | Cell population | Connectivity | N-L hypothesis | C-A hypothesis |
|---|---|---|---|---|---|---|
| PALLIUM | ||||||
| Intercalated hyperstriatum accessorium (IHA) | Interstitial hyperpallium apicale (IHA) | Intercalated hyperpallium (IH) | Intercalated pallium (IP) | 10-pallium | Cortex Layer IV | Cortex Layer IV |
| Nucleus Basalis (NB) | Basorostralis (B) | Intercalated nidopallium (IN = B+E+L2) | Claustrum | |||
| Ectostriatum (E) | Entopallium (E) | Claustrum | ||||
| Field L2 (L2) | Field L2 (L2) | Claustrum | ||||
| Hyperstriatum accessorium (HA) | Hyperpalllium apicale (HA) | Hyperpallium (H) | Hyperpallium (H)+ | 20-pallium | Cortex Layer III | Cortex Layer III |
| Neostriatum (N) | Nidopallium (N) | Nidopallium (N) | Nidopallium (N) | Claustrum | ||
| Hyperpallium interculatum superior (HIS) | Hyperpallium intercalatum (HI) | Mesopallium, dorsal (MD) | Mesopallium (M) | 30-pallium | Cortex Layer II | Cortex Layer V |
| Hyperstriatum dorsale (HD) | Hyperpallium densocellulare (HD) | Cortex Layer V | ||||
| Hyperpallium ventrale (HV), dorsal (HVd) | Mesopallium (M), dorsal (MD) | Mesopallium, ventral (MV) | Claustrum | |||
| Hyperpallium ventrale (HV), ventral (HVv) | Mesopallium (M), ventral (MV) | Claustrum | ||||
| Archistriatum, posterior (AP) | Posterior amygdala (PoA) | Arcopallium, posterior (AP) | Arcopallium (A) | 40-pallium | Cortex Layer V-VI | Amygdala |
| Archistriatum, intermediate (AI) | Arcopallium, intermediate (AI) | Arcopallium, intermediate (AI) | Amygdala | |||
| Archistriatum, dorsal (AD) | Arcopallium, dorsal (AD) | Arcopallium, dorsal (AD) | Amygdala | |||
| Archistriatum, anterior (AA) | Anterior amygdala (AA) | Arcopallium, anterior (AA) | Amygdala | |||
| Hippocampus (Hp) | Hippocampus (Hp) | Hippocampus (Hp) | Hippocampus (Hp) | Hippocampus | Hippocampus | |
| SUBPALLIUM | ||||||
| Lobus parolfactorius (LPO) | Medial striatum (MSt) | Medial striatum (MSt) | Striatum (St) | 10-subpallium | Striatum | Striatum |
| Paleostriatum augmentatum (PA) | Lateral Striatum (LSt) | Lateral striatum (LSt) | ||||
| Interpeduncular nucleus (INP) | Interpenduncular nucleus (INP) | Intermediate striatum (ISt) | ||||
| Paleostriatum primitivum (PP) | Dorsal pallidum (DP) or GP | Dorsal pallidum (DP) | Pallidum (P) | 20-subpallium | Pallidum | Pallidum |
| Paleostriatum ventral (PV) | Ventral pallidum (VP) | Ventral pallidum (VP) | ||||
| LAMINAE | ||||||
| Lamina frontalis suprema (LFM) | Lamina frontalis suprema (LFM) | Lamina mesopallum dorsalis (LMD) | Mesopallium lamina (LM) | |||
| Lamina frontalis superior (LFS) | Lamina frontalis superior (LFS) | Lamina mesopallium intermediate (LMI) | ||||
| Lamina hyperstriatica (LH) | Lamina mesopallialis (LaM) | Lamina mesopallium ventralis (LMV) | ||||
| Lamina archistriatalis dorsalis (LAD) | Lamina arcopallialis dorsalis (LAD) | Lamina arcopallialis dorsalis (LAD) | Arcopallium lamina (LA) | |||
| Lamina medullaris dorsalis (LMD) | Lamina pallio-subpallialis (LPS) | Lamina pallio-subpallialis (LPS) | Pallio-subpallio lamina (LPS) |
Listed are the comparative summaries of the nomenclature of the major subdivisions (cell populations) of the avian telencephalon in classical and modern times. The classical names are based on (Edinger, 1885; Edinger, 1908; Ariëns Kappers et al., 1936); the 2004–2005 view is based on (Reiner et al., 2004b; Jarvis et al., 2005); the current view is based on the findings of this study. The 4th column lists a global name for each of the subdivisions according to the findings of this study. The 5th column list numbered names according to the findings of this study combined with known major order of connections of the telencephalon. The laminae do not have connectivity names. The 6th and 7th columns indicate one vision of how the modified view in this study impacts interpretations of homologies with mammalian telencephalic cell populations. N-L, hypothesis: Nuclear-to-Layered homology hypotheses between birds and mammals; C-A, hypothesis: Claustrum-Amygdala hypotheses.
Hyperpallium and nidopallium, sister profiles
As mentioned above, cells of the hyperpallium apicale in the dorsal pallium and of the nidopallium in the ventral pallium (minus the sensory input populations in both) showed high molecular similarities (0.86–0.99; Fig. 3A. green shading). Genes with enriched expression in these two regions included a phosphatase (PPAPDC1A), an axon guidance membrane receptor (SEMA6A), an immediate early gene (C-JUN; basal levels), a GABAgeric neuron transcription factor (NKX2.1), and the isomerase FKBP1A (Fig. 10A–E). The phylogene expression tree analyses further indicated that the anterior nidopallium was more similar to the hyperpallium (apicale part) than it was to the posterior nidopallium (Fig. 3A). Genes that contributed to this differential anterior nidopallium/hyperpallium relationship were NKX2.1, FKBP1A, and the GRM1 glutamate receptor (Fig. 10D–F). Only with discretization of the data, which reduces the impact of smaller differences between regions, was the anterior and posterior nidopallium brought closer together, but still as the closest sister of the hyperpallium, with a topology that had less support (AU 60–90 vs. 76–100; Fig. 4A–D). Two genes of the 50 were exceptions: 1) COUP-TF2 was expressed at higher levels throughout the nidopallium (and arcopallium) than in the hyperpallium (Fig. 10G); and 2) SCUBE1 was expressed in scattered labeled cells throughout most of the hyperpallium (also higher in mesopallium and arcopallium), but in very few scattered cells in the nidopallium (Fig. 10H). These differences, however, were similar to differences in expression of other genes within different parts of the same subdivision (e.g., anterior vs. posterior nidopallium; medial vs. lateral striatum as described below). Thus, we conclude that with these genes the hyperpallium apicale and nidopallium have sister molecular profiles more similar to each other than they have to any other brain subdivision. Further, because the expression patterns redefine the 2004–2005 named hyperpallium dorsale and hyperpallium intercalatum as nearly identical to the mesopallium, there is no longer a need to include apicale in the name hyperpallium apicale. For these reasons, we propose calling hyperpallium apicale (HA) simply “hyperpallium (H).” We reserve the outcome of further investigation as to whether to consider a shared naming for hyperpallium and nidopallium (Figs. 1E vs. 3A); but we suggest a shared numbered naming that describes their comparable connectivity (Table 2, green shading).
Figure 10.

Examples of hyperpallium+nidopallium (20-pallium) enriched genes. A: Phosphatidic acid phosphatase 2 domain containing 1A (PPAPDC1A) has comparable enriched expression in the hyperpallium (H) and nidopallium (N). B: Semaphorin-6A (SEMA6A) axon guidance molecule has similar expression, but without enriched expression in the primary sensory fields (i.e., L2). C: Cellular Jun (C-JUN) oncogene has a similar pattern, but with less contrast in expression levels, and specialized lower expression in the Area X song nucleus relative to the surrounding striatum (St). D: NK2 homeobox 1 (NKX2.1) transcription factor known to be expressed in GABAergic neurons has a similar profile, but with comparable expression throughout the striatum and lower expression in the posterior nidopallium. E: FK506 binding protein 1A (FKBP1A) also has enriched expression in the hyperpallium and anterior nidopallium. F: Glutamate receptor metabotropic 1 (GRM1) has an inverse pattern to NKX2.1 and FKBP1A, being specifically enriched in the posterior nidopallium. The former three genes contribute to the closer association of the hyperpallium and anterior nidopallium relative to the posterior nidopallium. G: Chicken ovalbu-min upstream promoter transcription factor 2 (COUP-TF2) shows the highest enrichment in the nidopallium (and arcopallium, see Supporting F1) separate from the hyperpallium. H: Signal peptide, CUB, and EGF-like domain-containing protein 1 precursor (SCUBE1) shows an inverse pattern, with isolated cells showing higher expression in the hyperpallium than the nidopallium. Grayscale image of FKBP1A is from x-ray film; the SCUBE1 image is from a nonradioactive in situ hybridization and grayscale inverted from the original database version generated by Mello and Lovell http://www.zebrafinchatlas.org/; all others are from emulsion-dipped slides. Sets of serial sections are in the Supporting database folder. Scale bar = 1 mm.
Sensory input neurons, sister profiles, and continuity of expression
As mentioned above, the sensory input fields of L2 (auditory), entopallium (visual), and basorostralis (somatosensory) in the ventral pallium and the IHA (visual and somatosensory parts) in the dorsal pallium, all clustered closest together in the phylo-gene expression trees (Fig. 3A). Their cells are similar to layer IV neurons of mammalian cortex in that they are cell dense, granular-like, and receive sensory input from the thalamus (or midbrain for B) (Karten, 1991; Jarvis et al., 2005). With the dropping of apicale in HA, we drop apicale in IHA to become IH. Except for the Euclidean-Distance tree using discretized data, their molecular profiles were furthest removed from the pallial brain subdivisions in which they are classically considered part of: the nidopallium for L2, E, and B and hyperpallium for IH (Figs. 3, 4). In the Euclidean-Distance tree with discretized data they moved closer to the nidopallium and hyperpallium but with less support (AU 70 vs. 95; Fig. 4D). Genes that defined these sensory input populations included higher retinoic acid orphan related receptor beta (ROR-β), the GRIK1 glutamate receptor, the S100B calcium binding protein, the DUSP1 immediate early gene (activity-induced levels), and the CB1 cannabinoid receptor (Fig. 11A–H). However, ROR-β was selectively expressed only in the somatosen-sory (anterior) part of IH (Fig. 11A and Supporting F1; named aIH in Feenders et al., 2008; Horita et al., 2010). The expression patterns also revealed that L2, E, and B are not discrete separate regions as is commonly drawn in atlases (Karten and Hodos, 1967; Kuenzel and Masson, 1988; Puelles et al., 2008), but like IH they form a continuous strip of cells sandwiched between the nidopallium and striatum (Fig. 11D–F and Supporting F1 for ROR-β, GRIK1, and DUSP1; camera lucida drawings in Fig. 2A–E, J–N). A difference is that the IH strip is more flat, whereas the more ventral pallial strip meanders from caudomedial to anterolateral locations, bulging into the nidopallium for each of the three major sensory populations (L2, E, and B). Thus, since interstitial means “empty” space and intercalated means “placed in between,” we believe it is more appropriate to call IH by its original meaning, the intercalated hyperpallium (IH) with the same abbreviation, sandwiched between the hyperpallium and dorsal mesopallium. Similarly, because of its distinctive and continuous formation, in balance with the terminology for IH we propose naming the L2+E+B strip as the intercalated nidopallium (IN), sandwiched between the nidopallium and striatum (Figs. 1E vs. 7A; Table 2, orange shading).
Figure 11.

Examples of intercalated pallium (10-pallium) enriched genes. A: Retinoid-related orphan receptor beta (ROR-β) enriched in primary sensory cell populations. B: Glutamate receptor ionotropic kainate 1 (GRIK1) has a similar expression profile, but with a gradient of high to low expression from the primary sensory populations into the adjacent nidopallium and hyperpallium, and in addition enriched expression in the RA song nucleus and the granular layer of the cerebellum. C: S100 calcium binding protein B (S100B) has a similar expression profile, but without a gradient, and also enriched in the pallidum and the four major song nuclei. D–F: Medial to lateral series of dual specificity phosphatase 1 (DUSP1) expression showing induced levels in the primary cell populations, IN (L2, E, B) and IH, of an active animal in the morning from the aviary (hearing songs, seeing lights come on, and moving). G,H: Medial and lateral section of canna-binoid receptor 1 (CB1) protein expression (gray-black label) showing enrichment in the primary sensory cell populations, as well as the four major song nuclei. DUSP1 images overlap with those shown in (Horita et al., 2010); CB1 images are courtesy of Ken Soderstrom (Soderstrom et al., 2004). Sets of serial sections are in the Supporting database folder. Scale bar = 1 mm.
Arcopallium, distinct subdomains
In the 2004– 2005 revised avian brain nomenclature, the avian arcopallium was proposed to consist of five subdomains: anterior, intermediate, posterior, dorsal, and medial arcopallium (Reiner et al., 2004b; Jarvis et al., 2005). There were debates about whether differences exist between all subdomains (Reiner et al., 2004a). Some resolution has been proposed since, but with fewer genes than analyzed here, not with a quantitative approach, and still with alternative views (Yamamoto et al., 2005; Medina and Abellan, 2009; Nomura et al., 2009; Butler et al., 2011; Medina et al., 2011; Puelles, 2011). Here, we recognized expression differences in four parts of the arcopallium: anterior (Aa), intermediate (Ai), posterior (Ap), and dorsal (Ad), and thus quantified them separately. The phylo-gene expression trees brought the latter three together, but with longer branch lengths relative to other subdivisions (Fig. 3A).
The Aa relationship was positioned between these arcopallial regions and the mesopallium+nidopallium when using Distance-Correlation, but within the arcopallial regions when using Euclidean-Distance (Fig. 4C,D). These findings suggest that the anterior arcopallium is more different from the rest of the arcopallium. Genes that distinguished the non-Aa arcopallium from the rest of the telencephalon were ER81 and LHX9 (Fig. 12A,C). Examples of those that distinguished the four arcopallial subdivisions were: 1) In Aa, high NRN (Fig. 6A), D2 (Fig. 7C), and SEMA6A (Supporting F1, panels C,D); 2) In Ai, high D3 (Fig. 9C); 3) In Ap, high D1C (Fig. 6C), D1B (Fig. 7B,D), and SEMA6A (Supporting F1) and; 4) In Ad, high D1C (Fig. 6C). Generally, the differential expression patterns distinguished an intermediate arcopallium (Ai) core surrounded by relatively distinct dorsal, posterior, and anterior parts (Figs. 2D, 3A; Table 2, yellow shading). In contrast to a tentative view (Reiner et al., 2004a; Jarvis et al., 2005), we did not find a region within the arcopallium lamina boundary that expressed subpallial specific markers.
Figure 12.
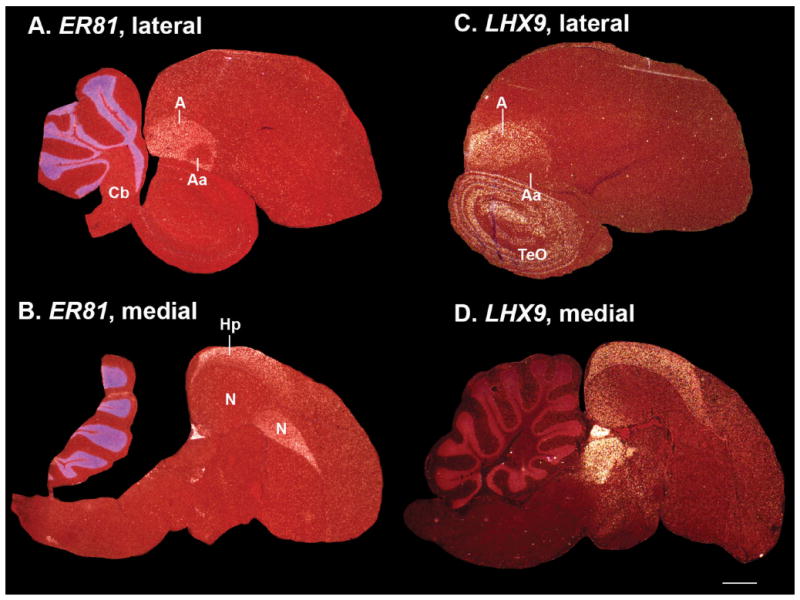
Example of arcopallium (40-pallium) enriched genes. A,B: Ets-related 81 (ER81) transcription factor is enriched in the arcopal-lium (except its Aa; panel A) and hippocampus (panel B); it is also enriched in the cerebellum granular layer. C,D: LIM home domain 9 (LHX9) has a similar arcopallium (C) and hippocampus (D) expression pattern, but is expressed in the tectum and thalamus without cerebellum enrichment (also see Supporting F1). Sets of serial sections are in the Supporting database folder. Scale bar = 1 mm.
Hippocampus
Similar to the rest of the avian pallium, the avian hippocampus is more nuclear-like than the layered organization of mammals (Atoji and Wild, 2006). Since the hippocampus was not a major focus of this study, we quantified gene expression only within its core region (in sagittal sections). The phylo-gene expression trees placed the core of the avian hippocampus as most closely related to the arcopallium, but with a lower correlation (0.57) and weaker support (BP = 78; AU = 52) than among other clusters (Fig. 3A). Example genes with selectively enriched expression in the hippocampus and arcopallium were ER81 and LHX9 (Fig. 12B,D). In contrast the GRM2 glutamate receptor was expressed throughout the arcopallium and other pallial brain regions, but was very low in the hippocampus (Fig. 6D; Supporting F1); NRN, BDNF, and GR1A were higher in the hippocampus and posterior arcopallium than in other arcopallial regions (Supporting F1). These findings suggest that the avian hippocampus may have cell types that overlap with parts of the arcopallium (Figs. 1E vs. 3A; Table 2, light yellow shading), but still differ from it in significant ways.
Striatal domains
In the revised 2004–2005 nomenclature the classically named lobus parolfactorius (LPO) and the paleostriatum augmentatum (PA) were redefined as the medial and lateral striatum (MSt and LSt), respectively (Fig. 1A,B) (Reiner et al., 2004b). However, there was debate as to whether MSt is really all striatal, or equally striatal and pallidal, due to pallidal-like neurons within it (Reiner et al., 2004a), and whether the laterally adjacent intrapeduncular nucleus (INP) was striatal or a basal cholinergic group of cells (Reiner et al., 2004b). We thus quantified expression in each. The phylo-gene expression trees grouped all three regions close together (at ~0.9 correlation; 100% AU and BP supports), distinct from the pallidal regions (DP and VP; Fig. 3). Example genes that defined these cell populations were several dopamine receptors (D1A, D1B, D2; Fig. 7A–D) and the FOXP2 and DLX6 transcription factors (Fig. 7E,F; Supporting F1). The MSt and LSt were more similar to each other, followed by INP, although the support was moderate (BP = 67; AU = 76). Example genes that contributed to these differences were noticeably higher FOXP1 (Fig. 9D) and GRIN2A (Fig. 6G) expression in LSt and INP relative to MSt; and conversely, higher D1A (Fig. 7B) and D1B (Fig. 7D) in MSt relative to LSt and INP (quantified in heat-map of Fig. 3A). These findings suggest that MSt, LSt, and INP are different subdomains of the striatum, with a minority of pallidal-like neurons in MSt that is not enough to make it more similar to the pallidum over other striatal subdivisions. Based on these results and other recent gene expression evidence in developing chicken brains (Abellan and Medina, 2009; Kuenzel et al., 2011), we propose designating INP as striatal and renaming it, based on its ventral location between MSt and LSt, the intermediate striatum (ISt; Figs. 1E vs. 3A; Table 2, purple shading).
Dorsal and ventral pallidum
In the revised 2004–2005 nomenclature the classically named paleostriatum primitivum (PP) and ventral paleostriatum (VP) were revised to the dorsal pallidum (DP; or globus pallidus [GP]) and ventral pallidum (VP), respectively (Figs. 1A,B, 2B) (Reiner et al., 2004b; Jarvis et al., 2005). The phylo-gene expression trees confirmed that the DP and VP are closely related (~0.97, 100% BP and AU; Fig. 3A,B). Distinguishing genes included GRIN2D, GRIN2C, and LHX8 in the pallidum only (Fig. 8A–C), as well as TMEM100 (Fig. 6H) and S100B (Fig. 11C) in the pallidum and other pallial populations but not in the striatum. We noted that these pallidum enriched genes, except LHX8, were also highly enriched in the brainstem, indicating a possible close relationship between the two. These findings are entirely consistent with the 2004–2005 revisions (Figs. 1D,E, 3A; Table 2, turquoise shading).
Broadly expressed genes
We noted that in our random selection of genes that belong to the glutamate and dopamine neurotransmitter receptor families (26 of the 50 genes used for the phylo-gene expression tree analyses), there were eight (30%; all glutamate receptors) that had more broadly expressed patterns in the telencephalon (Fig. 13A–H). However, even with their broad patterns, there was some differential expression for a subset of these genes that conformed to the expression clusters revealed by the phylo-gene expression trees: GRIA3 and GRIA2 were uniformly expressed across most telencephalic cell populations, except in the primary sensory populations (IH and IN) and the pallidum (P; Fig. 13A,B); GRIN3A’s exception was in IN and the pallidum (Fig. 13C); GRIN2B’s exception was in IH (Fig. 13D); and GRIK5 was lower in the pallidum (Fig. 13E). Only GRIN1, the main subunit to which most NMDA glutamate receptor subunits bind, and GRIK4 and GRM3 had comparable expression in most regions (Fig. 13F–H). Our outgroup gene, the PAX6 transcription factor, was not expressed throughout most of the telencephalon, except in the telencephalic ventricle zone and LSt of the striatum (Fig. 13I). Its very high expression in the cerebellum granule layer supported the cerebellum as an outgroup to the telencephalon.
Figure 13.
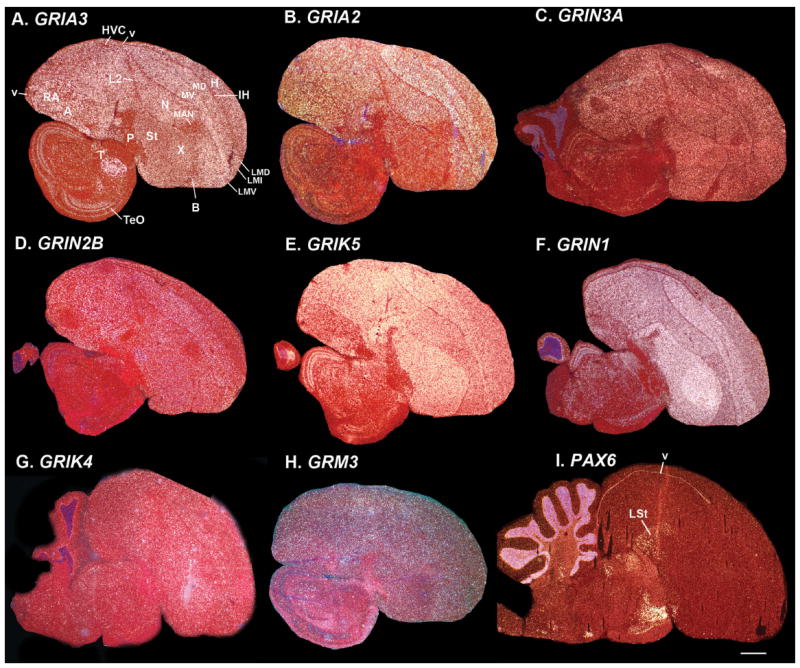
Broad telencephalic expressed genes. A: Glutamate receptor ionotropic AMPA 3 (GRIA3) is more uniformly expressed across most telencephalon cell populations, except in the primary sensory intercalated pallium populations (IH and IN) and the pallidum (P). B: Glutamate receptor ionotropic AMPA 2 (GRIA2) has a similar pattern as GRIA3, except the medial striatum has lower expression. C: Glutamate receptor ionotropic NMDA 3A (GRIN3A) has a similar pattern, except that IH has similar expression as the rest of the telencephalon. D: Glutamate receptor ionotropic NMDA 2B (GRIN2B) has a similar pattern, except that IN has similar expression as the rest of the telen-cephalon. E: Glutamate receptor ionotropic kainate 5 (GRIK5) has a similar pattern as GRIN1, except it is much lower in the pallidum. F: Glutamate receptor ionotropic NMDA 1 (GRIN1) is the main subunit to which most NMDA subunits bind, and consistent with this, it is expressed at high levels in all six major telencephalic populations. G: Glutamate receptor ionotropic kainate 4 (GRIK4) also has similar pattern as GRIN1, except it has variable expression in more lateral regions (see Supporting F1). H: Glutamate receptor metabotropic 3 (GRM3) also has a similar pattern as GRIN1, except with lower expression in Area X and some nuclei of IN (L2 and E, see Supporting F1). I: Paired box gene 6 (PAX6) transcription factor in contrast is not expressed throughout most of the telencephalon, except low levels in the telencephalic ventricle zone and LSt of the striatum. Sets of serial sections are in the Supporting database folder. Scale bar = 1 mm.
Taken together, the findings largely verify the major 2004–2005 revisions to our understanding of avian brain organization (Reiner et al., 2004b; Jarvis et al., 2005). However, some important differences were revealed. In particular, the shared profiles between the renamed hyperpallium apicale (hyperpallium in this study) and nidopallium, and between the hyperpallium densocellulare (ventral mesopallium in this study) were unexpected, due to the fact that these cell populations are thought to develop on either side (dorsal vs. ventral) of the lateral ventricle and the associated lamina. Instead, the expression data summary reveals a partial mirror image of like brain regions around the ventricle and adjacent LMI lamina (colored-coded in Fig. 1E); it is partial because the IH and IN regions (orange color) are in different relative locations. Despite the locations, such a mirror or inverse positioning suggests that the regions could be related. But we did not want to base this hypothesis on gene expression profiles only. Therefore, we next measured the histology features used to define some of the original classifications of these brain regions.
Section II: Cell densities and clustering
The different telencephalic cell populations have different cell density, cell size, and cell clustering characteristics that make them distinguishable from each other in Nissl; although we note here that the differences are not as prominent as some of the gene expression profiles. Cell density was one piece of evidence used to rename the hyperstriatum dorsale (dorsal mesopallium, MD in this study) to the hyperpallium densocellulare, because it was believed to stand out as more cell dense in Nissl staining relative to the adjacent subdivisions (Reiner et al., 2004b). However, this conclusion was based on visual inspection of brain sections, not quantitative density measurements. Here we performed density measurements (total cells/μm2) from 40-μm Nissl-stained sections (low-power images in Figs. 14, 15A–F; high-power in Fig. 16). We found that the relative cell densities of the hyperpallium densocellulare (MD in this study) and mesopallium (MV in this study) were not significantly different from each other, and moreover were instead near the lower end of the density distribution of the pallial regions (Fig. 17A). The relative densities of the hyperpallium and nidopallium were similar, as were the relative densities of the medial and lateral striatum. The primary sensory populations varied in density relative to each other, but they had the highest densities, including higher than MD, as expected based on their granular neuron appearance (Fig. 16A,B). The intermediate arcopallium and dorsal pallidum were the least dense, also as expected based on their known sparser appearance and the pale namesake for pallidum. Overall, however, the relative densities among brain subdivisions (Fig. 17A) were not as different as the subdivisions visually appear in low-magnification microscopy (Figs. 14, 15A–F).
Figure 14.

Nissl thionin staining. Zebra finches: A–C: Midline to lateral sagittal serial sections showing major lamina, telencephalic ventricle, and cell histology differences. D: Horizontal section cut at the level of the arcopallium. E–H: Coronal serial sections from anterior to posterior locations showing the shapes of the MD and MV regions and the associated lamina. For all images, brain subdivisions and ventricle are labeled in black text; lamina are labeled in red text. Scale bars = 1 mm.
Figure 15.

Nissl thionin staining for pallial regions. A: Higher magnification of a zebra finch sagittal section that includes the posterior nidopallium, mesopallium, and hyperpallium regions around the LMI lamina and lateral ventricle. B: Higher magnification of the same section, but in the anterior forebrain. C: Higher magnification of a coronal section of the same regions in the posterior forebrain. D: Higher magnification of the medial portion of the arcopallium. E: Higher magnification of the central portion of arcopallium showing most of its subdivisions and the RA song nucleus. F: Higher magnification of a lateral portion of arcopallium. G: Higher magnification of a ring dove sagittal section at the same level in panel A for the zebra finch brain. H: Higher magnification of a ring dove coronal section brain at a more posterior level than panel F for the zebra finch brain. The dove brain sections are thinner (10 μm) than the zebra finch sections (40 μm), and therefore the subdivision boundaries are not as clearly seen in digital photographs. For all images, brain subdivisions and ventricle are labeled in black text; lamina are labeled in red text. Scale bars = 500 μm.
Figure 16.
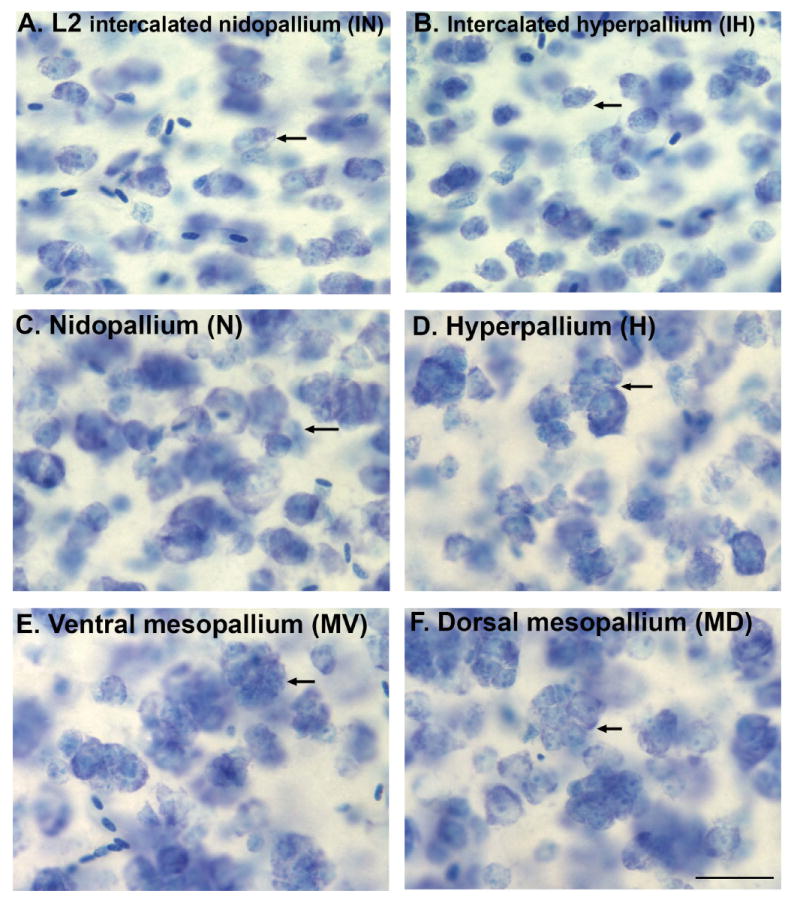
High magnification Nissl staining showing clusters of cells. A,B: Intercalated pallium regions showing organization of more isolated cells. C,D: Hyperpallium and nidopallium regions showing shared higher clustering of cells. E,F: Dorsal and ventral mesopallium regions showing a further increased clustering of cells. Arrows point to representative clusters of cells. Scale bar = 200 μm.
Figure 17.

Cell density and clustering quantifications. A: Relative cell density measures of representative brain regions. Boxplots show the average, 25th and 75th percentile, and error bars show the full range. *P < 0.05, ANOVA, n = 4 samples, showing only comparisons between MD and other dorsal pallial regions. B–D: Cell cluster distributions grouped according to similar clustering profiles and color-coded according to location in the dorsal (red) or ventral (blue) pallium. E,F: The same data from panels B-D, but now grouped according to location in the ventral (E) or dorsal (F) pallium and color-coded according to similar profiles. G: Cluster profile for two striatal regions for comparison. H: Cluster profile of the dorsal pallidum for comparison. D = the maximum distance between the cumulative distributions, and P = the corresponding probability of a Kolmogorov-Smirnov Comparison Test, hypothesizing either higher or lower distributions.
Thus, we sought an additional explanation as to why the Nissl staining patterns look different between subdivisions, and noted that at high magnification the clustering of cells appeared conspicuously different (Fig. 16). We quantified the clustering distribution and found that the IN (E, L2, B) and IH regions had the least clustering, ranging from 1–3 cells/cluster (Figs. 16A,B, 17B), followed by the nidopallium (N) and hyperpallium (H) ranging from 1–6 cells/cluster (Figs. 16C,D, 17C), followed by the hyperpallium densocellulare (MD in this study) and mesopallium (MV in this study), which had 1–12 cells/cluster (Figs. 16E,F, 17D). The high level of clustering in the latter two regions made them appear cell dense at low magnification. Despite them being located on either side of the mesopallium lamina (using our proposed terminology), the clustering distributions of IH vs. IN, hyperpallium vs. nidopallium, and hyperpallium densocellulare (MD in this study) vs. mesopallium (MV in this study) were not significantly different from each other. Conversely, despite them being located on the same side of ventricle and lamina, the IN, nidopallium, and mesopallium (MV in this study) were more different form each other than they were to the regions on the dorsal side (Fig. 17E). Likewise, the IH, hyperpallium, and hyperpallium densocellulare (MD in this study) on the dorsal side were more different from each other than they were to the regions on the ventral side (Fig. 17F). Thus, we conclude that the meaning of densocellulare in the name “hyperpallium densocellulare” as more cell dense than the adjacent regions is inaccurate, and the cell clustering is no different than the renamed mesopallium (MV in this study). The term “hyperpallium” in “hyperpallium densocellulare” is also misleading, since the histology and quantitative gene expression profiling show that it is not significantly different from the mesopallium. The combined evidence support calling the 2004–2005 named hyperpallium densocellulare (HD) as dorsal mesopallium (MD) and the mesopallium (M) as ventral mesopallium (MV).
Section III: Lamina
With a proposed revision to our understanding of the organization of the mesopallium and hyperpallium regions, we had to reconsider the lamina that separates the regions. Moreover, the nomenclature forum participants recognized that revisions for the lamina terminology were not yet fully resolved. Similar to the inconsistencies in defining the hyperpallium and mesopallium (Reiner et al., 2004b; Jarvis et al., 2005), there were inconsistencies in labeling the lamina. For example, in our revised 2004–2005 nomenclature, five telencephalic lamina are discussed and highlighted in the lamina table (table 7 of Reiner et al., 2004b), but some of the drawings of the telencephalic sections show seven lamina, four of them in the revised mesopallium area (fig. 8A,B of Reiner et al., 2004b). Here we sought to resolve this issue by analyzing four types of lamina data: 1) Nissl-stained sections revealing cell sparse zones that often characterize lamina; 2) Nissl combined with Giemsa staining from Karten et al. (2008, 2013) to reveal fiber dense regions that also often characterize lamina; 3) Darkfield images of fixed brain sections revealing white light reflection of axon bundles often present in lamina; and 4) Silver-myelin staining of sections from Karten et al. (2008, 2013) to determine which fibers are myelinated.
With each method we found five distinct telencephalic lamina (Nissl in Figs. 14, 15A–E; Nissl+Giemsa in Fig. 18; light reflection in Fig. 19; myelin in Fig. 20; summary in Table 2). These five were: 1) A lamina that separates our revised dorsal mesopallium from the intercalated hyperpallium, previously named in some studies as lamina frontalis suprema [abbreviated LFM in the 2004–2005 nomenclature], which we propose to rename as lamina mesopallium dorsalis (LMD); 2) A lamina located between our revised dorsal mesopallium and ventral mesopallium, which has been unintentionally given various names in the literature due to the aforementioned problems, including lamina frontalis superior (LFS) in the revised nomenclature table 7 of Reiner et al. (2004b), which we propose to rename as lamina mesopallium intermediate (LMI); 3) A lamina that separates our revised ventral mesopallium from the nidopallium, which was called lamina hyperstriatica (LH) in the classical nomenclature, or lamina mesopallias (LaM) in the revised 2004–2005 nomenclature, which we now propose to rename as lamina mesopallium ventralis (LMV); 4) A lamina that separates the arcopallium from the nidopallium, which was revised to lamina arcopallialis dorsalis in the 2004–2005 nomenclature and requires no revision according to our data; and 5) A lamina that separates the striatum from all other pallial regions, which was revised to lamina palliosubpallius (LPS) and also requires no revision. We could not find any evidence of additional subdivision laminae in the zebra finch, including one that would split our revised dorsal mesopallium into two parts, namely, hyperpallium intercalatum (HI) and hyperpallium densocellulare (HD) in the 2004–2005 nomenclature, nor one that would split the ventral mesopallium into two parts, namely, dorsal and ventral mesopallium in the 2004–2005 nomenclature (Fig. 1B,D; Table 2). Instead, as noted in Wild and Williams (1999), the number of laminae we found from the dorsal telencephalic surface to the nidopallium are three, all separating different parts of our revised mesopallium and adjacent brain subdivisions. For this reason, we believe including the term mesopallium in their names as LMD, LMI, and LMV is appropriate (Fig. 1C,E; Table 2, red shading).
Figure 18.
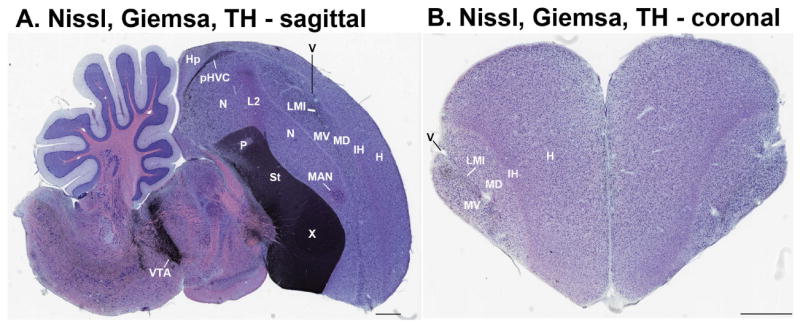
Nissl+Giemsa+tyrosine hydroxylase triple label. A: Example section used to create 3D drawings of brain regions in the sagittal plane. Note high tyrosine hydroxylase (TH) fiber labeling (black, from VTA neurons) in the striatum (St), the MAN and HVC song nuclei, and caudal LMI lamina between MV and MD, and higher Giemsa staining (pink) in the IN (shown here for L2) and IH. B: Example section through the anterior pole of the telencephalon used to create 3D drawings in the coronal plane. Note the pockets of ventricular space or large blood vessel openings in or around the LMI lamina between MD and MV, and higher Giemsa staining in the IH. Nissl cell labeling is purple in color. Sections are from the Karten et al. (2008 Karten et al. (2013) zebra finch Nissl stain atlas. A set of serial sections is in the Supporting database folder. Scale bars = 1 mm.
Figure 19.
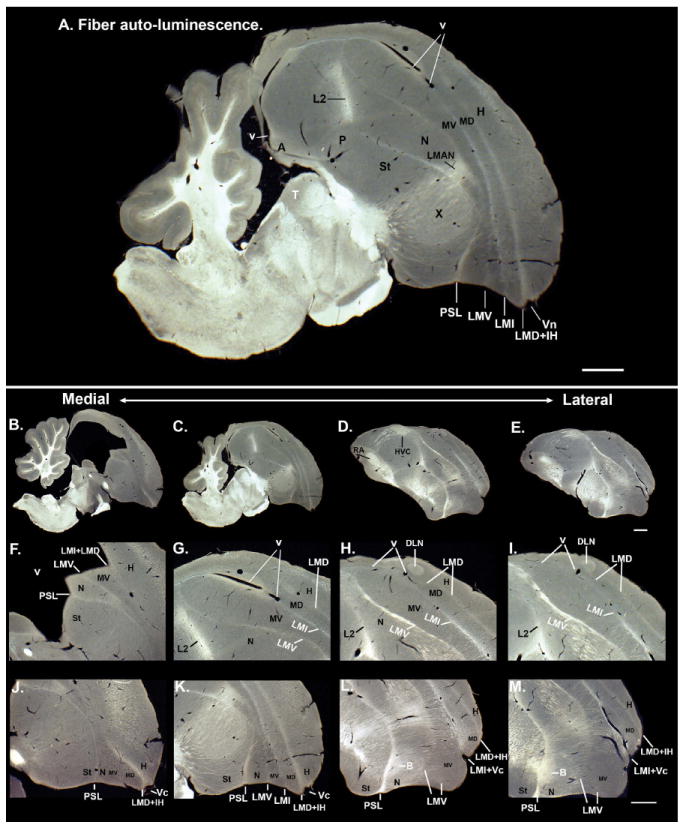
Darkfield light reflection of fibers showing lamina. A: Mid-sagittal section showing four major telencephalic lamina (LMD, LMI, LMV, and PSL) with fibers (white). B–E: Medial to lateral sagittal series showing overall organization of lamina. F–I: Higher magnification of the medial to lateral series of areas that include posterior nidopallium, mesopallium, and hyperpallium around the LMI lamina and lateral ventricle. J–M: Higher magnification of the same medial to lateral series showing the anterior regions. Laminae are labeled in white font; brain subdivisions are labeled in black font. Scale bars = 1 mm.
Figure 20.
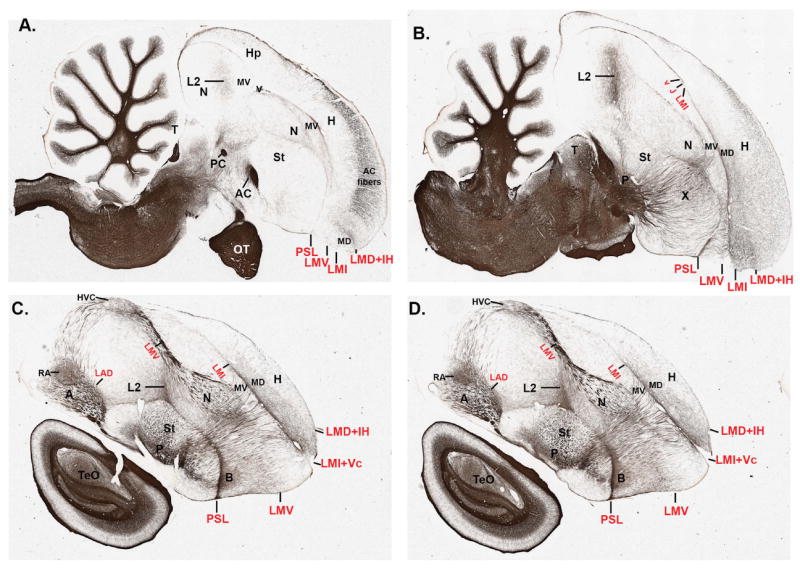
Myelin fiber staining in lamina. A–D: Medial to lateral sagittal series of myelin stained sections (dark brown). Laminae are labeled with red font; all other regions are labeled with black font. Images courtesy of Karten et al. (2008 Karten et al. (2013).
Each of the lamina had characteristic fiber and cellular features. The LMD lamina and the IH cells overlap and thus can be confused with each other. LMD is more cell sparse, but with the IH granular like cells overlapping with and directly dorsal to it (Fig. 15A–C). The same is true for the LPS lamina and the IN strip. Parts of IH (i.e., aIH) and IN (i.e., L2 and B) have myelinated fibers making them appear like lamina in myelin-stained sections (Fig. 20A–D). These myelinated fibers presumably contain the ascending thalamic axons. The LMV has some myelinated fiber bundles in its posterior-lateral end (Figs. 19C–M vs. 20C,D). The LMI separating MD and MV was unique, in that the posterior end opened into the lateral ventricle (Figs. 15A, 19F–I), consistent with what we believe was once the lateral ventricle space in the embryo (see companion paper, Chen et al., 2013); the anterior-lateral end of LMI in mid-sagittal sections came close to the vanecula (Vc), an indentation in the surface of the brain made from a large blood vessel that wraps around the telencephalon from the anterior pole (Figs. 14D, 19J–M, 20C,D, sagittal sections) to the lateral surface (Fig. 14E,F). The large blood vessel space (b) in the vanecula appeared to have branches within LMI that orientated in the anterior-posterior and medial-lateral directions (Figs. 14E,F, 15A,B). In mid-sagittal sections, the blood vessel space was large enough to split LMI open (Figs. 19E,M, 20D). For the arcopallium, we noted a clear Nissl-defined distinction of the Aa nucleus from the rest of the arcopallium, but still within the LAD lamina at the border that separates the striatum from the arcopallium (Fig. 15D–F). Overall, these findings support the view that the LMI lamina and the adjacent ventricle separates dorsal from ventral pallial regions.
Section IV: Cell population continuities
Ventricular zone continuities
We sought an explanation for the mirror image-like patterns of gene expression profiles around LMI, and considered the possibility that maybe they are continuous around the lamina and the associated lateral ventricle. To assess this idea, we examined expression of mesopallium and nidopallium+hyperpallium markers, Nissl, and fiber staining in all three planes, and discovered three potential points of continuity:
In the sagittal plane, in the anteriormost part of the brain, a thin strip of high expressing FOXP1 (and GRIA1, not shown) mesopallial-like cells wrapped around the anterior pole of LMI (containing less FoxP1 and less cell dense) connecting MD with MV (Fig. 21A,B). The LMI fiber staining in this region was also weaker than elsewhere in the lamina (Figs. 19K,L, 20B,C). In the coronal plane, MD and MV abutted each other via LMI in the anterior most sections, with ventricle space surrounding the contact zone (Fig. 18B; Supporting F1 FOXP1 coronal image, panel F). But the anterior region of MD and MV continuity was too thin to reliably capture in any other plane than the sagittal.
In the sagittal and coronal planes, where the most posterior part of LMI opened into the lateral ventricle, some of the mesopallium enriched markers (FOXP1, GRIA1, GRIK3) in MD continued to show differential expression directly above (MD) and below (MV) the lateral ventricle, ending in a similar posterior position (Fig. 21A,C; drawings in Fig. 2C,L, based on Supporting F1 FOXP1 panels 2C,L). However, in this same plane of section the nidopallium+hyperpallium enriched markers (PPAPDC1A and SEMA6A) showed a thin 1–2 cell layer of cells that wrapped around the ventricle and connected the nidopallium and hyperpallium (Fig. 21D,E). This nidopallium+hyperpallium continuity became larger further lateral (Fig. 21F,G). The nidopallium+hyperpal-lium continuity was also seen on the lateral surface of the brain in coronal sections (Fig. 22A,B). In none of the planes of section could we find a border that defined where the nidopallium ended and hyperpallium began; even COUP-TF2 in the nidopallium faded as a gradient into the hyperpallium (see serial sections of PPAPDC1A, SEMA6A, and COUP-TF2 Supporting F1). The dorsal part of this continuity has been previously called the dorsolateral corticoid area (Atoji and Wild, 2005), but it was not clear if it was part of the hyperpallium; our findings indicate that from a gene expression perspective it is similar to both the hyperpallium and nidopallium. We did not find a region of nidopallium+hyperpallium expression continuity around the anterior pole of LMI where MD and MV connected in any plane of section analyzed.
In horizontal and coronal sections, we noted a fold in the anterior ventricle (Va) where all of the complementary dorsal (H, IH, and MD) and ventral (N, IN, and MV) pallial regions converged on either side of the LMI lamina (Nissl in Fig. 14D,E; FOXP1 and PPAPDC1A horizontals in Fig. 22D,E; PPAPDC1A coronal in Fig. 22C). Even the striatum met at this convergence point. With such convergence, however, it was nearly impossible to determine if there was cell population continuity on either side of this most medial part of LMI.
Figure 21.

Cell population gene expression continuities. A: Medial section with FOXP1 expression showing the continuity of expression around LMI connecting the dorsal (MD) and ventral (MV) mesopallium. B: Higher magnification of the anterior FOXP1 expression continuity around the LMI lamina connecting MD and MV. C: Higher magnification of the posterior regions of FOXP1 expression showing continuation of MD above the ventricle and the MV below the ventricle, starting at the junction (J) where LMI meets with the ventricle (v). D: Medial section with PPAPDC1A expression showing a thin posterior strip of continuity of expression around the ventricle connecting the hyperpal-lium (H) and nidopallium (N). E: Higher magnification of the strip of PPAPDC1A continuity from panel D. F: Lateral section with PPAPDC1A expression showing an increase in the thickness of the posterior strip of continuity of expression around the ventricle connecting H and N. G: Higher magnification of the strip of PPAPDC1A continuity from panel F. The mesopallial regions where FOXP1 is expressed (see Fig. 7I) is devoid of PPAPDC1A expression. H: Monoamine oxidase B (MOAB) mRNA expression, showing enrichment in the ventricle zone and adjacent LMI lamina between MD and MV, at the similar medial position of the sections in panels A and D. I: Lateral section with MOAB label, showing lack of high expression in the region of PPAPDC1A continuity between the H and N at a similar lateral position of the section in panel F. Grayscale images of MOAB is from x-ray film; all others are from emulsion-dipped slides. Sets of serial sections are in the Supporting database folder. Scale bars = 1 mm.
Figure 22.
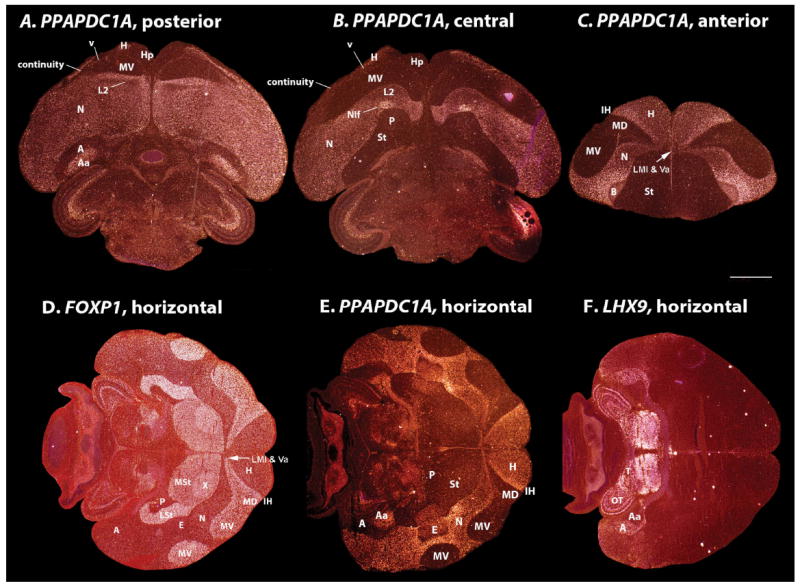
Cell population gene expression continuities and convergence. A–C: Posterior to anterior coronal series of PAPPDC1A expression in a male zebra finch, showing the hyperpallium and nidopallium region of continuity (A,B) and the anterior ventricle zone region where the hyperpallium, nidopallium, and striatum converge around the LMI lamina (C). D: FOXP1 expression in a horizontal section of a male zebra finch, showing enriched expression in the striatum and mesopallium, and convergence of each of these regions at the ventricle along the midline (arrow). E: Adjacent horizontal section hybridized with PPAPDC1A showing a complementary pattern, and verifying convergence of all non-arcopallium labeled regions at the ventricle (arrow). F: Adjacent section hybridized with LHX9 showing that the arcopal-lium (A) does not converge at the same ventricle region. Also shown is low label in the anterior arcopallium (Aa). Sets of serial sections are in the Supporting database folder. Scale bar = 1 mm.
Consistent with a relationship between the LMI lamina and the lateral ventricle, in our analyses of gene expression profiles for another project, we came across the monoamine oxidase B (MAOB) gene, which had high continuous expression in the ventricular zone of the lateral ventricle and within the adjacent LMI lamina, but in no other lamina (Fig. 21H). There was a gradient of lower expression into the respective MD and MV. The LMI MOAB label appeared to reach the anterior pole of the telencephalon, indicating that LMI could also be part of the MD and MV continuity where FoxP1 and other mesopallial markers are expressed. Further lateral, when the two mesopallial regions and thus LMI separated from the ventricle, so did the MAOB label, supporting continuity between the nidopallium and hyperpallium (Fig. 21I).
3D reconstructions
To further investigate continuities between brain regions, we generated 3D reconstructions from digital drawings of serial sagittal and coronal 40-μm sections triple-labeled with Nissl+Giemsa+tyrosine hydroxylase (Fig. 18; Supporting F1) (Karten et al., 2008). The 3D renderings confirmed that the IN regions (L2, E, and B, labeled by Giemsa stain) were adjacent to each other (Fig. 23A, orange). The entire strip was oriented from caudomedial (L2), to anterolateral (E), to anteromedial (B) positions, forming a S-shape structure over the striatum. The IN and IH were also proximal to each other in the anterior pole of the telencephalon, but did not contact each other there according to Giemsa staining (Fig. 23A, arrow). The nidopallium and hyperpallium contacted each other in the mid-sagittal region in the same dorsolateral corticoid area with PPAPDC1A and SEMA6A gene expression continuities (Fig. 23B,C, arrow). The MD and MV had their closest encounter in the anterior pole of the brain (Fig. 23D, arrow) in the same region where there was FOXP1, GRIA1, and other mesopallial marker continuities. The MV also bulged into the nidopallium in two lateral locations (compare Fig. 23D to 23C), consistent with the complex mesopallium marker shapes (e.g., Fig. 2; Supporting F1 FoxP1). We also constructed 3D renderings of the song nuclei, revealing shapes not readily apparent in single sections, including the paraHVC region that stretches over the medial nidopallium (Fig. 23E,F), which was identified by its strong tyrosine hydroxylase staining (Fig. 18A). 3D-rotation movies of all images are in Supporting movies 1–5. In summary, the evidence suggests that the dorsal and ventral pallial regions with similar gene expression and cell clustering profiles are continuous with each other. Our developmental companion study further supports this hypothesis (Chen et al., 2013).
Figure 23.

3D reconstructions of brain subdivisions. A: Lateral-to-anterior hemi-profile showing intercalated pallium regions (orange) relative to the position of the striatum (purple). The brain surface is shown in yellow shadow. B: Same brain regions with the nidopallium added (green), facing from the lateral side of the hemisphere. C: Lateral-anterior hemi-profile showing continuity of the nidopallium (N, light green) with the hyperpallium (H, dark green). D: Lateral-anterior bilateral-profile showing the dorsal (MD, dark purple) and ventral (MV, red) mesopallium. Note two bulges of the MV that fit inside the two grooves of the nidopallium in (C). Arrows, regions of continuity between dorsal and ventral pallial regions with similar gene expression profiles. E: Medial to lateral reconstructions (sagittal sections) showing the four major song nuclei in one hemisphere. White, posterior pathway song nuclei; orange, anterior pathway song nuclei. F: Anterior to posterior reconstruction (coronal sections) showing the four major song nuclei in both hemispheres. Rotating movies of panels A–F are in the Supporting movies.
Section V: Other avian species
Similar expression profiles are present in other avian species
We wondered if the zebra finch mesopallium and other pallial relationships we identified were specific to songbirds or if they can be found in other avian species? For example, the six subdivisions of the old hyperstriatum designations were originally defined in the pigeon (rock dove) and ring dove visual systems (Karten and Hodos, 1967; Shimizu et al., 1995; Medina and Reiner, 2000). Doves have more elaborate visual systems used for homing (Frost and Mouritsen, 2006; Vyssotski et al., 2009). Further, songbirds are thought to be among the most recently evolved order of birds (Hackett et al., 2008), and thus could have a brain organization that is unique to them. To address this question, we examined in other species the molecular profiles of four genes that most distinguished multiple brain subdivisions in the zebra finch: FOXP1 for the mesopallium and stria-tum, COUP-TF2 for the nidopallium separate from the hyperpallium, ROR-β for the primary sensory populations IH and IN, and ER81 for the arcopallium. For brevity, we show results of all genes examined in doves (pigeons and ring dove) and of FoxP1 in several species that span the neoaves phylogeny (Hackett et al., 2008), namely, in song sparrow (another songbird), doves, budgerigars (a parrot), hummingbirds, and quail (a galli-form). Parrots are considered a possible close relative to songbirds, hummingbirds a distant relative, closer to doves, and galliforms more distant to all them (Hackett et al., 2008; Suh et al., 2011).
We found that in all species tested, FOXP1 showed distinct labeling in dorsal and ventral mesopallium divisions that surrounded a LMI lamina (Fig. 24A–E). In doves, as in the zebra finch, COUP-TF2 labeled the nidopallium separate from the hyperpallium (Fig. 24F), ROR-β labeled a continuous IN region (L2, E, and B in Fig. 24G,H), and ER81 labeled the arcopallium (Fig. 24I). However, we did not find ROR-β in the primary somatosensory aIH of doves (not shown). There were notable differences in the shapes of molecularly defined brain subdivisions between species, particularly for the mesopallium. In doves, the dorsal and ventral mesopallium were very large, encompassing most of the frontal telencephalon volume (Figs. 24F, 25A,B for sagittals and 25a–c for coronals). The mesopallium-labeled, club-shaped region of the dove visual pathway (classical hyperstriatum dorsale [HD]) was readily seen with FOXP1 expression in frontal sections (Fig. 25d, labeled MD) (Karten and Hodos, 1967; Dubbeldam et al., 1999). However, in zebra finches it was partially club-shaped with an extension at its ventral surface that could easily be mistaken as another brain region (Figs. 2H, 14F–H, 15A–C; Supporting F1 FoxP1 frontal panel H). Around the club-like part of MD wrapped a layer of granular cells continuous with IH and LMD (Fig. 15C). Based on this label across multiple species, we believe that this lateral visual part of IH was mistaken for being lateral HD (our MD) in doves (Shimizu et al., 1995). In quails the mesopallial regions appeared thinner (Fig. 24B). In parrots, the mesopallium extend for a greater anterior–posterior depth. In hummingbirds, the depth was less so. In addition in doves, we noted differential gradients of FoxP1 expression within MD and MV suggestive of further parcellations (i.e., Fig. 25D), but there were no distinct laminae within those gradients apart from LMD, LMI, and LMV already noted. Importantly, in all species except budgerigars, in sagittal sections, we found an anterior thin bridge of continuity of FOXP1 expression between the MD and MV (Fig. 26A–E).
Figure 24.

Brain subdivision gene expression profiles across avian species. A: FOXP1 expression in pigeon, mid-sagittal section, labeling the mesopallial subdivisions and striatum. B: FOXP1 expression in Japanese quail, medial section. C: FOXP1 expression in budgerigar brain, mid-sagittal section. D: FOXP1 expression in song sparrow, mid-sagittal section. E: FOXP1 expression in Anna’s hummingbird, mid-sagittal section. F: COUP-TF2 expression in pigeon, medial section, labeling the nidopallium. G,H: ROR-b expression in adjacent medial section (G) and a lateral section (H) of pigeon brain, labeling the intercalated nidopallium regions (L2, E, and B). I: ER81 expression in pigeon brain, far lateral section, labeling the arcopallium. Scale bar = 1 mm.
Figure 25.

Extent of mesopallium in ring dove brain. Part I. A–D: FOXP1 expression in a medial to lateral sagittal series, showing label in relatively large mesopallial regions (MD and MV). Lines are approximate locations of the coronal sections in a–f. Part II. a–f: Coronal anterior to posterior series of sections from the other hemisphere of the same animal. Lines are approximate locations of the sagittal sections in A–D. Scale bars = 1 mm.
Figure 26.

Higher magnification of sagittal sections of the anterior telencephalon showing the thin strip of FoxP1 mesopallium continuity that wraps around the anterior pole of LMI connecting MD and MV in five species that span the neoaves phylogeny. A: Pigeon. B: Japa-nese quail. C: Budgerigar. D: Song sparrow. E: Anna’s hummingbird. The LMI lamina is the region of lower expression located between MD and MV. Scale bar = 0.5 mm.
We compared the gradients of FOXP1 gene expression in the dove (both ring dove and pigeon) mesopallium with adjacent Nissl-stained sections. We noted that these gradient differences corresponded to smaller differences of Nissl staining in the dove mesopallium. In particular, the dove LMI was more expanded than in other species, containing very small cells and making it appear as another subdivision in Nissl staining (Fig. 15G). The dove MV appeared to have different dorsal-ventral cell density or clustering differences, particularly in its anterior part, again making them appear as if they could be yet two additional subdivisions (Fig. 15H). However, within these gradients there were no additional cell-sparse lamina. We believe that these further parcellations seen in Nissl staining of dove brain sections may be responsible for the further subdivisions given to the aforementioned hyperpallium and mesopallium in the past atlas characterizations of dove brains (Karten and Hodos, 1967; Dubbeldam et al., 1999) and thus propagated to the revised 2004–2005 nomenclature for dove, zebra finch, and other species. However, we did not note such readily identifiable extra parcellations of the mesopallium in any of the other species tested thus far, except for the dorsal versus ventral parts of the MD in hummingbirds (not shown).
We conclude that the patterns of expression for a group of distinguishing genes in the mesopallium and other pallial subdivisions is not specific to the zebra finch, but present in other bird species. But there are differences in the overall proportions, topography, and parcellations of these brain subdivisions between species. The mesopallium seems to display the biggest differences among species. In our next and final analyses of this study, we examined how these brain subdivisions function together.
Section VI: Functional columns across cell populations
Functional columns of brain activation in the avian brain
The basal expression patterns of the genes studied here were confined to lamina-defined subdivision boundaries. However, we noted that in many of our and other previous studies, the induced expression patterns of the activity-dependent genes (EGR1, C-FOS, C-JUN, ARC, BDNF, and DUSP1) do not conform to the lamina-defined boundaries (Mello et al., 1992; Jarvis and Nottebohm, 1997; Jarvis et al., 1998; Velho et al., 2005; Wada et al., 2006; Feenders et al., 2008; Hara et al., 2009; Horita et al., 2010, 2012). These genes are upregulated in subsets of cell types in different brain regions when the animals process specific sensory stimuli or perform repeated motor behaviors; the genes can thus can be used to map physiological activation of different cell types within functionally connected neural systems (Feenders et al., 2008; Hara et al., 2009; Horita et al., 2010, 2012). EGR1, C-FOS, C-JUN, and ARC are all inducible in pallial and striatal cells except the primary sensory neurons (particularly for EGR1; (Mello and Clayton, 1995; Wada et al., 2006; Feenders et al., 2008). DUSP1 is mainly inducible in primary sensory neurons of the telencephalon and thalamus (Horita et al., 2010). BDNF is mainly inducible in pallial cells (Wada et al., 2006). Here we compared the profiles of these genes from prior studies with our modified view of avian brain organization. We found that the avian brain shows semicolumnar patterns of activation across specific combinations of brain subdivisions. We describe five such columns below.
Auditory column
When songbirds hear playbacks of song, while sitting in the dark (as determined by infrared video cameras) in sound isolation chambers and do not vocalize in response, a column of adjacent brain regions show EGR1 and DUSP1 activation with boundaries that transverses brain subdivisions (Fig. 27A,B vs. C,D) (Mello et al., 1992; Velho et al., 2005; Feenders et al., 2008; Horita et al., 2010). Mapped onto our modified view, the EGR1 activated portion of the column consisted of a caudal part of the ventral mesopallium (often called the caudal mesopallium, CM), the subadjacent caudal nidopallium (comprising what has been called L1, L3, and NCM), and a subadjacent part of caudal striatum (called CSt). The DUSP1 activated portion was the primary sensory L2 cells of IN (Fig. 27D). The only major auditory activated telencephalic region separate from this column was the RA cup in the arcopallium, adjacent to the RA song nucleus (shown in Mello and Clayton, 1994; and Feenders et al., 2008).
Figure 27.

Columns of EGR1 and DUSP1 activity-dependent gene expression in the songbird brain. A,B: Example of basal expression in an awake zebra finch, sitting still in the dark (Feenders et al., 2008; Horita et al., 2012). C,D: Example of hearing induced gene expression in a zebra finch that heard playbacks of three different conspecific songs, totaling 12 seconds in length, presented once every minute for 30 minutes (Feenders et al., 2008; Horita et al., 2012). E,F: Example of light induced gene expression in the visual pathway of the ventral pallium from a sitting still zebra finch stimulated with daylight for 1 hour after an overnight period of darkness (Mouritsen et al., 2005; Feenders et al., 2008). G,H: Example of induced gene expression in three columns: the visual pathway of the dorsal pallium, the adjacent anterior somatosensory pathway of the dorsal pallium, and a motor activated region of the ventral pallium surrounding the song nuclei in a zebra finch male that hopped around a cylindrical cage for ~30 minutes with lights on (Feenders et al., 2008; Horita et al., 2010). I,J: Example of hopping induced gene expression in the dorsal pallium somatosensory pathway and the ventral pallium motor regions surrounding the song nuclei in a deaf male zebra finch that hopped in a rotating wheel with lights off (Feenders et al., 2008; Horita et al., 2010). K,L: Example of dim-light, magnetic vision-induced gene expression in a light-dependent magnetic compass sensing column (Cluster N) of the dorsal pallium found in night-migrating garden warblers (Mouritsen et al., 2005). M,N: Example of hopping induced gene expression in a similar treated animal, but in a more medial part of the dorsal pallial somatosensory pathway (Horita et al., 2010). O,P: Example of singing induced gene expression in song nuclei of a male zebra finch that sang for 30 minutes and made some hopping movements in between singing bouts (Horita et al., 2012). Q: Example of a column of activation in N and MV of unknown function located between the known visual and somatosensory pathways of the ventral pallium, in a zebra finch that sat still perched in the dark for 30 minutes while awake. Scale bar = 1 mm.
Visual columns
When birds are stimulated with light after an overnight period of darkness, two clusters of activation are seen in known visual pathways (Feenders et al., 2008; Hara et al., 2009; Horita et al., 2010). Mapped onto our modified view, the first cluster consists of a patchy column that includes EGR1 activation in a portion of MV near the E, the subadjacent N near E, the subadjacent striatum ventral to E, and DUSP1 activation in E of the IN (Fig. 27E,F). The second and larger column is in the so-called Wulst and consists of EGR1 activation in the central part of MD, in the overlying central part of the H, and DUSP1 in the central part of IH (Fig. 27G,H); the anterior end of this column is not visual, but includes somatosensory parts of H, IH, and MD, activated during movement (Fig. 27I,J) (Feenders et al., 2008). The caudal end of this cluster in three species of migratory birds tested thus far have a dim-light magnetic sensing activated column we called cluster N, also consisting of portions of H, IH, and MD (Fig. 27K,L; Mouritsen et al., 2005; Liedvogel et al., 2007; Zapka et al., 2010) involved in processing light-dependent magnetic compass information (Zapka et al., 2009). A nucleus adjacent to IH we called the dorsal nucleus of the hyperpallium (DNH) also showed weak increased DUSP1 expression (but will need to be further investigated with quantified analyses). A difference from the ventral pallial visual columns is that with the dorsal columns we could not readily find a striatal region of activation associated with them.
Somatosensory and motor columns
When birds hop, walk, or fly (particularly while deaf and in the dark to eliminate auditory and visual activation) activated columns of brain regions are found in the two known somatosensory pathways and an apparent motor pathway (Feenders et al., 2008; Horita et al., 2010). The somatosensory pathway columns include: 1) The MV and N adjacent to B (in anterior IN), B itself (for DUSP1), and the adjacent striatum (shown in Feenders et al., 2008; Horita et al., 2010); and 2) The anterior MD and H adjacent to aIH, and aIH itself (for DUSP1; Fig. 27M,N). The motor activated column includes a proportion of the anterior MV, the subadjacent anterior N, and the subad-jacent anterior striatum all surrounding anterior song nuclei (MO, MAN, and Area X, respectively) in song learning species (Fig. 27G,I). Another movement activated column includes the posterior-lateral MV, the adjacent N, and interestingly a part of L2 of the IN located within the auditory column (compare Fig. 27C with 27I); that is, these parts of MV, N, and L2 have both motor and auditory activation (Feenders et al., 2008). Like the auditory pathway, there was a movement-activated region in the arcopallium, the lateral intermediate arcopallium (LAI), that was not part of a column (shown in Feenders et al., 2008).
Song nuclei
When song-learning birds sing, singing-driven gene expression occurs in seven analogous song nuclei (Figs. 27O,P, 28). These song nuclei include the mesopallium oval nucleus (MO) that according to our modified view is located in MV, the underlying LMAN in the anterior nidopallium, and the underlying Area X in the anterior striatum, forming a column within a column (compare Fig. 27O with 27I). The four posterior song nuclei in songbirds do not show a columnar organization, although we note that the NIf in the nidopallium meets up with avalanche (Av) in MV at the LMV lamina border (best seen with C-FOS; Fig. 29). In contrast, in hummingbirds and parrots the HVC-like and RA-like song nuclei are adjacent to each other in a semicolumnar organization at the LAD border (seen in Jarvis and Mello, 2000; Jarvis et al., 2000). The activated patterns conform to the differential expression differences already present at baseline. For example, EGR1 and C-FOS are induced in all nonprimary sensory pallial regions, and they are induced in all song nuclei in the corresponding brain subdivisions (Figs. 28, 29). C-JUN is low in the mesopallial regions at baseline, and it is not induced in the mesopallial song nuclei (Av and MO) by singing (Fig. 30). ARC is high in the mesopallium at baseline, and it is induced in the mesopallial song nuclei by singing (Fig. 31). BDNF is not expressed in the striatum at baseline, and it is not induced in Area X by singing (Fig. 32). The only exception is DUSP1, which is not induced in higher order (nonpri-mary) connected neurons in the forebrain except in song nuclei by singing (Fig. 33) (Horita et al., 2012).
Figure 28.

EGR1 and singing. A,B: Medial and lateral sections from a quiet control, sitting still animal showing basal EGR1 expression. C,D: Medial and lateral sections from a singing animal (for ~30 minutes), perched, without much hopping, showing the highest levels of singing-driven increased gene expression in all seven song nuclei (lines), and hearing-driven increased expression in the auditory pathway (NCM, L1, L3, CM, CSt) from hearing itself sing. Images are from x-ray film exposure. Scale bar = 1 mm.
Figure 29.
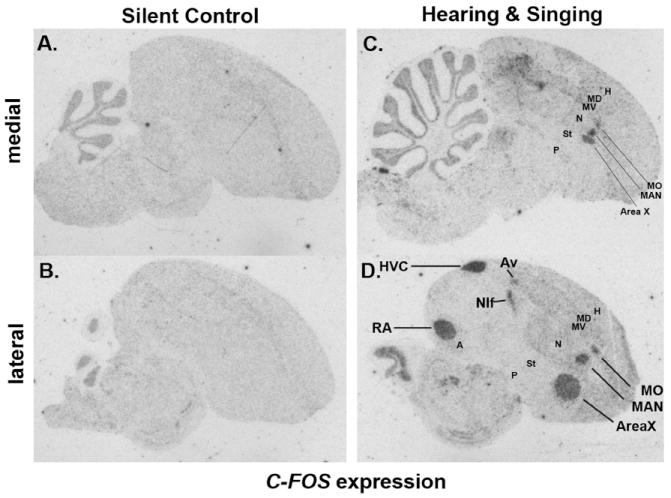
C-FOS and singing. A,B: Medial and lateral sections from a quiet control animal showing basal C-FOS expression, including slightly higher levels in the MD and MV near the LMI lamina. C,D: Medial and lateral sections from a singing animal showing the highest levels of singing-driven increased gene expression in all seven song nuclei and hearing-driven increased expression in the auditory pathway from hearing itself sing. Images are from x-ray films of sections adjacent to those shown in Fig. 28. Scale bar = 1 mm.
Figure 30.

C-JUN and singing. A,B: Medial and lateral sections from a quiet control animal showing basal C-JUN expression, which is in the nidopallium, hyperpallium, and arcopallium. C,D: Medial and lateral sections from a singing animal showing the highest levels of singing-driven increased gene expression in the nidopallial, arcopallial, and striatal song nuclei. Images are from x-ray films of sections adjacent to those shown in Fig. 28. Scale bar = 1 mm.
Figure 31.

ARC and singing. A,B: Medial and lateral sections from a quiet control animal showing basal ARC expression, which includes a gradient of high expression from the edges of the MD and MV to lower expression near the LMI lamina. C,D: Medial and lateral sections from a singing animal showing the highest levels of singing-driven increased increased gene expression in all seven song nuclei and hearing-driven increased expression the auditory pathway from hearing itself sing. Images are from x-ray films of sections adjacent to those shown in Fig. 28. Scale bar = 1 mm.
Figure 32.
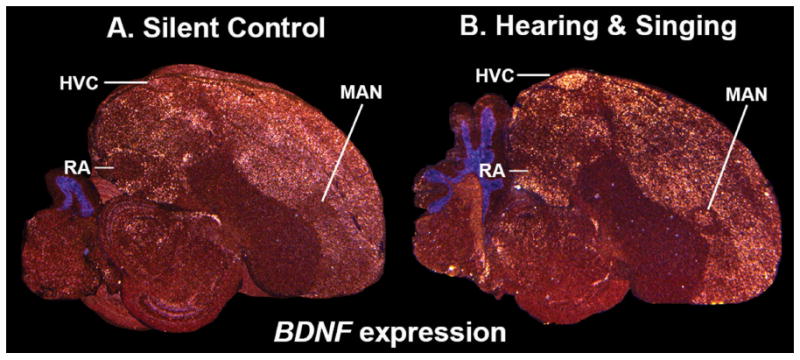
BDNF and singing. A: Lateral section from a quiet control animal showing basal BDNF expression in pallial regions, and even lower expression in song nuclei. B: Lateral section of a singing animal, showing the highest levels of singing-driven increased gene expression in pallial song nuclei HVC and LMAN, and a low level increase in RA. Images are from emulsion-dipped slides of sections adjacent to those shown in Fig. 28. Scale bar = 1 mm.
Figure 33.

DUSP1 and singing. A,B: Medial and lateral sections of a quiet control animal showing basal DUSP1 expression, including in L2 in quiet controls after waking up and hearing ambient sounds. C,D: Medial and lateral sections of a singing animal showing the highest levels of increased gene expression in the nidopallial, arcopallial, and striatal song nuclei. This is specialized singing regulated expression, as DUSP1 is not induced by stimuli or behaviors in telencephalic areas outside of IH and IN except in song nuclei (Horita et al., 2012). Images are from emulsion-dipped slides, of sections adjacent to those shown in Fig. 28. Scale bar = 1 mm.
Columns of unknown functions
In our experiments over the last 10+ years we noted many other patterns of columnar or patchy columnar activation, and even columns within columns, across subdivisions for which we do not yet have behavioral correlates. We note here that whenever they appear, directly adjacent portions of MV, N, and IN are coactivated (i.e., Fig. 27Q), or directly adjacent portions of MD, H, and IH are coactivated. The boundaries of expression are not sharply colinear, but they are adjacent regions of coactivation. These and the above findings indicate that the MD functions in topographic semicolumns with the H and IH dorsal to it and the MV functions in topographic semicolumns with the N and IN ventral to it.
DISCUSSION
In this study we performed quantitative and qualitative analyses of expression profiles of 52 genes in the avian brain. These analyses, as far as we are aware, contain the highest number of genes and are the most quantitative for comparative in situ expression profiling of avian brain subdivisions to date. The key new findings are: 1) The expression patterns of most genes in the avian telencephalon can be grouped into one of six expression populations, four pallial and two subpallial; 2) The pallial populations form a partial mirror image profile of each other above and below the ventricle and the associated LMI lamina through the mesopallium; and 3) Three of the pallial populations (mesopallium; IN+IH, hyperpallium+nidopallium) function in a columnar-like organization for specific sensory and/or motor systems. Below we discuss the implications of these findings for our understanding of avian brain organization and homologies with the mammalian brain.
Modified view helps clarify the past literature
The differences between the revised 2004–2005 view (Reiner et al., 2004b; Jarvis et al., 2005) and the view presented here are mostly on the organization of the hyperpallium and mesopallium, and a more global grouping of brain subdivisions into similar cell populations above and below the lateral ventricle and the adjacent LMI lamina. We believe that dividing the old named hyperstriatum into 5–6 distinct subdivisions in the classical (Fig. 1A) and revised 2004–2005 nomenclatures (Fig. 1B,D) resulted in more subdivisions than really exists (Karten and Hodos, 1967; Kuenzel and Masson, 1988; Shimizu and Karten, 1990; Reiner et al., 2004b). Rather, our data suggest three subdivisions: hyperpallium, intercalated hyperpallium, dorsal mesopallium + ventral mesopallium, with the latter two being continuations of the same subdivision (Fig. 1C,E). We think the further separation in the past was in part due to: 1) The view that regions above and below the lateral ventricle and thus LMI “must be” different because there is a ventricle and lamina boundary; 2) Gradients of gene expression and Nissl staining within a subdivision that can make it appear as more subdivisions; and 3) Highly localized gene expression within a subdivision without recognizing the extent of the subdivision.
For reason 1, we believe that the assumption of the differences based on the position of the ventricle and the LMI lamina should not be taken as an axiom. For reason 2, examples that can cause confusion are: a) higher gradients of expression or differential density/ clustering of cells the further away (FOXP1, ARC) or closer (D1B) to the LMI lamina for the mesopallium; b) genes, such as MOAB, that label the LMI lamina, not a new subdivision; and c) differential gradients of expression in the posterior versus anterior nidopallium (i.e., GRM1 and FKBP1A). For reason 3, examples include localized ER81 expression in the central medial nidopallium, PAX6 in the LSt and not MSt, and CADPS2 in HVC and Area X. An example of reason 3 is one of the pieces of evidence used to claim that the classically named hyperstriatum dorsale (HD, our MD) is a hyperpallial subdivision, which is that it along with the hyperpallium apicale (HA) has higher substance P labeling separate from the mesopallium (our MD) (Reiner et al., 2004b). But, at the time, we only considered high-magnification images of a dorsal brain region containing one section of HD (our MD) (fig. 7A of Reiner et al., 2004b). When we map those substance P images of pigeon and zebra finch brains onto the mesopallium, hyperpallium, and hippocampal marker patterns described here (e.g., FOXP1, PPAPDC1A, and ER81), we discover that the substance P-enriched regions actually do not include most of HA (our H) or HD (our MD) (Fig. 34A–D) (images courtesy of Toru Shimizu; Shimizu and Karten, 1990). Rather, the most substance P-enriched regions are a lateral part of the hippocampus and the DNH nucleus involved in navigation (Mouritsen et al., 2005; Heyers et al., 2007; Zapka et al., 2009). In fact, the interpretation of the expression patterns of all four genes (substance P for the hyperpallium; D1B, GRIA1, and neurotensin receptor for mesopallium) used as evidence to claim that HD (our MD) is more similar to HA (our H) in the 2004–2005 nomenclature (Reiner et al., 2004b) are unfortunate errors according to the findings of this study, which is easy to make considering how close the mesopallium and hyperpallium regions are.
Figure 34.

Substance P protein expression profiles reinterpreted in the context of the view presented in this study. A,B: Anterior and posterior coronal sections of substance P protein expression in pigeon brain. Higher substance P label is restricted to the pallidum, striatum, and a region of the hippocampus. A higher magnification image from panel B (boxed region) was used as evidence for the 2004–2005 nomenclature revisions (Reiner et al., 2004b) to the claim that the classically named hyperstriatum dorsale (HD; MD in these pictures) was similar to the hyperpallium (H in these pictures), but not to the revised mesopallium (MV in these pictures). The more expanded images shown do not support those similarities. C,D: Anterior and posterior coronal sections of substance P protein expression in zebra finch brain. The pattern is very similar to pigeon. Serial substance P sections are shown in the Supporting database folder. Images are courtesy of Dr. Toru Shimizu, with interpretations specific to this study. Scale bar = 0.5 mm.
We believe our modified view of brain organization will stand up to further gene expression analyses, as we have examined in the zebra finch brain the expression profiles of over 70 other genes in the published literature (Wada et al., 2006; Lovell et al., 2008) and online zebra finch gene expression database (http://www.zebrafinchatlas.org/ as of September 2012), to find that the patterns are complementary to those presented here, with only one gene, SCUBE1, supporting MD as slightly more similar to H than MV. Even if one or two more genes were to be found, that finding would have to be balanced with over 120 other genes thus far that do not.
A global view incorporating connectivity and brain subdivision continuities
The modified view presented here is consistent with known connectivity of neurons within each of the three comparable cell populations above and below the lateral ventricle and the adjacent LMI (Table 2). As mentioned earlier, both the IH and IN regions, which we will call together intercalated pallium (IP), are the major recipients of primary sensory input from the thalamus and brainstem. IH and IN in turn project most robustly to the hyperpallium and nidopallium, respectively. The hyperpallium and nidopallium in turn project to MD and MV, respectively (Fig. 35A) (Dubbeldam and Den Boer-Visser, 1994; Vates et al., 1996; Shimizu and Bowers, 1999; Wild and Williams, 1999, 2000; Wang et al., 2010). For these reasons and views on connectivity influenced by Karten (1991), we propose to consider IH and IN as primary (10) pallium, the hyperpallium and nidopallium as secondary (20) pallium, and the MV and MD as tertiary (30) pallium (Fig. 35A; Table 2). We also propose to consider the arcopallium as quaternary (40) pallium, since it is the last stage where input from other pallial regions are processed before being sent to the brainstem motor and ascending sensory systems. We also propose an ordered grouping of subpallial regions, with the striatum as primary (10) subpallium and the pallidum as secondary (20) subpallium, the direction of dominant input and output of the basal ganglia (Doupe et al., 2005; Kuenzel et al., 2011). One type of connection inconsistent with our hypothesis is that the hyperpallium sends pyramidal track-like projections to the brainstem as does the arcopallium (Wild and Williams, 2000). However, the possible presence of a similar pyramidal track-like projection is now also being investigated for the nidopallium (E.I. Izawa, T. Shimizu, S. Watanabe; Brain and Mind Research Meeting in Asia-Pacific, 2012, abstract and personal communication).
Figure 35.

General model of avian brain organization according to this study and the literature. A: Drawing in sagittal view with subdivision shapes based on songbirds (i.e., fig. 1 of Jarvis et al., 2005) and with arrows showing known connectivity. B: Same drawing as in (A) with outlines of different brain systems that show columnar activation of IEGs. C: Drawing in coronal view with subdivision shapes based on ring dove and pigeon (including fig. 1 of Reiner et al., 2004a). D: Drawing in horizontal view with subdivision shapes based on songbirds. Color-coding is according to shared gene expression profiles quantified in Fig. 3A. Regions of continuity are also shown. Solid white lines are lamina that separate subdivisions. Dashed lines divide regions within a subdivision, whether a lamina is present or not. Although all subdivisions are not present in sagittal and especially coronal planes, we projected them onto one plane to allow comparisons.
One possible explanation for such a mirror-image organization and similar connectivity of subdivisions on either side of the ventricle-LMI lamina divide is that the 10, 20, and 30 pallial cell types form as continuous subdivisions around different folds of the lateral ventricle, which we will call our continuum hypothesis. This would mean that the IN and IH would be continuous with each other, the nidopallium and hyperpallium would be continuous, and MV and MD would be continuous. We found some evidence of continuities between the MV and MD at the anterior-medial pole of the LMI and between the nidopallium and hyperpallium at the posterior-lateral pole of the LMI lamina where it separates from the ventricle. These continuities are consistent with findings in another study published while we were preparing ours, where we note in the images of their figures using some of the same genes (i.e., ER81 and ROR-β) continuities above and below the ventricle in turtles in sagittal sections, and expression in the same regions we note here in birds in frontal sections (Dugas-Ford et al., 2012). Imagining how such continuities could form during development for the mesopallium is not too difficult, since the mesopallium is the closest to the ventricle-LMI lamina divide, and even has a mirror-image of gene expression gradients that suggest folding around the LMI lamina. Imagining this for the other pallial regions is more difficult, as it would require complex movements of cells as the ventricle closes up during development, including that IN cells in the ventral pallium and IH cells in the dorsal pallium take different paths. Complex migration of cells has been suggested for some parts of the avian telencephalon (Nomura et al., 2009; Puelles, 2011; Tanaka et al., 2011; Dugas-Ford et al., 2012; Suzuki et al., 2012). An alternative hypothesis is that the pallial populations above and below the ventricle-LMI lamina underwent convergent evolution of developmental molecular programs that led to a similar outcome. Convergent evolution requires that more assumptions be met, including that very similar brain regions are not directly related to each other. Our companion study on brain development supports the continuum hypothesis (Chen et al., 2013).
Proposed molecular properties of different cell populations
Differential gene expression in different brain subdivisions would be expected to lead to specialized functions of those subdivisions. To assess potential functional specializations, we attempted a gene ontology (GO) analyses using available online tools in GATHER (http://gather.genome.duke.edu/), Bioprofiling (http://bioprofiling.de/), and Gorilla (http://cbl-gorilla.cs.technion.ac.il/), but found significant overrepresentations only for synaptic transmission for the mesopallium and striatum, which is not unexpected due to including nearly entire neurotransmitter receptor families in our analyses. We believe that we have too few genes enriched for a given brain subdivision to allow a proper GO analyses. But, a qualitative assessment suggests different functional categories. It has been noted that the 10-pallium cells (IP) have some of the highest firing rates and genes involved in neuroprotection and Ca2+ buffering (Chew et al., 1995; Horita et al., 2010; Hara et al., 2012). Consistent with this idea, some new specializations we noted include S100B, a Ca2+ binding protein secreted by astrocytes that protects neurons against toxic concentrations of glutamate (Tramontina et al., 2006), and GRIK1, which protects neurons that have overactivated NMDA receptors (Xu et al., 2008). The 20-pallium regions (hyperpallium and nidopallium) are the only ones thus far without neurotransmitter receptor specializations (0 of 26 genes), despite us examining nearly all known vertebrate glutamate and dopamine receptors. In contrast, the 30-pallium (mesopallium) has the most neurotransmitter specializations of the pallium (8 of 26 genes), suggesting it might have more specialized synaptic transmission functions. The 40-pallium (arcopallium) had very few specializations among the pallial regions, but the two most prominent ones were transcription factors (ER81 and LHX9), suggesting that specialized expression may be discovered for their target genes. Future investigations on hundreds of genes will be necessary to determine the functional specializations of each brain subdivision and their cell types. At a minimum, regardless of what individual scientific investigators wish to call the different cell populations, the populations with closely shared molecular profiles will likely function similarly.
Functional column organization of the avian cerebrum
Our activity-dependent gene expression results suggest that the avian pallium also has a functional columnar organization akin to the mammalian pallium. In mammals, the columns span the six cortical layers or pallial amygdala regions for particular sensory or motor systems, with topographic projections from the columnar layer V cells to the striatum (Swanson, 2000). In the avian brain, we find functional adjacent columns that wrap from ventral pallial (auditory, visual, somatic motor, and somatosensory) to dorsal pallial (somatosensory and visual) regions, each containing a primary (IN or IH), secondary (N or H), and tertiary (MV or MD) pallial population (Fig. 35B); when seen in this view the two avian somatosensory pathways are near each other in the anterior forebrain. The avian ventral pallial columns also include topographically positioned striatal activated regions. We do not yet have an immediate early gene that is activated in pallidal cells to determine if it too forms topographically organized columns with the striatum and pallium. The pallidal cells intermingled in the anterior striatum of birds (Kuenzel et al., 2011) presumably make up the pallidal component of the somatic motor and vocal motor columns. We do not know if there are striatal, pallidal, and arcopallial components to the dorsal pallial columns. This is likely, since the hyperpallium, like the nidopallium, sends robust projections to the striatum (Veenman et al., 1995).
Columnar organization in birds has been noted previously, including in our studies of behaviorally regulated gene expression in the motor pathways (Feenders et al., 2008), a recent connectivity study in the avian auditory pathway showing a columnar organization of connections that includes L2, the caudal nidopallium, and the ventral mesopallium (Wang et al., 2010) according to the terminology of this study, and past and recent connectivity studies on the dorsal pallial (H and MD) and ventral pallial (N and MV) visual pathways (Pettigrew, 1979; Medina and Reiner, 2000; Shimizu et al., 2010), again according to the terminology of this study.
Taken together, we suggest that a minimal column system to process sensory information in the avian telencephalon is to incorporate adjacent sectors of 10-pallium (IN or IH), 20-pallium (N or H), and 30-pallium (MV or MD), and the striatum, with feedback to the brainstem primarily via the 40-pallium (arcopallium). A minimal system to produce behavior is to incorporate adjacent sectors of the 20-pallium, 30-pallium, striatum, and projections to brainstem/spinal cord motor nuclei via 40-pallium.
Impact on hypotheses of brain homologies between birds and mammals
We believe our results impact the two major competing hypotheses on avian and mammalian brain pallial homologies: 1) The nuclear-to-layered hypothesis that claims that the avian pallial regions ventral to the LMI lamina (old LFS) are homologous to different mammalian cortical layers (Fig. 1D vs. 1F; red, green, yellow); and 2) The claustrum-amygdala hypothesis that claims they are homologous to the mammalian claustrum and amygdala (Fig. 1D vs. 1G; red, green, yellow). Both claim that the avian hyperpallium divisions (using older definition of divisions) is homologous to the cortex of mammals. However, both hypotheses also make similar underlying assumptions of avian brain organization that our findings do not support. Both hypotheses claim that within the avian brain the dorsal pallial (old hyperpallium; blue) and ventral pallial (i.e., DVR; red, green, yellow) regions above and below the ventricle-LMI lamina (old LFS), respectively, are not directly related (Fig. 1D), and therefore their homologies with mammals will differ (Medina and Reiner, 2000; Jarvis et al., 2005; Medina and Abellan, 2009; Butler et al., 2011). In contrast, our findings show that these dorsal and ventral avian pallial regions across the LMI border are more similar to each other than they are to adjacent cell populations on the same side of the border (Fig. 1E). In this regard, when a particular avian ventral or dorsal subdivision is said to be homologous to a mammalian cortical layer or amygdala/claustrum subregion, then that same claim may need to be transferred to the pallium counterpart on the other side the avian ventricle and LMI lamina.
We believe the same principle may apply to the mammalian brain. For example, the ER81 gene expression pattern used to support the hypothesis of homology between the avian arcopallium and mammalian layer V cortical neurons (Jarvis et al., 2005; Dugas-Ford et al., 2012) is also expressed in the basal lateral amygdala (Nomura et al., 2009). In turn, the basal lateral amygdala and other pallial amygdala regions have been proposed to developmentally derive from pallial cells that are similar to the cortex (Swanson, 2000; Deussing and Wurst, 2007; Remedios et al., 2007; Soma et al., 2009). Conversely, the EMX1 gene expression pattern used to support the hypothesis of homology of the ventral pallial region of birds (hyperstriatum ventrale; our MD) and mammalian ventral claustrum (Smith-Fernandez et al., 1998; Puelles et al., 2000; Aboitiz, 2011) is also expressed in the mammalian cortex, and is also high in both avian MV and MD, where just like for GRIA1, FOXP1, and other mesopallium marker genes, the LMI boundary is not always seen with mesopallium enriched genes. This reinterpretation of the data means that the avian MV in the ventral pallium and MD in the dorsal pallium shares an expression profile of EMX1 with both the mammalian claustrum and cortex.
These findings led us to consider a modified hypothesis similar to the field homology hypothesis of Butler and Molnar (Butler and Molnar, 2002; Molnar and Butler, 2002), where we propose that avian pallial regions above and below the LMI lamina have four major cell populations that are homologous as fields to both the mammalian six layered cortex and claustrum/amygdala complex (Fig. 1D vs. 1H; green, orange, green, and yellow). This would require that the mammalian claustrum and amygdala are nuclear versions of continuous cell populations with the six-layered cortex (Fig. 35G), and thereby they along with the six-layered cortex have homologies to the four different cell populations for birds (Fig. 35E), which can be either segregated (i.e., separate portions of 10, 20, 30, and 40 avian pallial types) or intermingled.
In terms of the functional columns we found, we caution against using this finding alone to equate “homology” of the avian columns with the mammalian six-layered cortex columns, as it is also possible that each vertebrate group arrived at a similar functional organization by different mechanisms. The mammalian cortical columns extend across layers of cells that predominantly arrive in their locations by radial migration from the same sector of the ventricle zone during development, whereas the avian pallial columns extend across larger clusters of cells that may predominantly arrive in their location by tangential migration from different sectors of the ventricle zone (Medina and Abellan, 2009). The pallial portions of the mammalian amygdala and claustrum develop by diverse mechanisms, including both local radial and long-distance tangential migration of cells from the dorsal pallium, the thalamus and preoptic area (Carney et al., 2006; Deussing and Wurst, 2007; Hirata et al., 2009; Soma et al., 2009; Garcia-Moreno et al., 2010; Bupesh et al., 2011). Nevertheless, regardless of how the pallial and subpallial cells arrive to their final destination in mammals and birds, the final outcome is similar: columns across different cell populations organized as layers (cortex in mammals) or thick nuclear slabs (pallium in birds and claustrum/amygdala in mammals).
Our hypotheses needs to be further tested with comparative high-throughput gene expression profiles between mammals, birds, and nonavian reptiles, as well as comparative analyses at other biological levels. For future molecular profiling investigations to better resolve forebrain homologies, we believe two criteria must be met: 1) One needs to know the global expression profile within each species, including cortical, amygdala, and claustrum patterns in mammals and the major subdivisions described here for birds; and 2) One needs to compare multiple genes across species, in order to guard against making broad conclusions on one or a few genes that could show variations within a brain subdivision.
In summary, we believe that the telencephalic ventricle and the associated avian LMI has been a visually deceptive barrier to recognizing relatives across its border leading to calling all regions below it striatum in the classical nomenclature and to completely different names in the modern nomenclature. Our findings suggest that the cells above and below the LMI border will have at least similar functions, due to their similar molecular profiles.
Supplementary Material
Acknowledgments
The revised views on brain terminology and organization presented in this study represent those of the co-authors, and not necessarily a consensus of the past participants of the avian brain nomenclature forum. In this regard, we solicited feedback from some experts on comparative avian neurobiology over the last 10 years and on a version of this article prior to submission for review, where some agree and others do not agree with the interpretations we made. We thank those experts, including Tony Reiner, Harvey Karten, Ann Butler, Loreta Medina, Luis Puelles, Martin Wild, Toru Shimizu, and Claudio Mello for their comments and critical discussions throughout the development of this project, which helped drive a number of the experiments we conducted to test our hypothesis. We also thank Toru Shimizu for the substance P immunocytochemistry images of the pigeon and zebra finch brains, Harvey Karten for the high-resolution zebra finch brain images stained with thionin, Giemsa, and TH markers, Claudio Mello and Pete Lovell for access to their data on the zebra finch atlas gene expression database, and Thais Paiva and Jack Fu of the Duke University statistics program for assistance with statistical analyses.
This research was supported over a 10-year period by grants from the Human Frontiers in Science Program Young Investigators Award, National Science Foundation Alan T. Waterman Award, the NIH Director’s Pioneer Award, NIMH grant R01-MH62083, NIDCD grant R01-DC007218, American Recovery and Reinvestment Act NIH supplement 3DP1OD000448-04S1, and HHMI to Erich D. Jarvis. The Oldenburg-related work (G.F., H.M.) was supported by a VW Nachwuchsgruppe grant and a Lichtenberg-professorship grant to H.M.
Abbreviations (only revised anatomical terms)
- A
Arcopallium
- Aa
Anterior arcopallium
- AC
Anterior commissure
- Ad
Dorsal arcopallium
- aDLM
Anterior nucleus of the dorsal lateral medial thalamus, a song nucleus
- Ai
Intermediate arcopallium
- aIH
Anterior intercalated hyperpallium
- AN
Anterior nidopallium
- Ap
Posterior arcopallium
- Area X
A song nucleus in the striatum
- ASt
Anterior striatum
- Av
Avalanche, a song nucleus
- B
Basorostralis
- b
Blood vessel
- Cb
Cerebellum
- CM
Caudal mesopallium
- CMM
Caudomedial mesopallium
- CSt
Caudal striatum
- DNH
Dorsal nucleus of the hyperpallium
- DP
Dorsal pallidum
- DT
Dorsal thalamus
- E
Entopallium
- GP
Globus pallidus
- H
Hyperpallium
- Hp
Hippocampus
- HVC
A letter-based name, a song nucleus
- IH
Intercalated hyperpallium
- IN
Intercalated nidopallium
- ISt
Intermediate striatum
- J
Join region between a lamina and ventricle
- L1
Field L1
- L2
Field L2
- L3
Field L3
- LAD
Lamina arcopallium dorsale
- LMAN
Lateral part of the magnocellular nucleus of anterior nidopallium, a song nucleus
- LMI
Lamina mesopallium intermediate
- LMD
Lamina mesopallium dorsale
- LMV
Lamina mesopallium ventrale
- LPS
Lamina pallio-subpallialis
- LSt
Lateral striatum
- M
Mesopallium
- MAN
Magnocellular nucleus of anterior nidopallium, a song nucleus
- MD
Dorsal mesopallium
- MO
Oval nucleus of the mesopallium, a song nucleus
- MSt
Medial striatum
- MV
Ventral mesopallium
- N
Nidopallium
- NCM
Caudal medial nidopallium
- NIf
Nucleus interface of the nidopallium
- OT
Optic tract
- Ov
Nucleus ovoidalis
- P
Pallidum
- PC
Posterior commissure
- RA
Robust nucleus of the arcopallium
- S
Septum
- St
Striatum
- T
Thalamus
- TeO
Optic tectum
- V
Ventricle
- Va
Anterior ventricle fold
- Vc
Venecula
- Vp
Posterior ventricle fold
- VP
Ventral pallidum
Footnotes
ROLE OF AUTHORS
EDJ, CCC, and KW performed experiments, quantifications, analyses, and wrote the article; JY, AP, CCC performed the computational analyses; MVR, HH, GF, OW, SCJ, ERJ, LK, SB, and ME performed gene expression experiments. SCJ also generated the 3D images and movies. AEPP processed and quantified images. CS and EH processed tissues and performed cell density measurements. HM helped co-supervise experiments.
Additional Supporting Information may be found in the online version of this article. Detailed histological data from this article are available as virtual slides or whole-slide images using Biolucida Cloud image streaming technology from MBF Bioscience. The collection can be accessed at http://Wiley.Biolucida.net/JCN521-16Jarvis_Chen. All supporting figures and videos are located at: https://www.dropbox.com/sh/hl97l6a5zzxo54o/0MVQw0_epr
Our definition of dorsal and ventral pallium is everything positioned above and below the lateral ventricle and the associated LMI lamina, respectively, including the renamed hyperpallium densocellulare (in dorsal pallium) and mesopallium (in ventral pallium) in the 2004–2005 nomenclature or dorsal mesopallium (in dorsal pallium) and ventral mesopallium (in ventral pallium) of this study. Thus, the term ventral is not restricted to the nidopallium or arcopallium, as done in some other studies (Medina L, Bupesh M, Abellan A. 2011. Contribution of genoarchitecture to understanding forebrain evolution and development, with particular emphasis on the amygdala. Brain Behav Evol 78:216–236). For this reason and others described in our companion article (Chen et al 2013), we have abandoned the common approach of equating different brain subdivisions / cell populations to respective Cartesian-defined strictly perpendicular axes of medial, lateral, dorsal, and ventral labeled regions relative to the lateral ventricle in the frontal plane.
LITERATURE CITED
- Abellan A, Medina L. Subdivisions and derivatives of the chicken subpallium based on expression of LIM and other regulatory genes and markers of neuron sub-populations during development. J Comp Neurol. 2009;515:465–501. doi: 10.1002/cne.22083. [DOI] [PubMed] [Google Scholar]
- Abellan A, Menuet A, Dehay C, Medina L, Retaux S. Differential expression of LIM-homeodomain factors in Cajal-Retzius cells of primates, rodents, and birds. Cereb Cortex. 2009;20:1788–1798. doi: 10.1093/cercor/bhp242. [DOI] [PubMed] [Google Scholar]
- Ariens Kappers CU, Huber CG, Crosby EC. Comparative Anatomy of the Nervous System of Vertebrates, Including Man. New York: Hafner; 1936. Reprinted 1960. [Google Scholar]
- Aboitiz F. Genetic and developmental homology in amniote brains. Toward conciliating radical views of brain evolution. Brain Res Bull. 2011;84:125–136. doi: 10.1016/j.brainresbull.2010.12.003. [DOI] [PubMed] [Google Scholar]
- Atoji Y, Karim MR. Expression of the neocortical marker, RORβ, in the entopallium and field L2 of adult chicken. Neurosci Lett. 2012;521:119–124. doi: 10.1016/j.neulet.2012.05.068. [DOI] [PubMed] [Google Scholar]
- Atoji Y, Wild JM. Afferent and efferent connections of the dorsolateral corticoid area and a comparison with connections of the temporo-parieto-occipital area in the pigeon (Columba livia) J Comp Neurol. 2005;485:165–182. doi: 10.1002/cne.20490. [DOI] [PubMed] [Google Scholar]
- Atoji Y, Wild JM. Anatomy of the avian hippocampal formation. Rev Neurosci. 2006;17:3–15. doi: 10.1515/revneuro.2006.17.1-2.3. [DOI] [PubMed] [Google Scholar]
- Biedl T, Brejova B, Demaine ED, Hamel AM, Vinar T. Optimal arrangement of leaves in the tree representing hierarchical clustering of gene expression data. University of Waterloo; Canada: 2001. [Google Scholar]
- Bupesh M, Legaz I, Abellan A, Medina L. Multiple telencephalic and extratelencephalic embryonic domains contribute neurons to the medial extended amygdala. J Comp Neurol. 2011;519:1505–1525. doi: 10.1002/cne.22581. [DOI] [PubMed] [Google Scholar]
- Butler AB, Molnar Z. Development and evolution of the collopallium in amniotes: a new hypothesis of field homology. Brain Res Bull. 2002;57:475–479. doi: 10.1016/s0361-9230(01)00679-7. [DOI] [PubMed] [Google Scholar]
- Butler AB, Reiner A, Karten HJ. Evolution of the amniote pallium and the origins of mammalian neocortex. Ann N Y Acad Sci. 2011;1225:14–27. doi: 10.1111/j.1749-6632.2011.06006.x. [DOI] [PMC free article] [PubMed] [Google Scholar]
- Carney RS, Alfonso TB, Cohen D, Dai H, Nery S, Stoica B, Slotkin J, Bregman BS, Fishell G, Corbin JG. Cell migration along the lateral cortical stream to the developing basal telencephalic limbic system. J Neurosci. 2006;26:11562–11574. doi: 10.1523/JNEUROSCI.3092-06.2006. [DOI] [PMC free article] [PubMed] [Google Scholar]
- Chen CC, Wada K, Jarvis ED. Radioactive in situ hybridization for detecting diverse gene expression patterns in tissue. J Vis Exp. 2012;(62) doi: 10.3791/3764. [DOI] [PMC free article] [PubMed] [Google Scholar]
- Chen CC, Winkler CM, Pfenning AR, Jarvis ED. Molecular profiling of the developing avian telencephalon: regional timing and brain subdivision continuities. J Comp Neurol. 2013 doi: 10.1002/cne.23406. this issue. [DOI] [PMC free article] [PubMed] [Google Scholar]
- Chew SJ, Mello C, Nottebohm F, Jarvis E, Vicario DS. Decrements in auditory responses to a repeated conspecific song are long-lasting and require two periods of protein synthesis in the songbird forebrain. Proc Natl Acad Sci U S A. 1995;92:3406–3410. doi: 10.1073/pnas.92.8.3406. [DOI] [PMC free article] [PubMed] [Google Scholar]
- Deussing JM, Wurst W. Amygdala and neocortex: common origins and shared mechanisms. Nat Neurosci. 2007;10:1081–1082. doi: 10.1038/nn0907-1081. [DOI] [PubMed] [Google Scholar]
- Doupe AJ, Perkel DJ, Reiner A, Stern EA. Birdbrains could teach basal ganglia research a new song. Trends Neurosci. 2005;28:353–363. doi: 10.1016/j.tins.2005.05.005. [DOI] [PubMed] [Google Scholar]
- Dubbeldam JL, Den Boer-Visser AM. Organization of ‘feeding circuits’ in birds: pathways for the control of beak and head movements. Eur J Morphol. 1994;32:127–133. [PubMed] [Google Scholar]
- Dubbeldam JL, van Ommen MH, den Boer-Visser AM. Immunohistochemical characterization of forebrain areas in the collared dove (Streptopelia Decaocto) Eur J Mor-phol. 1999;37:134–138. doi: 10.1076/ejom.37.2.134.4761. [DOI] [PubMed] [Google Scholar]
- Dugas-Ford J, Rowell JJ, Ragsdale CW. Cell-type homologies and the origins of the neocortex. Proc Natl Acad Sci U S A. 2012;109:16974–16979. doi: 10.1073/pnas.1204773109. [DOI] [PMC free article] [PubMed] [Google Scholar]
- Edinger L. In: The anatomy of the central nervous system of man and of vertebrates in general: 1896. Fifth German. Hall WS, Holland PL, Carlton EP, translators. Philadelphia: F.A. Davis; 1885. English published 1899. [Google Scholar]
- Edinger L. The relations of comparative anatomy to comparative psychology. Comp Neurol Psychol. 1908;18:437–457. [Google Scholar]
- Elmore KL, Richman MB. Euclidean distance as a similarity metric for pricincple component analysis. Month Weather Rev. 2001;129:540–549. [Google Scholar]
- Feenders G, Liedvogel M, Rivas M, Zapka M, Horita H, Hara E, Wada K, Mouritsen H, Jarvis ED. Molecular mapping of movement-associated areas in the avian brain: a motor theory for vocal learning origin. PLoS ONE. 2008;3:e1768. doi: 10.1371/journal.pone.0001768. [DOI] [PMC free article] [PubMed] [Google Scholar]
- Frost BJ, Mouritsen H. The neural mechanisms of long distance animal navigation. Curr Opin Neurobiol. 2006;16:481–488. doi: 10.1016/j.conb.2006.06.005. [DOI] [PubMed] [Google Scholar]
- Garcia-Lopez M, Abellan A, Legaz I, Rubenstein JL, Puelles L, Medina L. Histogenetic compartments of the mouse centromedial and extended amygdala based on gene expression patterns during development. J Comp Neurol. 2008;506:46–74. doi: 10.1002/cne.21524. [DOI] [PMC free article] [PubMed] [Google Scholar]
- Garcia-Moreno F, Pedraza M, Di Giovannantonio LG, Di Salvio M, Lopez-Mascaraque L, Simeone A, De Carlos JA. A neuronal migratory pathway crossing from diencephalon to telencephalon populates amygdala nuclei. Nat Neurosci. 2010;13:680–689. doi: 10.1038/nn.2556. [DOI] [PubMed] [Google Scholar]
- Hackett SJ, Kimball RT, Reddy S, Bowie RC, Braun EL, Braun MJ, Chojnowski JL, Cox WA, Han KL, Harshman J, Huddleston CJ, Marks BD, Miglia KJ, Moore WS, Sheldon FH, Steadman DW, Witt CC, Yuri T. A phyloge-nomic study of birds reveals their evolutionary history. Science. 2008;320:1763–1768. doi: 10.1126/science.1157704. [DOI] [PubMed] [Google Scholar]
- Haesler S, Wada K, Nshdejan A, Morrisey EE, Lints T, Jarvis ED, Scharff C. FoxP2 expression in avian vocal learners and non-learners. J Neurosci. 2004;24:3164–3175. doi: 10.1523/JNEUROSCI.4369-03.2004. [DOI] [PMC free article] [PubMed] [Google Scholar]
- Hara E, Kubikova L, Hessler NA, Jarvis ED. Assessing visual requirements for social context-dependent activation of the songbird song system. Proc Biol Sci. 2009;276:279–289. doi: 10.1098/rspb.2008.1138. [DOI] [PMC free article] [PubMed] [Google Scholar]
- Hara E, Rivas MV, Ward JM, Okanoya K, Jarvis ED. Convergent differential regulation of parvalbumin in the brains of vocal learners. PLoS ONE. 2012;7:e29457. doi: 10.1371/journal.pone.0029457. [DOI] [PMC free article] [PubMed] [Google Scholar]
- Heyers D, Manns M, Luksch H, Gunturkun O, Mouritsen H. A visual pathway links brain structures active during magnetic compass orientation in migratory birds. PLoS ONE. 2007;2:e937. doi: 10.1371/journal.pone.0000937. [DOI] [PMC free article] [PubMed] [Google Scholar]
- Hirata T, Li P, Lanuza GM, Cocas LA, Huntsman MM, Corbin JG. Identification of distinct telencephalic progenitor pools for neuronal diversity in the amygdala. Nat Neurosci. 2009;12:141–149. doi: 10.1038/nn.2241. [DOI] [PMC free article] [PubMed] [Google Scholar]
- Holliday IE. Kolmogorov-Smirnov Test (v1.0.3) Free Statistics Software (v1.1.23-r7) Office for Research Development and Education; 2012. [Google Scholar]
- Horita H, Wada K, Rivas MV, Hara E, Jarvis ED. The dusp1 immediate early gene is regulated by natural stimuli predominantly in sensory input neurons. J Comp Neu-rol. 2010;518:2873–2901. doi: 10.1002/cne.22370. [DOI] [PMC free article] [PubMed] [Google Scholar]
- Horita H, Kobayashi M, Liu WC, Oka K, Jarvis ED, Wada K. Specialized motor-driven dusp1 expression in the song systems of multiple lineages of vocal learning birds. PLoS ONE. 2012;7:e42173. doi: 10.1371/journal.pone.0042173. [DOI] [PMC free article] [PubMed] [Google Scholar]
- Jarvis ED, Mello CV. Molecular mapping of brain areas involved in parrot vocal communication. J Comp Neurol. 2000;419:1–31. doi: 10.1002/(sici)1096-9861(20000327)419:1<1::aid-cne1>3.0.co;2-m. [DOI] [PMC free article] [PubMed] [Google Scholar]
- Jarvis ED, Nottebohm F. Motor-driven gene expression. Proc Natl Acad Sci U S A. 1997;94:4097–4102. doi: 10.1073/pnas.94.8.4097. [DOI] [PMC free article] [PubMed] [Google Scholar]
- Jarvis ED, Schwabl H, Ribeiro S, Mello CV. Brain gene regulation by territorial singing behavior in freely ranging songbirds. Neuroreport. 1997;8:2073–2077. doi: 10.1097/00001756-199705260-00052. [DOI] [PMC free article] [PubMed] [Google Scholar]
- Jarvis ED, Scharff C, Grossman MR, Ramos JA, Nottebohm F. For whom the bird sings: context-dependent gene expression. Neuron. 1998;21:775–788. doi: 10.1016/s0896-6273(00)80594-2. [DOI] [PubMed] [Google Scholar]
- Jarvis ED, Ribeiro S, da Silva ML, Ventura D, Vielliard J, Mello CV. Behaviourally driven gene expression reveals song nuclei in hummingbird brain. Nature. 2000;406:628–632. doi: 10.1038/35020570. [DOI] [PMC free article] [PubMed] [Google Scholar]
- Jarvis ED, Gunturkun O, Bruce L, Csillag A, Karten H, Kuenzel W, Medina L, Paxinos G, Perkel DJ, Shimizu T, Striedter G, Wild JM, Ball GF, Dugas-Ford J, Durand SE, Hough GE, Husband S, Kubikova L, Lee DW, Mello CV, Powers A, Siang C, Smulders TV, Wada K, White SA, Yamamoto K, Yu J, Reiner A, Butler AB. Avian brains and a new understanding of vertebrate brain evolution. Nat Rev Neurosci. 2005;6:151–159. doi: 10.1038/nrn1606. [DOI] [PMC free article] [PubMed] [Google Scholar]
- Karten HJ. Homology and evolutionary origins of the ‘neocortex’. Brain Behav Evol. 1991;38:264–272. doi: 10.1159/000114393. [DOI] [PubMed] [Google Scholar]
- Karten HJ, Hodos W. A stereotaxic atlas of the brain of the pigeon (Columba livia) Baltimore: Johns Hopkins University Press; 1967. [Google Scholar]
- Karten HJ, Agnieszka B-P, Prechtl J, Wang H, Mitra PP. Digital atlas of the zebra finch brain (Taeniopygia gut-tata): a dimensional and high resolution photo atlas. Washington, DC: Society for Neuroscience; 2008. [Google Scholar]
- Kimpo RR, Doupe AJ. FOS is induced by singing in distinct neuronal populations in a motor network. Neuron. 1997;18:315–325. doi: 10.1016/s0896-6273(00)80271-8. [DOI] [PubMed] [Google Scholar]
- Kubikova L, Wada K, Jarvis ED. Dopamine receptors in a songbird brain. J Comp Neurol. 2010;518:741–769. doi: 10.1002/cne.22255. [DOI] [PMC free article] [PubMed] [Google Scholar]
- Kuenzel WJ, Masson M. A stereotaxic atlas of the brain of the chick (Gallus domesticus) Baltimore: Johns Hopkins University Press; 1988. [Google Scholar]
- Kuenzel WJ, Medina L, Csillag A, Perkel DJ, Reiner A. The avian subpallium: new insights into structural and functional subdivisions occupying the lateral subpallial wall and their embryological origins. Brain Res. 2011;1424:67–101. doi: 10.1016/j.brainres.2011.09.037. [DOI] [PMC free article] [PubMed] [Google Scholar]
- Li X, Wang XJ, Tannenhauser J, Podell S, Mukherjee P, Hertel M, Biane J, Masuda S, Nottebohm F, Gaasterland T. Genomic resources for songbird research and their use in characterizing gene expression during brain development. Proc Natl Acad Sci U S A. 2007;104:6834–6839. doi: 10.1073/pnas.0701619104. [DOI] [PMC free article] [PubMed] [Google Scholar]
- Liedvogel M, Feenders G, Wada K, Troje NF, Jarvis ED, Mouritsen H. Lateralized activation of Cluster N in the brains of migratory songbirds. Eur J Neurosci. 2007;25:1166–1173. doi: 10.1111/j.1460-9568.2007.05350.x. [DOI] [PMC free article] [PubMed] [Google Scholar]
- Lovell PV, Clayton DF, Replogle KL, Mello CV. Birdsong “transcriptomics”: neurochemical specializations of the oscine song system. PLoS ONE. 2008;3:e3440. doi: 10.1371/journal.pone.0003440. [DOI] [PMC free article] [PubMed] [Google Scholar]
- Medina L, Abellan A. Development and evolution of the pallium. Semin Cell Dev Biol. 2009;20:698–711. doi: 10.1016/j.semcdb.2009.04.008. [DOI] [PubMed] [Google Scholar]
- Medina L, Reiner A. Do birds possess homologues of mammalian primary visual, somatosensory and motor cortices? Trends Neurosci. 2000;23:1–12. doi: 10.1016/s0166-2236(99)01486-1. [DOI] [PubMed] [Google Scholar]
- Medina L, Bupesh M, Abellan A. Contribution of genoarchitecture to understanding forebrain evolution and development, with particular emphasis on the amygdala. Brain Behav Evol. 2011;78:216–236. doi: 10.1159/000330056. [DOI] [PubMed] [Google Scholar]
- Mello CV, Clayton DF. Song-induced ZENK gene expression in auditory pathways of songbird brain and its relation to the song control system. J Neurosci. 1994;14:6652–6666. doi: 10.1523/JNEUROSCI.14-11-06652.1994. [DOI] [PMC free article] [PubMed] [Google Scholar]
- Mello CV, Clayton DF. Differential induction of the ZENK gene in the avian forebrain and song control circuit after metrazole-induced depolarization. J Neurobiol. 1995;26:145–161. doi: 10.1002/neu.480260112. [DOI] [PubMed] [Google Scholar]
- Mello CV, Vicario DS, Clayton DF. Song presentation induces gene expression in the songbird forebrain. Proc Natl Acad Sci U S A. 1992;89:6818–6822. doi: 10.1073/pnas.89.15.6818. [DOI] [PMC free article] [PubMed] [Google Scholar]
- Molnar Z, Butler AB. Neuronal changes during forebrain evolution in amniotes: an evolutionary developmental perspective. Prog Brain Res. 2002;136:21–38. doi: 10.1016/s0079-6123(02)36005-9. [DOI] [PubMed] [Google Scholar]
- Molnar Z, Cheung AF. Towards the classification of sub-populations of layer V pyramidal projection neurons. Neurosci Res. 2006;55:105–115. doi: 10.1016/j.neures.2006.02.008. [DOI] [PubMed] [Google Scholar]
- Mouritsen H, Feenders G, Liedvogel M, Wada K, Jarvis ED. Night-vision brain area in migratory songbirds. Proc Natl Acad Sci U S A. 2005;102:8339–8344. doi: 10.1073/pnas.0409575102. [DOI] [PMC free article] [PubMed] [Google Scholar]
- Nixdorf-Bergweiler BE, Bischof H-J. A stereotaxic atlas of the brain of the zebra finch, Taeniopygia guttata. Bethesda, MD: National Center for Biotechnology Information (US); 2007. [Google Scholar]
- Nomura T, Hattori M, Osumi N. Reelin, radial fibers and cortical evolution: insights from comparative analysis of the mammalian and avian telencephalon. Dev Growth Differ. 2009;51:287–297. doi: 10.1111/j.1440-169X.2008.01073.x. [DOI] [PubMed] [Google Scholar]
- Pettigrew JD. Binocular visual processing in the owl’s telencephalon. Proc R Soc Lond B Biol Sci. 1979;204:435–454. doi: 10.2196/49307. [DOI] [PMC free article] [PubMed] [Google Scholar]
- Puelles L. Pallio-pallial tangential migrations and growth signaling: new scenario for cortical evolution? Brain Behav Evol. 2011;78:108–127. doi: 10.1159/000327905. [DOI] [PubMed] [Google Scholar]
- Puelles L, Kuwana E, Puelles E, Rubenstein JLR. Comparison of the mammalian and avian telencephalon from the perspective of gene expression data. Eur J Morphol. 1999;37:139–150. doi: 10.1076/ejom.37.2.139.4756. [DOI] [PubMed] [Google Scholar]
- Puelles L, Kuwana E, Puelles E, Bulfone A, Shimamura K, Keleher J, Smiga S, Rubenstein J. Pallial and subpallial derivatives in the embryonic chick and mouse telencephalon, traced by the expression of the genes Dlx-2, Emx-1, Nkx-2.1, Pax-6, and Tbr-1. J Comp Neurol. 2000;424:409–438. doi: 10.1002/1096-9861(20000828)424:3<409::aid-cne3>3.0.co;2-7. [DOI] [PubMed] [Google Scholar]
- Puelles E, Martinez-de-la-Torre M, Paxinos G, Watson C, Martinez S. The chick brain in stereotaxic coordinates: an atlas featuring neuromeric subdivisions and mammalian homologies. New York: Academic Press; 2008. [Google Scholar]
- Reiner A, Perkel DJ, Bruce L, Butler AB, Csillag A, Kuenzel W, Medina L, Paxinos G, Shimizu T, Striedter GF, Wild M, Ball GF, Durand S, Gunturkun O, Lee DW, Mello CV, Powers A, White SA, Hough G, Kubikova L, Smulders TV, Wada K, Dugas-Ford J, Husband S, Yamamoto K, Yu J, Siang C, Jarvis ED. The Avian Brain Nomenclature Forum: a new century in comparative neuroanatomy. J Comp Neurol. 2004a;473:E1–E6. doi: 10.1002/cne.20119. [DOI] [PMC free article] [PubMed] [Google Scholar]
- Reiner A, Perkel DJ, Bruce LL, Butler AB, Csillag A, Kuenzel W, Medina L, Paxinos G, Shimizu T, Striedter G, Wild M, Ball GF, Durand S, Guturkun O, Lee DW, Mello CV, Powers A, White SA, Hough G, Kubikova L, Smulders TV, Wada K, Dugas-Ford J, Husband S, Yamamoto K, Yu J, Siang C, Jarvis ED. Revised nomenclature for avian telencephalon and some related brainstem nuclei. J Comp Neurol. 2004b;473:377–414. doi: 10.1002/cne.20118. [DOI] [PMC free article] [PubMed] [Google Scholar]
- Remedios R, Huilgol D, Saha B, Hari P, Bhatnagar L, Kowalczyk T, Hevner RF, Suda Y, Aizawa S, Ohshima T, Stoykova A, Tole S. A stream of cells migrating from the caudal telencephalon reveals a link between the amygdala and neocortex. Nat Neurosci. 2007;10:1141–1150. doi: 10.1038/nn1955. [DOI] [PubMed] [Google Scholar]
- Replogle K, Arnold AP, Ball GF, Band M, Bensch S, Brenowitz EA, Dong S, Drnevich J, Ferris M, George JM, Gong G, Hasselquist D, Hernandez AG, Kim R, Lewin HA, Liu L, Lovell PV, Mello CV, Naurin S, Rodriguez-Zas S, Thimmapuram J, Wade J, Clayton DF. The Songbird Neurogenomics (SoNG) initiative: community-based tools and strategies for study of brain gene function and evolution. BMC Genomics. 2008;9:131. doi: 10.1186/1471-2164-9-131. [DOI] [PMC free article] [PubMed] [Google Scholar]
- Shimizu T, Bowers AN. Visual circuits of the avian telencephalon: evolutionary implications. Behav Brain Res. 1999;98:183–191. doi: 10.1016/s0166-4328(98)00083-7. [DOI] [PubMed] [Google Scholar]
- Shimizu T, Karten HJ. Immunohistochemical analysis of the visual wulst of the pigeon (Columba livia) J Comp Neurol. 1990;300:346–369. doi: 10.1002/cne.903000307. [DOI] [PubMed] [Google Scholar]
- Shimizu T, Cox K, Karten HJ. Intratelencephalic projections of the visual wulst in pigeons (Columba livia) J Comp Neurol. 1995;359:551–572. doi: 10.1002/cne.903590404. [DOI] [PubMed] [Google Scholar]
- Shimizu T, Patton TB, Husband SA. Avian visual behavior and the organization of the telencephalon. Brain Behav Evol. 2010;75:204–217. doi: 10.1159/000314283. [DOI] [PMC free article] [PubMed] [Google Scholar]
- Smith-Fernandez AS, Pieau C, Reperant J, Boncinelli E, Wassef M. Expression of the Emx-1 and Dlx-1 homeobox genes define three molecularly distinct domains in the telencephalon of mouse, chick, turtle and frog embryos: implications for the evolution of telencephalic subdivisions in amniotes. Development. 1998;125:2099–2111. doi: 10.1242/dev.125.11.2099. [DOI] [PubMed] [Google Scholar]
- Soderstrom K, Tian Q, Valenti M, Di Marzo V. Endocannabinoids link feeding state and auditory perception-related gene expression. J Neurosci. 2004;24:10013–10021. doi: 10.1523/JNEUROSCI.3298-04.2004. [DOI] [PMC free article] [PubMed] [Google Scholar]
- Soma M, Aizawa H, Ito Y, Maekawa M, Osumi N, Nakahira E, Okamoto H, Tanaka K, Yuasa S. Development of the mouse amygdala as revealed by enhanced green fluorescent protein gene transfer by means of in utero elec-troporation. J Comp Neurol. 2009;513:113–128. doi: 10.1002/cne.21945. [DOI] [PubMed] [Google Scholar]
- Suh A, Paus M, Kiefmann M, Churakov G, Franke FA, Brosius J, Kriegs JO, Schmitz J. Mesozoic retroposons reveal parrots as the closest living relatives of passerine birds. Nat Commun. 2011;2:443. doi: 10.1038/ncomms1448. [DOI] [PMC free article] [PubMed] [Google Scholar]
- Suzuki R, Shimodaira H. Pvclust: an R package for assessing the uncertainty in hierarchical clustering. Bioin-formatics. 2006;22:1540–1542. doi: 10.1093/bioinformatics/btl117. [DOI] [PubMed] [Google Scholar]
- Suzuki IK, Kawasaki T, Gojobori T, Hirata T. The temporal sequence of the mammalian neocortical neurogenetic program drives mediolateral pattern in the chick pallium. Dev Cell. 2012;22:863–870. doi: 10.1016/j.devcel.2012.01.004. [DOI] [PubMed] [Google Scholar]
- Swanson LW. Cerebral hemisphere regulation of motivated behavior. Brain Res. 2000;886:113–164. doi: 10.1016/s0006-8993(00)02905-x. [DOI] [PubMed] [Google Scholar]
- Tanaka DH, Oiwa R, Sasaki E, Nakajima K. Changes in cortical interneuron migration contribute to the evolution of the neocortex. Proc Natl Acad Sci U S A. 2011;108:8015–8020. doi: 10.1073/pnas.1102153108. [DOI] [PMC free article] [PubMed] [Google Scholar]
- Tramontina F, Tramontina AC, Souza DF, Leite MC, Gottfried C, Souza DO, Wofchuk ST, Goncalves CA. Glutamate uptake is stimulated by extracellular S100B in hip-pocampal astrocytes. Cell Mol Neurobiol. 2006;26:81–86. doi: 10.1007/s10571-006-9099-8. [DOI] [PMC free article] [PubMed] [Google Scholar]
- Uchida S, Imagawa T, Shinozaki A, Furue M, Ali S, Hosaka Y, Uehara M. Distribution of astroglial lineage cells in developing chicken telencephalon from embryo to young chick. J Vet Med Sci. 2010;72:1597–1602. doi: 10.1292/jvms.10-0209. [DOI] [PubMed] [Google Scholar]
- Vates GE, Broome BM, Mello CV, Nottebohm F. Auditory pathways of caudal telencephalon and their relation to the song system of adult male zebra finches. J Comp Neurol. 1996;366:613–642. doi: 10.1002/(SICI)1096-9861(19960318)366:4<613::AID-CNE5>3.0.CO;2-7. [DOI] [PubMed] [Google Scholar]
- Veenman CL, Wild JM, Reiner A. Organization of the avian “corticostriatal” projection system: a retrograde and anterograde pathway tracing study in pigeons. J Comp Neurol. 1995;354:87–126. doi: 10.1002/cne.903540108. [DOI] [PubMed] [Google Scholar]
- Velho TA, Pinaud R, Rodrigues PV, Mello CV. Co-induction of activity-dependent genes in songbirds. Eur J Neu-rosci. 2005;22:1667–1678. doi: 10.1111/j.1460-9568.2005.04369.x. [DOI] [PubMed] [Google Scholar]
- Vyssotski AL, Dell’Omo G, Dell’Ariccia G, Abramchuk AN, Serkov AN, Latanov AV, Loizzo A, Wolfer DP, Lipp HP. EEG responses to visual landmarks in flying pigeons. Curr Biol. 2009;19:1159–1166. doi: 10.1016/j.cub.2009.05.070. [DOI] [PubMed] [Google Scholar]
- Wada K, Sakaguchi H, Jarvis ED, Hagiwara M. Differential expression of glutamate receptors in avian neural pathways for learned vocalization. J Comp Neurol. 2004;476:44–64. doi: 10.1002/cne.20201. [DOI] [PMC free article] [PubMed] [Google Scholar]
- Wada K, Howard JT, McConnell P, Whitney O, Lints T, Rivas MV, Horita H, Patterson MA, White SA, Scharff C, Haesler S, Zhao S, Sakaguchi H, Hagiwara M, Shiraki T, Hirozane-Kishikawa T, Skene P, Hayashizaki Y, Carninci P, Jarvis ED. A molecular neuroethological approach for identifying and characterizing a cascade of behaviorally regulated genes. Proc Natl Acad Sci U S A. 2006;103:15212–15217. doi: 10.1073/pnas.0607098103. [DOI] [PMC free article] [PubMed] [Google Scholar]
- Wang Y, Brzozowska-Prechtl A, Karten HJ. Laminar and columnar auditory cortex in avian brain. Proc Natl Acad Sci U S A. 2010;107:12676–12681. doi: 10.1073/pnas.1006645107. [DOI] [PMC free article] [PubMed] [Google Scholar]
- Watakabe A, Ichinohe N, Ohsawa S, Hashikawa T, Komatsu Y, Rockland KS, Yamamori T. Comparative analysis of layer-specific genes in Mammalian neocortex. Cereb Cortex. 2007;17:1918–1933. doi: 10.1093/cercor/bhl102. [DOI] [PubMed] [Google Scholar]
- Wild JM, Williams MN. Rostral wulst of passerine birds: II. Intratelencephalic projections to nuclei associated with the auditory and song systems. J Comp Neurol. 1999;413:520–534. doi: 10.1002/(sici)1096-9861(19991101)413:4<520::aid-cne3>3.0.co;2-b. [DOI] [PubMed] [Google Scholar]
- Wild JM, Williams MN. Rostral wulst in passerine birds. I Origin, course, and terminations of an avian pyramidal tract. J Comp Neurol. 2000;416:429–450. [PubMed] [Google Scholar]
- Xu J, Liu Y, Zhang GY. Neuroprotection of GluR5-containing kainate receptor activation against ischemic brain injury through decreasing tyrosine phosphorylation of N-methyl-D-aspartate receptors mediated by Src kinase. J Biol Chem. 2008;283:29355–29366. doi: 10.1074/jbc.M800393200. [DOI] [PMC free article] [PubMed] [Google Scholar]
- Yamamoto K, Reiner A. Distribution of the limbic system-associated membrane protein (LAMP) in pigeon forebrain and midbrain. J Comp Neurol. 2005;486:221–242. doi: 10.1002/cne.20562. [DOI] [PubMed] [Google Scholar]
- Yamamoto K, Sun Z, Wang HB, Reiner A. Subpallial amygdala and nucleus taeniae in birds resemble extended amygdala and medial amygdala in mammals in their expression of markers of regional identity. Brain Res Bull. 2005;66:341–347. doi: 10.1016/j.brainresbull.2005.02.016. [DOI] [PubMed] [Google Scholar]
- Zapka M, Heyers D, Hein CM, Engels S, Schneider NL, Hans J, Weiler S, Dreyer D, Kishkinev D, Wild JM, Mouritsen H. Visual but not trigeminal mediation of magnetic compass information in a migratory bird. Nature. 2009;461:1274–1277. doi: 10.1038/nature08528. [DOI] [PubMed] [Google Scholar]
- Zapka M, Heyers D, Liedvogel M, Jarvis ED, Mouritsen H. Night-time neuronal activation of Cluster N in a day- and night-migrating songbird. Eur J Neurosci. 2010;32:619–624. doi: 10.1111/j.1460-9568.2010.07311.x. [DOI] [PMC free article] [PubMed] [Google Scholar]
- Zeigler HP, Marler P, editors. Behavioral neurobiology of birdsong. New York: Academy of Science; 2004. [Google Scholar]
Associated Data
This section collects any data citations, data availability statements, or supplementary materials included in this article.