

Abstract
The cell membrane provides critical cellular functions that rely on its elaborate structure and organization. The structure of turtle membranes is an important part of an ongoing study of erythrocyte membranes. Using a combination of atomic force microscopy and single-molecule force spectroscopy, we characterized the turtle erythrocyte membrane structure with molecular resolution in a quasi-native state. High-resolution images both leaflets of turtle erythrocyte membranes revealed a smooth outer membrane leaflet and a protein covered inner membrane leaflet. This asymmetry was verified by single-molecule force spectroscopy, which detects numerous exposed amino groups of membrane proteins in the inner membrane leaflet but much fewer in the outer leaflet. The asymmetric membrane structure of turtle erythrocytes is consistent with the semi-mosaic model of human, chicken and fish erythrocyte membrane structure, making the semi-mosaic model more widely applicable. From the perspective of biological evolution, this result may support the universality of the semi-mosaic model.
Keywords: asymmetry, atomic force microscopy, membrane structure, turtle erythrocyte
INTRODUCTION
Most cellular processes, including intracellular ion homeostasis, exchange of substances and energy, cell migration, vesicular traffic, cell division and cellular signaling depend on the elaborate structure and organization of the plasma membrane (Bandorowicz-Pikula et al., 2012; Keren, 2011; Muller, 2008; Wu et al., 2013). Composed of lipids and proteins, cellular membranes have been extensively studied in detail for decades (Simons and Ikonen, 1997; Singer and Nicolson, 1972; Vereb et al., 2003). Many isolated proteins and protein domains in the cell membrane have been identified; however, the overall protein distributions and arrangements in both leaflets still remain uncertain. To characterize the overall picture of protein and lipid distributions in erythrocyte cell membranes, the semi-mosaic model was recently proposed (Wang et al., 2010).
Turtles are the most ancient of reptiles in the evolutionary context, and have been phylogenetically classified both as basal to all other reptiles and as nested within them (Chiari et al., 2012; Werneburg and Sanchez-Villagra, 2009). Therefore, a study of turtle membrane structure is an indispensable part of a systematic study of erythrocyte membranes. The basic cytoarchitecture of erythrocytes has been largely conserved throughout the history of phylogenetic evolution, although it is possible that some variations in different species occurred (Bhattacharyya et al., 2004). Except for the sizes, turtle erythrocyte morphology is similar to those of fish and chickens. The major membrane proteins and phospholipid composition of erythrocyte membranes are not significantly different among these species (Drew et al., 2004; Ferlazzo et al., 2011; Gao et al., 2013; Hagerstrand et al., 1999). However, the molecule-level structure of the turtle erythrocyte membranes remains unknown. Here, to verify whether or not the semi-mosaic model is applicable to the membrane structure of turtle erythrocyte, turtle erythrocyte membrane were prepared and examined under near-native conditions.
Atomic force microscopy (AFM) is a valuable tool for the investigation of biological membranes, which allows for imaging cell membranes and membrane proteins under physiological conditions at molecular resolution. High-resolution topographies of erythrocyte and nucleated mammalian cell membranes (Wang et al., 2010; Zhao et al., 2014), native and reconstituted membrane proteins (Medalsy et al., 2011; Sumino et al., 2013), organelle membrane (Adams et al., 2013; Tian et al., 2013; Xu et al., 2013) have been acquired. Video-rate, high-speed AFM has enabled the visualization of membrane dynamics (Suzuki et al., 2013). AFM-based single-molecule force spectroscopy is a highly sensitive method to measure piconewton inter- and intra-molecular forces such as those in antibody-antigen and receptor-ligand interactions (Gupta et al., 2012; Hao et al., 2013; Hinterdorfer et al., 1996; Kong et al., 2013). So far, reports on the membrane structure of turtle erythrocytes studied by AFM are lacking. Here, the membrane structure of turtle erythrocytes is characterized with AFM, including the protein distribution on both leaflets and the arrangement of proteins relative to the lipid bilayer.
MATERIALS AND METHODS
Isolation of the turtle erythrocytes
Blood samples of the red-eared fresh-water turtle (Trachemys scripta) were collected in centrifuge tubes containing heparin. Isolation of turtle erythrocytes was performed at room temperature. Erythrocytes were washed five times in 1 ml phosphate-buffered saline solution (PBS, 136.9 mM NaCl, 2.7 mM KCl, 1.5 mM KH2PO4, 8.1 mM Na2HPO4·7H2O, pH 7.4) by a low speed centrifuge (1000 rpm × 1 min) and resuspended in PBS solution. 3-(aminopropyl) triethoxysilane-coated mica (APTES-mica) substrate was prepared as described (Tian et al., 2013). The erythrocyte suspension (200 μl) was deposited onto APTES-mica. After 20 min, the non-adsorbed erythrocytes were washed away with PBS solution. The prepared sample was mounted onto an AFM liquid flow cell containing PBS solution and imaged immediately.
Preparation of the outer and inner leaflets of erythrocyte membranes
High-resolution imaging of the outer leaflet of the turtle erythrocyte membrane was performed on the smooth edge of the intact erythrocyte.The inner membrane leaflet was prepared by shearing open adsorbed erythrocytes with a fast stream of hypotonic buffer (6.845 mM NaCl, 0.135 mM KCl, 0.075 mM KH2PO4, 0.405 mM Na2HPO4·7H2O, pH7.4) through a needle at a 20-degree angle (Wang et al., 2010). The prepared membranes were then treated with high salt buffer (2 M NaCl, 2.7 mM KCl, 1.5 mM KH2PO4, and 1 mM Na2HPO4·7H2O, pH 7.2) for 30 min at room temperature to remove membrane skeleton proteins.
Digestion of the inner leaflet of erythrocyte membranes with proteinase K
The inner leaflet of erythrocyte membranes was prepared as described above and then digested with 1.0 mg/ml proteinase K (Sigma) for 30 min at 37°C. The membranes were then washed in PBS solution for three times and immediately imaged with AFM.
AFM imaging and force spectroscopy
The AFM imaging and force spectroscopy of isolated erythrocytes and erythrocyte membranes were performed with AFM 5500 (Agilent Technologies, USA). All the images (512 × 512 pixels) were obtained at room temperature in PBS solution. Erythrocyte sizes and membrane heights were measured with PicoScan 5.3.3 software (Agilent Technologies, USA).
In force spectroscopy measurements, the AFM tips were functionalized with glutaraldehyde as described (Wang et al., 2010). For statistical analysis, thousands of force curves were recorded in different positions of the inner and outer leaflet of erythrocyte membranes. The force curves were processed with MathLab 7.9 (Math Works Inc.).
RESULTS
AFM imaging of the smooth outer surface of the turtle erythrocytes
As shown in Fig. 1A, the intact turtle erythrocytes are biconvex oval discs with elliptical nuclei bulging in the central regions (black dashed circle) and a marginal band of microtubules along the periphery (Coiro et al., 1978; Euteneuer et al., 1985). Relative to our previous results for human, birds, and fish erythrocytes (Tian et al., 2014a; 2014b), the turtle erythrocytes are the largest we have observed, with an average length of 27.5 ± 4.5 μm, and an average width of 15.2 ± 1.5 μm. The average nucleus has a length of 8.0 ± 3.1 μm and a width of 4.8 ± 1.2 μm. The height between the substrate and the nucleus is 1.4 ± 0.3 μm (Fig. 1A, bottom).
Fig. 1.
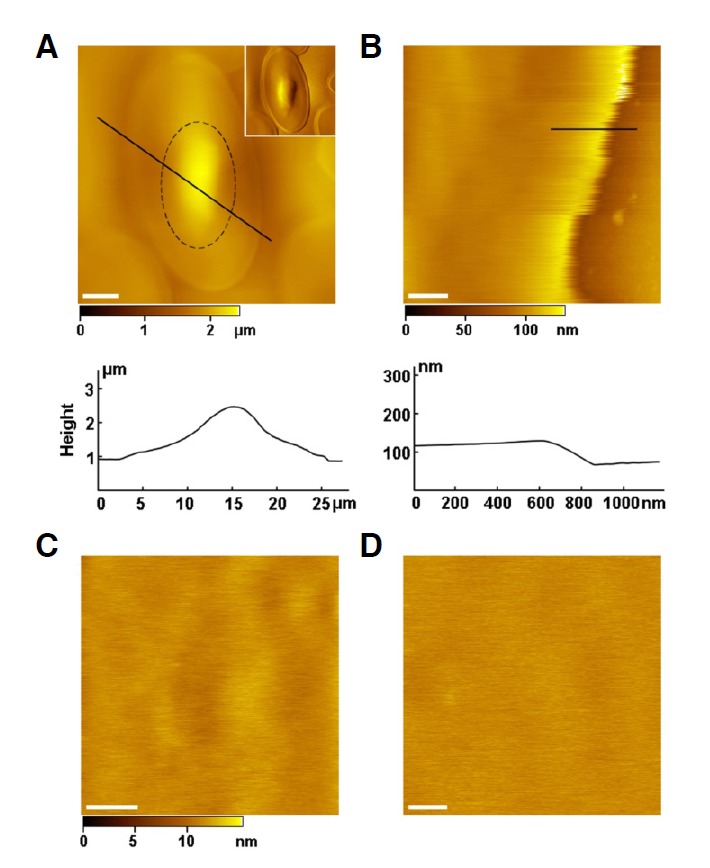
AFM topographic images of the smooth outer surface of the turtle erythrocytes. (A) The intact turtle erythrocyte is 27.5 ± 4.5 μm long, 15.2 ± 1.5 μm wide, and 1.4 ± 0.3 μm high. A black dashed circle encloses the nucleus (8.0 ± 3.1 μm long; 4.8 ± 1.2 μm wide). The inset is the correponding amplitude image. The bottom is the cross-sectional analysis along the black line. (B) The smooth edge of the intact turtle erythrocyte (47.2 ± 4.1 nm, thickness). The bottom is the cross-sectional analysis along the black line. (C) High-resolution image of the smooth edge. (D) High-resolution image of the prepared outer membrane leaflet. The average roughness of the outer membrane leaflet is 0.52 ± 0.11 nm. Scale bars: 5 μm in (A), 500 nm in (B), 200 nm in (C), 100 nm in (D).
The intact turtle erythrocytes contain few organelles in the cytoplasm (Morgan et al., 2009), and the membrane surface appears quite smooth. Firmly adhered to the substrate, the erythrocytes flatten out with a thickness of 47.2 ± 4.1 nm at the edges (Fig. 1B, bottom), which enables us to obtain high-resolution images of the outer leaflet. We have acquired many stable images on the smooth edge. As shown in Fig. 1C, there are no obvious proteins or protrusions on the outer leaflet, which has an average roughness of 0.52 ± 0.11 nm in its native state. To test whether the interaction between the AFM tips and the outer surface of living cells produces blurry images, rendering the outer-leaflet proteins undetectable, we performed high-resolution imaging on outer leaflet membrane patches produced by the shearing method discussed above (Fig. 1D). It was found that the outer leaflets patches were just as smooth as that of the intact erythrocyte. Thus, there appear to be no proteins in the outer surface of the turtle erythrocyte membranes.
AFM imaging of the protein-covered inner leaflet of turtle erythrocyte membranes
To study the distribution of proteins on the cytoplasmic side of the membranes, we disrupted the cells by shearing, as discussed above. This method has previously been used to obtain clean membranes (Cai et al., 2012; Ziegler et al., 1998) for high-resolution AFM images and to keep the membrane structure intact. Following the removal of membrane skeletons with the high-salt treatment, the inner leaflet of turtle erythrocyte membranes was revealed to be rather rough and covered with dense proteins (Fig. 2A), which can be seen more clearly at higher resolution (Fig. 2B). There are also many particles on the substrate (arrows), which are most likely adsorbed proteins from the shearing procedure. The average roughness of the inner membrane leaflet (4.0 ± 0.8 nm) is considerably larger than that of the outer membrane leaflet. The average height of the membranes between the substrate and the proteins is 18.5 ± 2.4 nm. High-resolution images of the inner membrane leaflet (Fig. 2C) reveal crowded protein particles standing closely to each other with no visible lipid bilayer. The proteins in the inner membrane leaflet have a broad range in size and shape, with diameters of 15–200 nm. 70% fall between 40 and 80 nm (Fig. 2D). Figure 2E shows the height distribution of the protein particles above the membrane, which varies from 1.0 to 27.0 nm and has a peak at 10–16 nm. This corresponds to a diversity of proteins and protein aggregations in the inner membrane leaflet, such as ATPase and band-3 protein (Gao et al., 2013; Stabenau et al., 1991). These proteins on the inner leaflet of erythrocyte membranes could be potentially identified using AFM-based topography and recognition imaging (TREC) (Jiang et al., 2009) and/or stochastic optical reconstruction microscopy (STORM) (Wu et al., 2013), which is not the focus in this study.
Fig. 2.
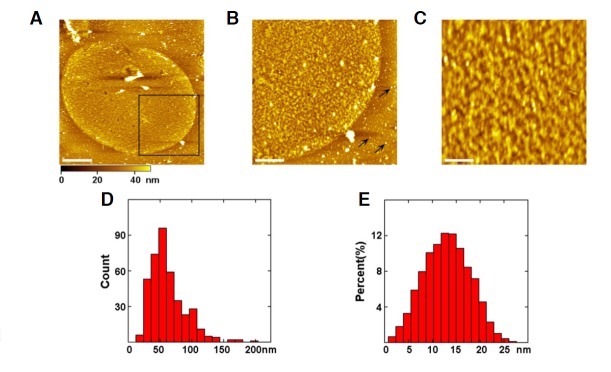
Characterization of the protein-covered inner leaflet of the turtle erythrocyte membranes. (A) AFM topographic image of the inner membrane leaflet. (B) Magnification of the square area in (A). Arrows point to proteins on the substrate. (C) High-resolution image of the inner membrane leaflet. The average height and roughness of the membranes are 18.5 ± 2.4 nm and 4.0 ± 0.8 nm, respectively. (D) The diameter distribution of proteins in the inner membrane leaflet varies from 15 to 200 nm with 70% falling between 40 and 80 nm. (E) The height of proteins above the membrane is from 1.0 to 27.0 nm with the peak at 10–16 nm. Scale bars; 5 μm in (A); 2 μm in (B); 500 nm in (C).
Digestion of the inner leaflets of erythrocyte membranes by proteinase K
To explore how the proteins and the lipid bilayer of turtle erythrocyte membranes are arranged at the molecular level, we treated the prepared inner membrane leaflet by proteinase K that can digest most of the membrane proteins. The topography of the digested inner membrane leaflet indicates many proteins have been removed, and that only separated peptides or proteins (bright dots) are visible right above the lipid bilayer (Figs. 3A and 3B). There are more free lipid bilayers (indicated by arrows) at the edge of the membranes due to the removal of membrane proteins. Figure 3C is a cross-sectional analysis along the line in Fig. 3B, in which the lipid bilayer (single arrow) is readily discernible just below the undigested proteins (double arrows). This provides additional evidence for the arrangement of proteins above the lipid bilayer. The height (thickness) of the lipid bilayer is 2.5 ± 0.5 nm, which is in complete accordance with previous value measured with AFM (Wang et al., 2010). The height distribution of undigested proteins and peptides above the membrane is from 1.5 to 12.5 nm with a peak at 4–6 nm (Fig. 3D), which is distinctly lower than that of the untreated membrane (Fig. 2E).
Fig. 3.
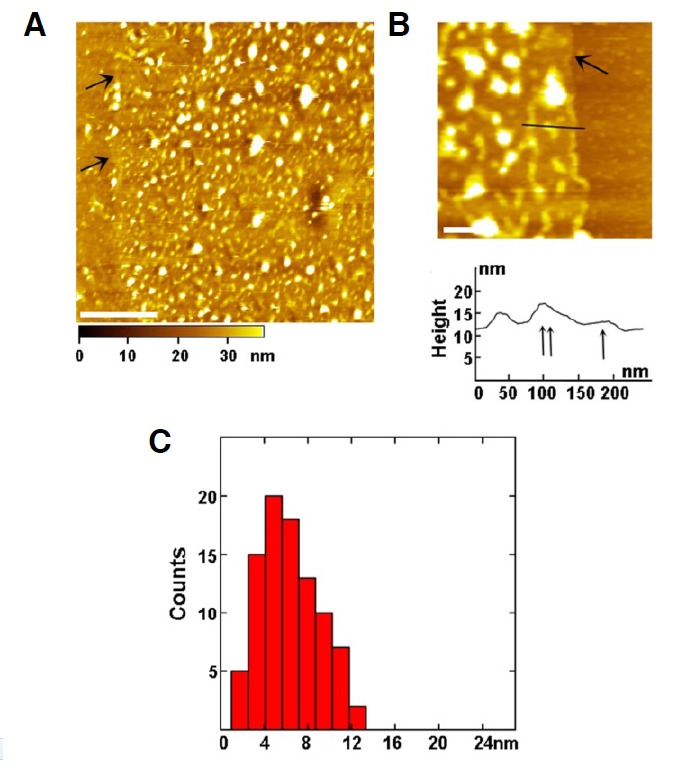
Digestion of the inner leaflet of the turtle erythrocyte membranes by proteinase K. (A) AFM topographic image of the digested membrane. (B) (Top) High-resolution image of the edge of the digested membrane. Arrows point to the exposed lipid bilayer after digestion (2.5 ± 0.5 nm, thickness). The bottom is the cross-sectional analysis along the black line with single arrow pointing to the lipid bilayer and double arrows pointing to the remaining proteins or peptides. (C) The height distribution of proteins in the membrane after digestion is from 1.5 to 12.5 nm with the peak at 4–6 nm. Scale bars; 2 μm in (A); 200 nm in (B).
Asymmetric distribution of amino groups in the inner and outer leaflets of erythrocyte membranes
To confirm the location of proteins in the inner and outer leaflets of the turtle erythrocyte membranes, single-molecule force spectroscopy was employed to detect the exposed amino groups of membrane proteins. This required the AFM tips to be functionalized with glutaraldehyde that has aldehyde groups that bind to exposed amino groups. The binding is detected during the force curve measurement. A typical force curve, among thousands of force curves acquired at various positions on the outer surface of turtle erythrocyte, is shown in Fig. 4A. There is no detectable binding event during retraction of the AFM tip from the membrane surface, which indicates that there are no exposed amino groups on the outer leaflet of erythrocyte membranes. A representative force curve obtained on the inner membrane leaflet (Fig. 4B) displays multiple force peaks during retraction, indicating vast quantities of exposed amino groups on the inner leaflet of erythrocyte membranes. During force spectroscopy measurements, the loading rate is 10.4 nN/s. The binding probability (number of force curves with the specific unbinding events divided by the total number of force curves) is 86.2% and 2.3% for the inner and outer leaflets of erythrocyte membranes, respectively. After proteinase K digestion of the membrane proteins in the inner leaflet by Proteinase K, no force event (Fig. 4B, inset) occurs when engaging force measurement on the digested membrane, and the binding probability decreases to 8.3%. Taken together, these results demonstrate that a large number of proteins are present on the inner leaflet of turtle erythrocyte membranes, while fewer proteins are exposed on the outer leaflet of erythrocyte membranes. This is because most proteins on the outer leaflet of the erythrocyte membranes are glycosylated (Gao et al., 2013; Sage and Vazquez, 1967) and distributed in a semi-mosaic pattern with no exposed amino groups.
Fig. 4.
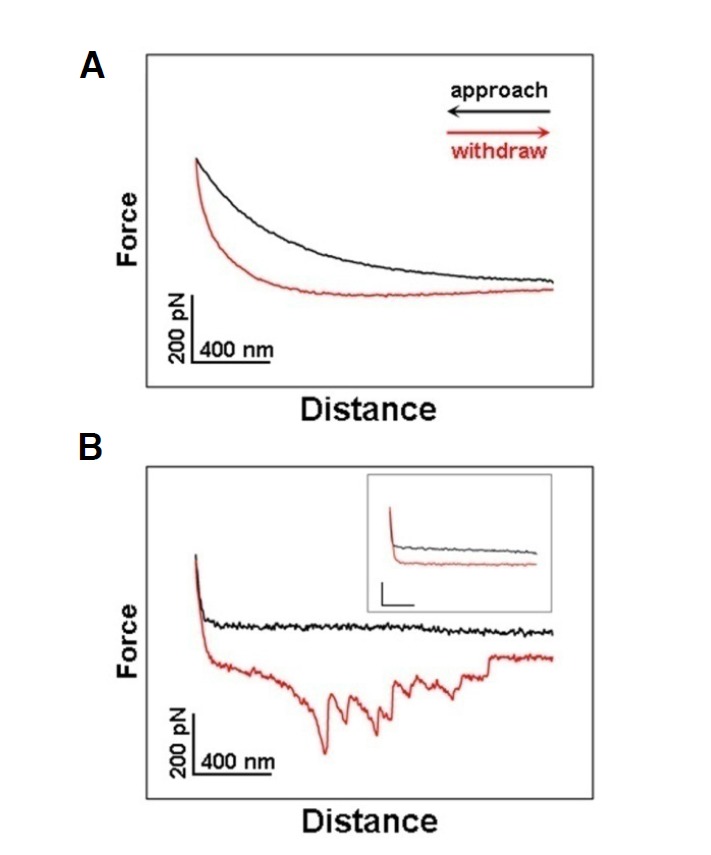
Detection of exposed amino groups on both leaflets of the turtle erythrocyte membranes. (A) The typical force curves acquired with a glutaraldehyde-functionalized AFM tip on the outer membrane leaflet, in which no force peak was observed (binding probability, 2.3%). (B) Representative force curves acquired on the inner membrane leaflet, showing multiple force peaks (binding probability, 86.2%). The inset shows the typical force curves obtained on the digested inner membrane leaflet (binding probability, 8.3%).
DISCUSSION
Using a combination of high-resolution AFM and single-molecule force spectroscopy, we studied the membrane structure of turtle erythrocytes in a quasi-native state. Morphologically, turtle erythrocytes share many features in common with fish and chicken erythrocytes, including the existence of the nucleus in central region with an ellipsoidal, flattened and biconvex shape. The primary differences among them are cell dimensions, which decreases from turtle, fish to chicken. Turtle erythrocytes are only slightly larger than those of the Crucian carp (Tian et al., 2014a). The difference in erythrocyte size is consistent with previous reports on erythrocyte measurements in fishes, reptiles, birds and mammals (Hartman and Lessler, 1964; Snyder and Sheafor, 1999). The membrane height of turtle erythrocytes is roughly the same as that of the Crucian carp erythrocytes, but thicker than those of the chicken and human erythrocytes (Table 1). Such differences might occur because of greater erythrocyte osmotic resistance needed for exposure to wider temperature ranges and the longer erythrocyte life spans in ectotherms relative to endotherms (Aldrich et al., 2006). It is noteworthy that the thicknesses of the lipid bilayer of these erythrocyte membranes are comparable, indicating similarity of membrane structure (Table 1).
Table 1.
Comparison of fish, turtle, chicken and human erythrocyte membranes
| Sm (μm) | Tm (nm) | Rm (nm) | Pa (%) | Tl (nm) | |||
|---|---|---|---|---|---|---|---|
|
|
|
||||||
| Inner | Outer | Inner | outer | ||||
| Fisha | (23.7 ± 3.1) × (15.2 ± 3.3) | 18.2 ± 3.0 | 3.1 ± 0.7 | 0.56 ± 0.06 | 98.5 | 6.5 | 3.5 ± 0.6 |
| Turtle | (27.5 ± 4.5) × (15.2 ± 1.5) | 18.5 ± 2.4 | 4.0 ± 0.8 | 0.52 ± 0.11 | 86.2 | 2.3 | 2.5 ± 0.5 |
| Chickenb | (14.2 ± 3.0) × (8.9 ± 1.6) | 16.5 ± 3.6 | 3.4 ± 0.8 | 0.47 ± 0.05 | 86.4 | 3.8 | 3.1 ± 0.7 |
| Humanc | 8 | 10 | 1.9 | 0.18 | - | - | 2.9 ± 0.4 |
Sm, size of the erythrocyte; Tm, thickness of the membrane; Rm, the average roughness of the membrane; Pa, percentage of exposed amino groups in the membrane; Tl, thickness of the lipid bilayer;
data from Tian et al. (2014a);
data from Tian et al. (2014b);
data from Wang et al. (2010)
The most prominent similarity among these erythrocyte membranes is the asymmetric distribution of proteins; i.e., there are many more proteins on the inner leaflet than on the outer leaflet. The turtle erythrocyte membranes were revealed by high resolution AFM to be quite smooth without obvious proteins on the outer leaflet, whereas rough with dense proteins on the inner leaflet. This asymmetry of protein distribution is verified by single-molecule force spectroscopy that detected many more exposed amino groups of membrane proteins in the inner membrane leaflet but only a few in the outer leaflet. The asymmetric membrane structure of turtle erythrocytes corresponds well with the semi-mosaic model of human, chicken and fish erythrocyte membrane structure. Thus, the semi-mosaic model of erythrocyte membrane structure was further extended, from mammalian, birds, fishes to reptiles, and even more species. To date, it is reasonable to believe that the widespread asymmetry of membrane structure is the basic principle of the membrane organization in all animal erythrocytes.
Acknowledgments
This work was supported by Ministry of Science and Technology of China (MOST, 2011CB933600), National Natural Science Foundation of China (NSFC, 21373200, 31330082, 21203177), Foundation of Science and Technology Department of Jilin Province (20100523).
REFERENCES
- Adams P.G., Cadby A.J., Robinson B., Tsukatani Y., Tank M., Wen J., Blankenship R.E., Bryant D.A., Hunter C.N. Comparison of the physical characteristics of chlorosomes from three different phyla of green phototrophic bacteria. Biochim. Biophys. Acta. 2013;1827:1235–1244. doi: 10.1016/j.bbabio.2013.07.004. [DOI] [PubMed] [Google Scholar]
- Aldrich K.J., Saunders D.K., Sievert L.M., Sievert G. Comparison of erythrocyte osmotic fragility among amphibians, reptiles, birds and mammals. Transac. KS Acad. Sci. 2006;109:149–158. [Google Scholar]
- Bandorowicz-Pikula J., Wos M., Pikula S. Participation of annexins in signal transduction, regulation of plasma membrane structure and membrane repair mechanisms. Postepy. Biochem. 2012;58:135–148. [PubMed] [Google Scholar]
- Bhattacharyya K., Guha T., Bhar R., Ganesan V., Khan M., Brahmachary R.L. Atomic force microscopic studies on erythrocytes from an evolutionary perspective. Anat. Rec. A Discov. Mol. Cell. Evol. Biol. 2004;279:671–675. doi: 10.1002/ar.a.20057. [DOI] [PubMed] [Google Scholar]
- Cai M., Zhao W., Shang X., Jiang J., Ji H., Tang Z., Wang H. Direct evidence of lipid rafts by in situ atomic force microscopy. Small. 2012;8:1243–1250. doi: 10.1002/smll.201102183. [DOI] [PubMed] [Google Scholar]
- Chiari Y., Cahais V., Galtier N., Delsuc F. Phylogenomic analyses support the position of turtles as the sister group of birds and crocodiles (Archosauria) BMC Biol. 2012;10:65. doi: 10.1186/1741-7007-10-65. [DOI] [PMC free article] [PubMed] [Google Scholar]
- Coiro J.R., Brunner A., Mitsutani C.Y., Weisz V.M., Fiori A.M. The marginal band and its role in the ellipsoidal shape of Geochelone carbonaria erythrocytes. Arch. Anat. Microsc. Morphol. Exp. 1978;67:133–143. [PubMed] [Google Scholar]
- Drew C., Ball V., Robinson H., Ellory J.C., Gibson J.S. Oxygen sensitivity of red cell membrane transporters revisited. Bioelectrochemistry. 2004;62:153–158. doi: 10.1016/j.bioelechem.2003.07.003. [DOI] [PubMed] [Google Scholar]
- Euteneuer U., Ris H., Borisy G.G. Polarity of marginal-band microtubules in vertebrate erythrocytes. Eur. J. Cell. Biol. 1985;37:149–155. [PubMed] [Google Scholar]
- Ferlazzo A.M., Bruschetta G., Di Pietro P., Medica P., Notti A., Rotondo E. Phospholipid composition of plasma and erythrocyte membranes in animal species by P-31. NMR. Vet. Res. Commun. 2011;35:521–530. doi: 10.1007/s11259-011-9496-4. [DOI] [PubMed] [Google Scholar]
- Gao J., Li J., Feng C., Hu Z., Liu W., Liang S., Yin D. Isolation technique and proteomic analysis of the erythrocyte ghosts of red-eared turtle (Trachemys scripta) Electrophoresis. 2013;34:215–223. doi: 10.1002/elps.201200243. [DOI] [PubMed] [Google Scholar]
- Gupta V.K., Neeves K.B., Eggleton C.D. Effect of viscoelasticity on the analysis of single-molecule force spectroscopy on live cells. Biophys. J. 2012;103:137–145. doi: 10.1016/j.bpj.2012.05.044. [DOI] [PMC free article] [PubMed] [Google Scholar]
- Hagerstrand H., Danieluk M., Bobrowska-Hagerstrand M., Holmstrom T., Kralj-Iglic V., Lindqvist C., Nikinmaa M. The lamprey (Lampetra fluviatilis) erythrocyte; morphology, ultra-structure, major plasma membrane proteins and phospholipids, and cytoskeletal organization. Mol. Membr. Biol. 1999;16:195–204. doi: 10.1080/096876899294661. [DOI] [PubMed] [Google Scholar]
- Hao X., Zhu N., Gschneidtner T., Jonsson E.Ö., Zhang J., Moth-Poulsen K., Wang H., Thygesen K.S., Jacobsen K.W., Ulstrup J., et al. Direct measurement and modulation of single-molecule coordinative bonding forces in a transition metal complex. Nat. Commun. 2013;4:2121. doi: 10.1038/ncomms3121. [DOI] [PubMed] [Google Scholar]
- Hartman F.A., Lessler M.A. Erythrocyte measurements in fishes amphibia, and reptiles. Biol. Bull. 1964;126:83–88. [Google Scholar]
- Hinterdorfer P., Baumgartner W., Gruber H.J., Schilcher K., Schindler H. Detection and localization of individual antibody-antigen recognition events by atomic force microscopy. Proc. Natl. Acad. Sci. USA. 1996;93:3477–3481. doi: 10.1073/pnas.93.8.3477. [DOI] [PMC free article] [PubMed] [Google Scholar]
- Jiang J., Hao X., Cai M., Shan Y., Shang X., Tang Z., Wang H. Localization of Na+-K+ATPases in quasi-native cell membranes. Nano Lett. 2009;9:4489–4493. doi: 10.1021/nl902803m. [DOI] [PubMed] [Google Scholar]
- Keren K. Cell motility: the integrating role of the plasma membrane. Eur. Biophys. J. 2011;40:1013–1027. doi: 10.1007/s00249-011-0741-0. [DOI] [PMC free article] [PubMed] [Google Scholar]
- Kong F., Li Z., Parks W.M., Dumbauld D.W., Garcia A.J., Mould A.P., Humphries M.J., Zhu C. Cyclic mechanical reinforcement of integrin-ligand interactions. Mol. Cell. 2013;49:1060–1068. doi: 10.1016/j.molcel.2013.01.015. [DOI] [PMC free article] [PubMed] [Google Scholar]
- Medalsy I., Hensen U., Muller D.J. Imaging and quantifying chemical and physical properties of native proteins at molecular resolution by force-volume AFM. Angew. Chem. In. Ed. 2011;50:12103–12108. doi: 10.1002/anie.201103991. [DOI] [PubMed] [Google Scholar]
- Morgan D.A., Class R., Violetta G., Soslau G. Cytokine mediated proliferation of cultured sea turtle blood cells: Morphologic and functional comparison to human blood cells. Tissue Cell. 2009;41:299–309. doi: 10.1016/j.tice.2008.12.004. [DOI] [PubMed] [Google Scholar]
- Muller D.J. AFM: a nanotool in membrane biology. Biochemistry. 2008;47:7986–7998. doi: 10.1021/bi800753x. [DOI] [PubMed] [Google Scholar]
- Sage H.J., Vazquez J.J. Studies on a hemagglutinin from the mushroom Agaricus campestris. J. Biol. Chem. 1967;242:120–125. [PubMed] [Google Scholar]
- Simons K., Ikonen E. Functional rafts in cell membranes. Nature. 1997;387:569–572. doi: 10.1038/42408. [DOI] [PubMed] [Google Scholar]
- Singer S.J., Nicolson G.L. Fluid mosaic model of structure of cell-membranes. Science. 1972;175:720–731. doi: 10.1126/science.175.4023.720. [DOI] [PubMed] [Google Scholar]
- Snyder G.K., Sheafor B.A. Red blood cells: Centerpiece in the evolution of the vertebrate circulatory system. Amer. Zool. 1999;39:189–198. [Google Scholar]
- Stabenau E.K., Vanoye C.G., Heming T.A. Characteristics of the anion transport system in sea turtle erythrocytes. Am. J. Phys. 1991;261:1218–1225. doi: 10.1152/ajpregu.1991.261.5.R1218. [DOI] [PubMed] [Google Scholar]
- Sumino A., Sumikama T., Iwamoto M., Dewa T., Oiki S. The open gate structure of the membrane-embedded kcsa potassium channel viewed from the cytoplasmic side. Sci. Rep. 2013;3:1063. doi: 10.1038/srep01063. [DOI] [PMC free article] [PubMed] [Google Scholar]
- Suzuki Y., Sakai N., Yoshida A., Uekusa Y., Yagi A., Imaoka Y., Ito S., Karaki K., Takeyasu K. High-speed atomic force microscopy combined with inverted optical microscopy for studying cellular events. Sci. Rep. 2013;3:2131. doi: 10.1038/srep02131. [DOI] [PMC free article] [PubMed] [Google Scholar]
- Tian Y., Li J., Cai M., Zhao W., Xu H., Liu Y., Wang H. High resolution imaging of mitochondrial membranes by in situ atomic force microscopy. RSC Adv. 2013;3:708–712. [Google Scholar]
- Tian Y., Cai M., Zhao W., Wang S., Qin Q., Wang H. The asymmetric membrane structure of erythrocytes from Crucian carp studied by atomic force microscopy. Chin. Sci. Bull. 2014a;59:2582–2587. [Google Scholar]
- Tian Y., Cai M., Xu H., Wang H. Studying the membrane structure of chicken erythrocytes by in situ atomic force microscopy. Anal. Methods [in press]. 2014b [Google Scholar]
- Vereb G., Szollosi J., Matko J., Nagy P., Farkas T., Vigh L., Matyus L., Waldmann T. A., Damjanovich S. Dynamic, yet structured: the cell membrane three decades after the Singer-Nicolson model. Proc. Nat.l Acad. Sci. USA. 2003;100:8053–8058. doi: 10.1073/pnas.1332550100. [DOI] [PMC free article] [PubMed] [Google Scholar]
- Wang H., Hao X., Shan Y., Jiang J., Cai M., Shang X. Preparation of cell membranes for high resolution imaging by AFM. Ultramicroscopy. 2010;110:305–312. doi: 10.1016/j.ultramic.2009.12.014. [DOI] [PubMed] [Google Scholar]
- Werneburg I., Sanchez-Villagra M.R. Timing of organogenesis support basal position of turtles in the amniote tree of life. BMC Evol. Biol. 2009;9:82. doi: 10.1186/1471-2148-9-82. [DOI] [PMC free article] [PubMed] [Google Scholar]
- Wu J., Gao J., Qi M., Wang J., Cai M., Liu S., Hao X., Jiang J., Wang H. High-efficiency localization of Na+-K+ ATPases on the cytoplasmic side by direct stochastic optical reconstruction microscopy. Nanoscale. 2013a;5:11582–11586. doi: 10.1039/c3nr03665k. [DOI] [PubMed] [Google Scholar]
- Wu J., Hao X., Wang Z., Cai M., Wang H. Tracking hepatitis B virus-like vesicles in living cells. Chem. Rapid Commun. 2013b;1:27–30. [Google Scholar]
- Xu H., Su W., Cai M., Jiang J., Zeng X., Wang H. The asymmetrical structure of Golgi apparatus membranes revealed by in situ atomic force microscope. PLoS One. 2013;8:e61596. doi: 10.1371/journal.pone.0061596. [DOI] [PMC free article] [PubMed] [Google Scholar]
- Zhao W., Tian Y., Cai M., Wang F., Wu J., Gao J., Liu S., Jiang J., Jiang S., Wang H. Studying the nucleated mammalian cell membrane by single molecule approaches. PLoS One. 2014;9:e91595. doi: 10.1371/journal.pone.0091595. [DOI] [PMC free article] [PubMed] [Google Scholar]
- Ziegler U., Vinckier A., Kernen P., Zeisel D., Biber J., Semenza G., Murer H., Groscurth P. Preparation of basal cell membranes for scanning probe microscopy. FEBS Lett. 1998;436:179–184. doi: 10.1016/s0014-5793(98)01118-1. [DOI] [PubMed] [Google Scholar]