

Abstract
PURPOSE: This study aims to investigate whether the uptake of 2-(2-nitro-1H-imidazol-1-yl)-N-(2,2,3,3,3-pentafluoropropyl)-acetamide ([18F]EF5) and 2-deoxy-2-[18F]fluoro-d-glucose ([18F]FDG) is associated with a hypoxia-driven adverse phenotype in head and neck squamous cell carcinoma cell lines and tumor xenografts. METHODS: Xenografts were imaged in vivo, and tumor sections were stained for hypoxia-inducible factor 1α (Hif-1α), carbonic anhydrase IX (CA IX), and glucose transporter 1 (Glut-1). Tracer uptakes and the expression of Hif-1α were determined in cell lines under 1% hypoxia. RESULTS: High [18F]EF5 uptake was seen in xenografts expressing high levels of CA IX, Glut-1, and Hif-1α, whereas low [18F]EF5 uptake was detected in xenografts expressing low amounts of CA IX and Hif-1α. The uptake of [18F]EF5 between cell lines varied extensively under normoxic conditions. A clear correlation was found between the expression of Hif-1α and the uptake of [18F]FDG during hypoxia. CONCLUSIONS: The UT-SCC cell lines studied differed with respect to their hypoxic phenotypes, and these variations were detectable with [18F]EF5. Acute hypoxia increases [18F]FDG uptake in vitro, whereas a high [18F]EF5 uptake reflects a more complex phenotype associated with hypoxia and an aggressive growth pattern.
Introduction
Imaging of tumor hypoxia using 2-nitroimidazoles has increased during recent years. For a number of cancers, including head and neck squamous cell carcinomas (HNSCCs), radiotherapy (RT) may fail due to the presence of tumor hypoxia [1]. However, before imaging of hypoxic tumors can be employed for hypoxia-directed treatment strategies, the biologic significance of imaging data needs to be validated [2]. This molecular information may be useful for planning RT, as well as in drug development. Image-guided radiotherapy is routinely implemented to reduce safety margins associated with delineation of clinical target volume, but it is also necessary to irradiate biologically relevant subvolumes within the tumor [3]. In view of the heterogeneity of tumor tissue, it is hoped that this targeted irradiation can improve the survival prospects of patients with cancer.
The microenvironmental homeostasis in tumors is disrupted, and several metabolic changes, such as gradients of oxygen, glucose, lactate, and H+ ions, develop at the microregional level [4]. Hence, tumor cells must survive in this hypoxic environment and the acidic surroundings, both of which are currently considered as hallmarks of cancer [5]. Hypoxic cells are able to adapt to the demanding environments by activating hypoxia-inducible factor 1 (Hif-1), a heterodimer consisting of α and β-subunits [6], [7]. Hif-1 activates the transcription of many genes, for example, those involved in angiogenesis, glycolysis [e.g., glucose transporters (GLUTs)], pH maintenance [e.g., carbonic anhydrases (CAs)], and proliferation [8], [9]. In summary, the activation of Hif-1 helps cells to adapt to an environment with a low-oxygen level. CAs are a family of proteins that catalyze reversibly the hydration of the carbon dioxide to carbonic acid, and thus help cells to survive in an acidic environment [10]. CA isoform 9 (CA IX) is found in many aggressive tumors, including HNSCC, and has been associated with poor treatment outcomes [11], [12]. The acidic microenvironment can also trigger nonhypoxic cells to use glycolysis as their primary energy source [13]. Glucose is transported into cells by GLUTs, which are overexpressed in many cancers, including HNSCC [14]. Higher Glut-1 expression has been shown to correlate with a poorer survival in many cancers [14], [15], although contradictory results on the correlation between Glut-1 expression and the uptake of 2-deoxy-2-[18F]fluoro-d-glucose ([18F]FDG) have been reported [16].
Hypoxia imaging with positron emission tomography (PET) is usually based on 18F-labeled 2-nitroimidazole compounds [17]. We have earlier evaluated the hypoxia tracer 2-(2-nitro-1H-imidazol-1-yl)-N-(2,2,3,3,3-pentafluoropropyl)-acetamide ([18F]EF5) in patients with HNSCC [18]. In this study, the uptake of [18F]EF5 and [18F]FDG into primary tumors and cervical lymph node metastases was found to be heterogeneous. Previous studies using unlabeled EF5 have described a correlation between hypoxia and tumor aggressiveness [19], [20]. Understanding the relationship between oxygen and glucose metabolism is crucial for the planning of hypoxia-directed therapies, such as biologically guided RT. Therefore, these findings encouraged us to investigate in detail whether a certain molecular profile might affect [18F]EF5 and [18F]FDG uptake in HNSCC.
We studied the in vivo uptake of [18F]EF5 and [18F]FDG in xenografts from UT-SCC cell lines. We also evaluated the in vitro accumulation of these tracers in the same cell lines. Finally, we investigated the association between these PET tracers and biologic markers commonly considered to be related to [18F]EF5 and [18F]FDG uptake or to the tumorigenesis of HNSCC.
Materials and Methods
[18F]EF5 and [18F]FDG Production
[18F]EF5 was synthesized from 2-(2-nitro-1H-imidazol-1-yl)-N-(2,3,3-trifluoroallyl)-acetamide using high-specific activity [18F]F2 ([18F]fluorine gas) as the labeling reagent [21]. The specific activity of [18F]EF5, decay corrected to the end of synthesis, exceeded 3.7 GBq/μmol. Radiochemical purity was higher than 98.5% in every production batch.
[18F]FDG was synthesized from mannosyl triflate using a nucleophilic method. The radiochemical purity exceeded 95% in every production batch.
Cell Lines and Cell Culture
Four primary cell lines (Table 1) derived from human HNSCC and originating from the UT-SCC collection were kindly provided by Prof Reidar Grénman. Cells were routinely cultured in Dulbecco's modified Eagle's medium (Gibco®, Thermo Scientific, Waltham, MA, USA) containing l-glutamine (Gibco), nonessential amino acids (Gibco), streptomycin, penicillin (Gibco), and 10% FBS (Gibco) at 37°C in a humidified atmosphere containing 5% CO2.
Table 1.
Origin of the UT-SCC Cell Lines.
| Cell Line | Primary Tumor |
|||
|---|---|---|---|---|
| Location | Sex | TNM | Grade | |
| UT-SCC-8 | Supraglottic larynx | M | T2N0M0 | G1 |
| UT-SCC-25 | Mobile tongue | M | T2N0M0 | G1 |
| UT-SCC-34 | Supraglottic larynx | M | T4N0M0 | G1 |
| UT-SCC-74A | Mobile tongue | M | T3N1M0 | G1-G2 |
Animals and Tumor Models
Male nude mice (Athymic nu/nu; Harlan Laboratories, Horst, The Netherlands), weighing 33.1 (29.0-37.1) g, were used to establish xenografts from UT-SCC-8, UT-SCC-25, UT-SCC-34, and UT-SCC-74A HNSCC cell lines. Mice were irradiated with 4 Gy (3 Gy/min) 1 day before tumor transplantation to reduce their immunity. Depending on the cell line, 1 to 10 × 106 cells were subcutaneously injected into the flank of each mouse. Throughout this study, cell line passage numbers were kept as low as possible (p6-p40). Mice were maintained in individually ventilated animal cages under controlled pathogen-free environmental conditions (21°C, humidity = 55 ± 5%, and lights on from 6:00 A.M. to 6:00 P.M.) with free access to water and standard food. Animals were observed on daily basis, and tumor sizes were measured weekly (V = (π/6) × a × c × b). The experimental procedures were reviewed by the local Ethics Committee on Animal Experimentation at the University of Turku and approved by the Provincial State Office of Western Finland.
In vivo Imaging of Xenografts
Mice (n = 3 per cell line) bearing tumors with an average size of 406 (105-685) mm3 were anesthetized with 2.5% isoflurane, and body temperature was maintained using a heating pad. Following a transmission scan for attenuation correction using the computer thomography (CT) modality, an emission scan was acquired in three-dimensional list mode (Inveon; Siemens Medical Solutions, Knoxville, TN, USA).
Mice were injected with 11.6 (9.1-14.0) MBq of [18F]EF5 or 12.1 (10.7-13.3) MBq of [18F]FDG into a tail vein on consecutive days. Dynamic 80-minute–long scans were acquired. Sinograms were framed into 25 frames (6 × 10 seconds, 4 × 15 seconds, 2 × 30 seconds, 2 × 120 seconds, 1 × 180 seconds, 6 × 300 seconds, and 4 × 600 seconds) and reconstructed with an ordered subset expectation maximation (OSEM) two-dimensional iterative algorithm. Images were summed from 60 to 80 minutes, and volumes of interest were drawn over whole tumors with Inveon Research Workplace image analysis software 4.1 (Siemens Medical Solutions), using the CT template as an anatomic reference. Radioactivity uptake was calculated as the percentage of injected dose per gram tissue (%ID/g) in whole tumor.
Expression of CA IX, Glut-1, and Hif-1α in Xenografts
After PET/CT scans, mice were killed, tumors were collected, and paraffin-embedded tumor sections were stained with antibodies raised against CA IX (ab15086; Abcam, Cambridge, UK, 1:8000), Glut-1 (GT12-A; Immune Diagnostics and Research, Hämeenlinna, Finland, 1:1000), and Hif-1α (610959; BD Transduction Laboratories, Franklin Lakes, NJ, USA, 1:100). Immunostaining was performed as described previously [11]. The expressions of CA IX, Glut-1, and Hif-1α were visually analyzed from 10 different areas in each tumor section using a × 20 microscope objective. The percentage of positively stained tumor cells was counted, and staining intensity was described as weak (1), moderate (2), or strong (3). Each tumor was scored (range = 0-300) by multiplying the average intensity value by the average percentage of positively stained cells. Analyses were performed independently by two investigators (J.S. and K.K.).
In vitro Uptake of Tracers in Cell Lines
Digital autoradiography was used to measure the uptake of [18F]EF5 and [18F]FDG in cell lines grown on eight-well chamber slides (Nunc™, Thermo Scientific, Waltham, MA, USA) under normoxia and different time periods of hypoxia (1% O2). Four days before tracer incubation, cells were plated onto chamber slides in duplicate (two wells per cell line) and cultured under normal culturing conditions. Medium was changed on the third day. Cells were seeded at various densities according to their growth rates to ensure that there would be equal amount of cells at the time of tracer incubation. On day 4, one chamber slide per time point was transferred to a hypoxia workstation (Invivo2; Ruskinn Technology Ltd, Pencoed, United Kingdom) at 24, 12, 6, 3, and 1 hour before the end of tracer incubation time. Chambers were removed, and slides were washed with phosphate-buffered saline before being incubated with [18F]EF5 or [18F]FDG for 60 or 30 minutes, respectively, in 50 kBq/ml Dulbecco's modified Eagle's medium ([18F]EF5) or physiological saline ([18F]FDG) under hypoxia. The workstation and all solutions used were stabilized in 1% O2 before the experiment. Control cells were incubated with tracers under normal culture conditions (normoxia, 0 hour). Cells were then washed with phosphate-buffered saline and fixed in 4% paraformaldehyde for 10 minutes at room temperature. Air-dried slides were exposed with an imaging plate (BAS-TR2025; Fuji Photo Film Co, Tokyo, Japan) for 4 hours before scanning with the Fuji Analyzer FLA-5100.
Images were analyzed for count density [photostimulated luminescence (PSL) per unit area] with a computerized image analysis program (AIDA Image Analyzer version 4.22; Raytest Isotopenmessgeräte, Straubenhardt, Germany). A square-sized region of interest was drawn over each chamber containing cultured cells, and the background was subtracted from the image data. Data were normalized to the total amount of radioactivity used in each experiment.
Hif-1α Expression in Cell Lines
Cells were cultured in six-well plates (Nunc) in a hypoxic workstation (Invivo2; Ruskinn Technology Ltd) under 1% O2 at 37°C for 1, 3, 6, 12, and 24 hours. Control cells were cultured in 21% O2 at 37°C (normoxia, 0 hour). Cells were harvested by adding 200 μl of sodium dodecyl sulfate (SDS)–Triton lysis buffer [50 mM Tris (pH 7.5), 150 mM NaCl, 0.5% Triton X-100 (TX-100), 5% glycerol, 1% SDS, and a complete protease inhibitor tablet]. Total cellular protein concentrations were determined using the bicinchoninic acid assay method (BCA Protein Assay Kit; Pierce™, Thermo Scientific, Waltham, MA, USA) before addition of SDS buffer. Equal amounts of protein were separated on a 10% SDS–polyacrylamide gel electrophoresis and blotted onto a polyvinylidene fluoride (PVDF) membrane (Bio-Rad Laboratories, Hercules, CA, USA). Proteins were detected by Western blot analysis and enhanced chemiluminescence with Hif-1α antibody (610959; BD Transduction Laboratories, 1:3000). β-Actin was used as a loading control (Ac-74; Sigma-Aldrich, St. Louis, MO, USA 1:3000).
Statistics
Descriptive statistics for the data are presented as arithmetic means and range. Mean levels of [18F]EF5 and [18F]FDG (tumor uptake), membranous CA IX, membranous Glut-1, and nuclear Hif-1α scores were compared between groups (UT-SCC-8, UT-SCC-34, and UT-SCC-74A) with one-way analysis of variance (ANOVA). Likewise, mean levels of [18F]EF5 (in vitro uptake) were compared between UT-SCC-8, UT-SCC-25, UT-SCC-34, and UT-SCC-74A. In addition, pairwise comparison between groups was performed with Tukey test. Pearson correlation coefficient was calculated between [18F]FDG uptake and Hif-1α expression for each group separately. All tests were performed as two sided with a 0.05 significance level. In addition, P values less than .10 were reported as a trend toward significance. The analyses were done with SAS System (version 9.3 for Windows) (SAS Institute, Cary, NC, USA).
Results
Uptake of [18F]EF5 and [18F]FDG in Xenografts
Xenografts derived from UT-SCC-25 cells did not grow in nude mice. The uptake of [18F]EF5 and [18F]FDG in individual xenografts induced from UT-SCC-8, UT-SCC-34, and UT-SCC-74A cell lines is shown in Figure 1A. The uptake of both tracers reached equilibrium in tumors after 20 minutes (Figure 1B). Representative PET images of [18F]EF5 and [18F]FDG uptake are shown in Figure 1C. The uptake of [18F]EF5 in UT-SCC-8 tumors was 0.87 (0.68-0.99) %ID/g and showed a trend toward a significantly lower (P = .091) uptake than the [18F]EF5 uptake in UT-SCC-34 tumors [2.2 (1.4-2.7) % ID/g]. The uptake in UT-SCC-74A tumors was also higher [1.9 (1.1-2.7)%ID/g] than in UT-SCC-8 xenografts, although not statistically significantly (P = .194). The uptake of [18F]FDG in UT-SCC-34 and UT-SCC-74A xenografts was higher than in UT-SCC-8 xenografts [2.2 (1.7-3.1)%ID/g versus 2.1 (1.4-2.7) %ID/g versus 1.5 (1.3-1.6) %ID/g, respectively], even though the difference did not achieve statistical significance.
Figure 1.
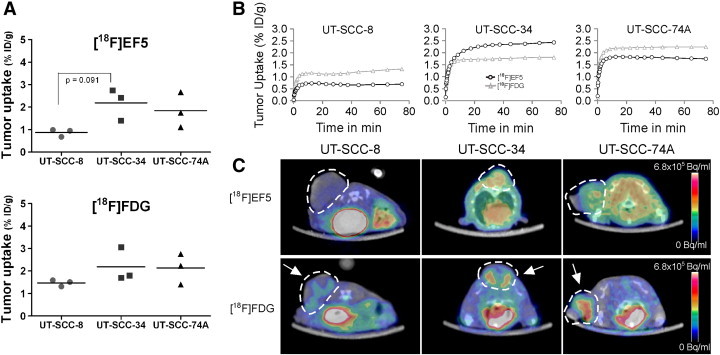
(A) [18F]EF5 and [18F]FDG uptake (summed at 60-80 minutes post injection (p.i.)) in xenografts induced from UT-SCC-8 (n = 3), UT-SCC-34 (n = 3), and UT-SCC-74A (n = 3) cell lines. UT-SCC-25 cells did not form xenografts. A trend toward significantly lower (P = .091) [18F]EF5 uptake was seen in UT-SCC-8 xenografts compared to UT-SCC-34 xenografts. (B) Time activity curves for [18F]EF5 (black line) and [18F]FDG (grey line) uptake show that equilibrium of both tracers was achieved at 20 minutes p.i. (C) Representative axial images show tumor uptake of [18F]EF5 and [18F]FDG in xenografts. Tumors are marked with dotted lines and arrows.
Expression of CA IX, Glut-1, and Hif-1α in Xenografts
Representative images and mean scores of CA IX, Glut-1, and Hif-1α expression in xenografts of UT-SCC-8, UT-SCC-34, and UT-SCC-74A cell lines are illustrated in Figure 2. Percentages of positive stained tumor cells and staining intensities of individual UT-SCC xenografts are listed in Table 2. One-way ANOVA revealed differences between the cell lines for CA IX and Hif-1α expression (P = .046 and P = .014, respectively), whereas there were no significant differences between the cell lines in the levels of Glut-1 expression (P = .147).
Figure 2.
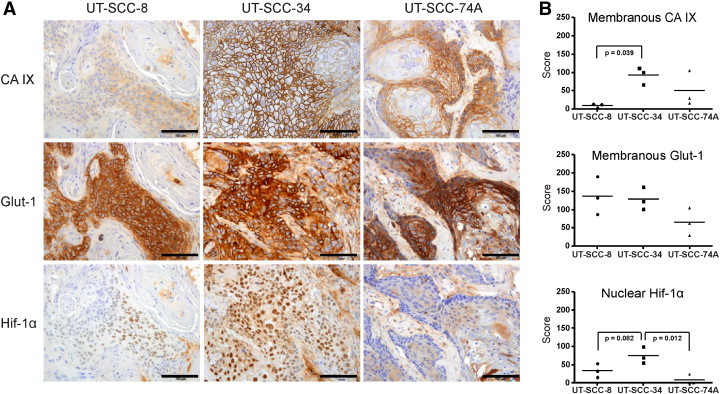
(A) Representative images of CA IX, Glut-1, and Hif-1α expression in UT-SCC xenografts. (B) Scores (positive cells × staining intensity) for CA IX, Glut-1, and Hif-1α expression in UT-SCC-8 (n = 3), UT-SCC-34 (n = 3), and UT-SCC-74A (n = 3) xenografts. A significantly lower (P = .039) membranous CA IX expression was detected in UT-SCC-8 xenografts compared with UT-SCC-34 xenografts. The expression of membranous Glut-1 did not significantly differ between cell lines. Nuclear expression of Hif-1α was significantly lower (P = .012) in UT-SCC-74A, whereas a trend toward a lower (P = .082) expression was seen in UT-SCC-8, compared to UT-SCC-34 xenografts. Scale bar, 100 μm.
Table 2.
Percentage of Positive Stained Tumor Cells, Staining Intensities and Total Scores of CA IX, Glut-1, and Hif-1α Expression in UT-SCC Xenografts (n = 3 per Cell Line).
| Xenografts | Positive Tumor Cells (%) | Positive Tumor Cell (%) |
Score∗ | P Value† | |||
|---|---|---|---|---|---|---|---|
| Intensity | |||||||
| 1=weak | 2=moderate | 3=strong | |||||
| CA IX | UT-SCC-8 | 8 | 7 | 1 | 0 | 9 | |
| UT-SCC-34 | 52 | 22 | 21 | 9 | 92 | .046 | |
| UT-SCC-74A | 27 | 11 | 12 | 5 | 50 | ||
| Glut-1 | UT-SCC-8 | 63 | 10 | 32 | 21 | 137 | |
| UT-SCC-34 | 65 | 20 | 28 | 18 | 128 | .147 | |
| UT-SCC-74A | 30 | 7 | 11 | 12 | 65 | ||
| Hif-1α | UT-SCC-8 | 20 | 9 | 9 | 2 | 33 | |
| UT-SCC-34 | 44 | 20 | 17 | 7 | 75 | .014 | |
| UT-SCC-74A | 5 | 3 | 1 | 1 | 8 | ||
Scores were calculated by multiplying the percentage of positive stained tumor cells with corresponding intensity value (1-3) and summing the values.
P values from one-way ANOVA.
All xenografts exhibited membranous CA IX expression. In UT-SCC-8 xenografts, the mean CA IX–positive tumor cells was below 10% (Table 2). The highest CA IX scores were observed in UT-SCC-34 tumors (Figure 2B), which exhibited weak to strong staining in more than 50% of tumor cells (Table 2). In UT-SCC-74A xenografts, below 30% of tumor cells were positive for membranous CA IX (Table 2). However, UT-SCC-74A xenografts expressed more extensive variation in the proportion and staining intensity of CA IX–positive tumor cells. Total scores for CA IX in UT-SCC-8, UT-SCC-34, and UT-SCC-74A were 9 (3-13), 92 (66-111), and 50 (16-105), respectively (Figure 2B). Pairwise comparison (Tukey) between UT-SCC-8, UT-SCC-34, and UT-SCC-74A xenografts revealed significantly (P = .039) higher CA IX scores in UT-SCC-34 compared to UT-SCC-8 xenografts (Figure 2B).
All xenografts were positive for membranous Glut-1. More than 60% of cells in UT-SCC-8 xenografts were Glut-1 positive, with mostly moderate to strong staining intensities. In UT-SCC-34 xenografts, 65% of the cancer cells were Glut-1 positive, exhibiting divergent staining intensities but equal distribution within the tumors. The intensity of Glut-1–positive tumor cells was moderate to strong in UT-SCC-74A, although the overall proportion of positive cells was only 30% (Table 2). Total scores for Glut-1 in UT-SCC-8, UT-SCC-34, and UT-SCC-74A were 137 (87-190), 128 (101-162), and 65 (29-105), respectively (Figure 2B). No significant differences in Glut-1 scores were detected between the UT-SCC xenografts.
UT-SCC-34 xenografts exhibited strongest nuclear Hif-1α expression (Figure 2A). In these xenografts, more than 40% of tumor cells were positive for nuclear Hif-1α, compared with only 5% of positive tumor cells in UT-SCC-74A xenografts and 20% in UT-SCC-8 xenografts (Table 2). Total scores for Hif-1α in UT-SCC-8, UT-SCC-34, and UT-SCC-74A were 33 (15-53), 75 (55-93), and 8 (0-24), respectively (Figure 2B). Pairwise comparison between UT-SCC-8, UT-SCC-34, and UT-SCC-74A xenografts revealed significantly (P = .012) higher Hif-1α scores in UT-SCC-34 compared with UT-SCC-74A xenografts (Figure 2B), whereas the lower scores seen in UT-SCC-8 xenografts reached only marginal significance (P = .082).
Cell Line–Specific Uptake of [18F]EF5
UT-SCC-34 and UT-SCC-74A cells exhibited the highest [18F]EF5 uptake, whereas low uptake was seen in UT-SCC-25 cells (Figure 3). After 1 hour of exposure to hypoxia, [18F]EF5 uptake increased slightly in all UT-SCC cell lines. However, this uptake declined over time toward the levels detected in the normoxic conditions (Figure 3). One exception to this pattern was detected in UT-SCC-74A cells in which a higher [18F]EF5 uptake was seen at 24 hours after exposure to hypoxia in comparison to normoxic conditions. However, significantly different (P < .0001) [18F]EF5 uptake was already seen between the cell lines under normoxia, except between UT-SCC-34 and UT-SCC-74A, which showed similar high uptake.
Figure 3.
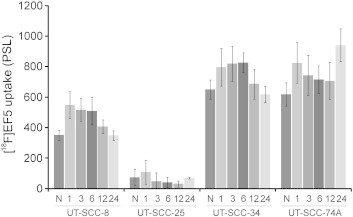
In vitro uptake of [18F]EF5 in UT-SCC-8, UT-SCC-25, UT-SCC-34, and UT-SCC-74A cell lines. Cells were grown under normoxia (N) or for increasing durations (1, 3, 6, 12, and 24 hours) of hypoxia (1% O2). Significantly different (P < .0001) [18F]EF5 uptake was seen between the cell lines under N, except between UT-SCC-34 and UT-SCC-74A, which showed similarly high uptake. Values are from three repeated experiments. PSL, photostimulated luminescence.
Association Between [18F]FDG Uptake and HIF-1α Expression
In general, the hypoxic environment increased the uptake of [18F]FDG in UT-SCC cell lines (Figure 4A). The uptake of [18F]FDG observed in UT-SCC-34 cells remained rather stable between 1 to 24 hours of hypoxia exposure. UT-SCC-8, UT-SCC-25, and UT-SCC-74A exhibited a more variable [18F]FDG uptake; UT-SCC-8 increased over time until 6 hours, and UT-SCC-74A increased in a dual-phase manner over time being greatest after 24 hours of hypoxia. UT-SCC-25 cells exhibited the least [18F]FDG uptake of the four cell lines studied.
Figure 4.
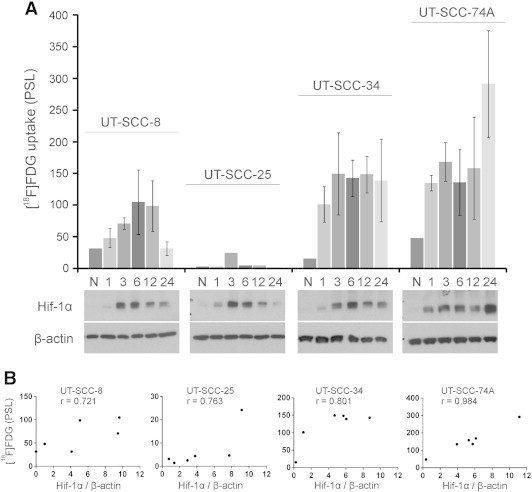
(A) In vitro uptake of [18F]FDG in UT-SCC-8, UT-SCC-25, UT-SCC-34, and UT-SCC-74A cell lines. Cells were grown under normoxia (N) or for increasing durations (1, 3, 6, 12, and 24 hours) of hypoxia (1% O2). Hypoxia exposure increased the [18F]FDG uptake in all the studied UT-SCC cell lines. This uptake correlated with the Hif-1α expression. (B) The strongest correlation was found with UT-SCC74A (r = 0.984), whereas a slightly weaker correlation was observed in UT-SCC-34 (r = 0.801), UT-SCC-25 (r = 0.763), and UT-SCC-8 (r = 0.721) cell lines. Values are from three repeated experiments, except for normoxia (n = 2) and the UT-SCC-25 cell line (n = 1). PSL, photostimulated luminescence.
Hif-1α expression was detected during hypoxia, whereas under normoxic conditions, Hif-1α expression was absent or weak (Figure 4A). The expression of Hif-1α in the UT-SCC-74A cell line deviated from the commonly observed expression pattern by exhibiting the strongest expression after 24 hours instead of at 3 to 6 hours of hypoxia. The Hif-1α expression correlated strongly with the [18F]FDG uptake in the UT-SCC-74A cell line (r = 0.984; P = .0004). This correlation was slightly weaker in UT-SCC-34 (r = 0.801; P = .0554), UT-SCC-25 (r = 0.763; P = .0774), and UT-SCC-8 (r = 0.721; P = .1057) cell lines (Figure 4B).
Discussion
Our aim in this study was to investigate whether a certain molecular profile might affect [18F]EF5 and [18F]FDG uptake in HNSCC. The main finding of our study is that [18F]EF5 uptake appears to be related to a hypoxia-driven adverse phenotype. The highest [18F]EF5 uptake was seen in UT-SCC-34 xenografts (Figure 1), which also expressed high amounts of CA IX, Glut-1, and Hif-1α (Figure 2 and Table 2). Moreover, much lower levels of [18F]EF5 uptake and CA IX and Hif-1α expression were detected in UT-SCC-8 xenografts. We consider this difference (P = .091) in [18F]EF5 uptake as a trend toward significance in this limited sample number study. Compared to UT-SCC-8 xenografts, a higher, although not statistically significantly (P = .194), uptake of [18F]EF5 was also detected in UT-SCC-74A xenografts. The expression of CA IX was similarly higher in UT-SCC-74A xenografts, whereas the expression of Hif-1α was significantly (P = .012) lower compared with UT-SCC-34 xenografts.
CA IX is considered as a promising endogenous hypoxia-related marker, and a significant but weak correlation has been reported between CA IX staining and the distribution of the exogenous hypoxic cell marker pimonidazole [22]. However, also, other microenvironmental factors, such as pH homeostasis, affect the expression of CA IX [23]. In a number of studies, CA IX has been shown to be associated with a poorer locoregional control, overall survival, and aggressive phenotype [24], [25] Our finding that [18F]EF5 uptake, in addition to hypoxia, also reflects an adverse phenotype is further supported by previous studies depicting a relationship between unlabeled EF5 binding and tumor aggressiveness [19], [20].
We also found a higher, with a trend toward significance (P = .082), expression pattern of Hif-1α in UT-SCC-34 xenografts (Figure 2 and Table 2) compared to UT-SCC-8, whereas the Hif-1α expression was significantly lower in UT-SCC-74A xenografts (P = .012). In other words, we did not observe any relationship between Hif-1α expression and the uptake of [18F]EF5 (Figure 1). Our results are in line with earlier studies reporting a limited, or nonexisting, colocalization of Hif-1α with pimonidazole [26] and [18F]FMISO ([18F]fluoromisonidazole) [27]. Vucovic et al. [28] described a significant correlation between Hif-1α expression and EF5 staining in cervical cancer xenografts. However, the percentages of Hif-1α–positive cells staining for EF5 and vice versa ranged between 10% to 20%, pointing to a rather low association between these two markers. Moreover, declines in Hif-1α levels and Hif-1 activity in the later phase of tumorigenesis have been reported by Lehmann et al. [27].
In comparison to UT-SCC-8 xenografts, the uptake of [18F]FDG was also higher, although not statistically significantly, in UT-SCC-34 and UT-SCC-74A xenografts (Figure 1). This finding further supports our conclusion that the phenotype of UT-SCC-34 and UT-SCC-74A xenografts is more aggressive. Membranous Glut-1 expression was detected in all three UT-SCC xenografts. The expression of Glut-1 did not relate to the uptake of [18F]FDG or [18F]EF5. The highest expression was seen in UT-SCC-8 and UT-SCC-34 xenografts, whereas the lowest expression was detected in UT-SCC-74A xenografts (Figure 2 and Table 2). Although tumors frequently overexpress Glut-1, the cellular uptake of [18F]FDG is not exclusively attributable to Glut-1 [16], which probably explains the previous contradictory studies on the relationship between Glut-1 and [18F]FDG.
To further evaluate phenotype differences detected in the xenografts in vivo, we determined the uptake of [18F]EF5 and [18F]FDG in the cell lines in vitro. Cells were grown under normoxia and for 1, 3, 6, 12, and 24 hours of 1% of oxygen (Figure 3, Figure 4). These experiments confirmed the existence of phenotypic differences detected in xenografts. The lowest uptake of both tracers was found in UT-SCC-25 cells, which did not form xenografts in nude mice. The greatest uptake was detected in UT-SCC-34 and UT-SCC-74A cells. The uptake of [18F]EF5 increased after exposure to 1% of oxygen, but interestingly, we observed differences between the cell lines in the [18F]EF5 uptake already at normoxic conditions (Figure 3). This finding indicates that the studied cell lines express different hypoxia-driven adverse phenotypes that might influence their behavior, even without the presence of a hypoxic environment. There might also be variation in the activity of one-electron reductases required for activation of 2-nitroimidazoles in cells. Whether there is a relationship between these reductases and hypoxia-driven adverse phenotypes remains to be clarified. Recently, [18F]EF5 was shown to be activated by the same reductases as CEN-209 (a tirapazamine analog) in human tumor cell lines and thus to function as a dual reporter for both hypoxia and reductase expression in tumors [29]. The impact of hypoxia as a function of time affected the uptake of [18F]FDG to a greater extent than [18F]EF5. The uptake of [18F]FDG clearly increased after 1 hour of hypoxia exposure, typically being highest at 3 to 6 hours. UT-SCC-74A cells differed in this respect by displaying the highest uptake after 24 hours of hypoxia (Figure 4).
To evaluate the ability of cell lines to adapt to a stressful hypoxic environment, we also determined the expression of Hif-1α as a function of time (Figure 4B). We found an extensive variation in its expression level among the four cell lines, which furthermore correlated with the uptake of [18F]FDG. This correlation most probably reflects the metabolic adaptation of cells to hypoxia in vitro, which one could speculate is regulated by the activation of Hif-1. The fact that hypoxia induces anaerobic glycolysis and therefore the increases in [18F]FDG uptake have been shown previously [30], [31], although there are also contradictory results as reported by Busk et al. [32]. The lack of response reported in this study might be a result of contact-inhibited cells. We observed that it is important to seed cells at correct densities to achieve proliferative active cells during the time of tracer incubation. Contact-inhibited cells, or cells grown at a low density, did not increase their [18F]FDG uptake in 1% O2 (data not shown).
To summarize our observations, we found low uptake of [18F]EF5 and [18F]FDG in the UT-SCC-25 cell line, which was unable to form xenografts. Low tracer uptakes were also detected in UT-SCC-8 cells and corresponding xenografts that expressed low amounts of CA IX and Hif-1α. In contrast, UT-SCC-34 cells and xenografts exhibited high levels of [18F]EF5 and [18F]FDG uptake in addition to intense expression of CA IX, Glut-1, and Hif-1α. A more heterogeneous pattern of both uptake of tracers and expression of CA IX and Glut-1 was detected in UT-SCC-74A cells and xenografts.
Conclusion
In conclusion, our results demonstrate that the low-passage UT-SCC cell lines evaluated in this study differ in their glycolytic and hypoxic phenotypes. Importantly, these in vitro phenotypic differences can be imaged in vivo and may thus be clinically evaluable using PET. Overall, our results suggest that [18F]EF5 accumulation in HNSCC not only reflects hypoxia but also is related to an adverse phenotype. [18F]FDG uptake, in turn, may be sensitive to acute changes in oxygenation as suggested by rapid response of expression of HIF-1α to hypoxia in vitro. The hypoxia tracer [18F]EF5 might be useful for the detection of hypoxic and more aggressive HNSCC tumors, and thus, it could assist in planning of hypoxia-directed therapies. The biologic genotype behind the phenotypes reported in this study will need to be evaluated in greater detail.
Footnotes
Financial support was provided by the Foundation for the Finnish Cancer Institute, Turku Doctoral Programme of Biomedical Sciences, Turku University Foundation, Finnish Cultural Foundation, Swedish Cultural Foundation in Finland, Research and Science Foundation of Orion-Farmos, and Southwestern Finnish Cancer Foundation. The authors declare that they have no conflict of interests.
References
- 1.Overgaard J. Hypoxic modification of radiotherapy in squamous cell carcinoma of the head and neck - a systematic review and meta-analysis. Radiother Oncol. 2011;100:22–32. doi: 10.1016/j.radonc.2011.03.004. [DOI] [PubMed] [Google Scholar]
- 2.Guha C, Alfieri A, Blaufox MD, Kalnicki S. Tumor biology-guided radiotherapy treatment planning: gross tumor volume versus functional tumor volume. Semin Nucl Med. 2008;38:105–113. doi: 10.1053/j.semnuclmed.2007.12.001. [DOI] [PubMed] [Google Scholar]
- 3.Minn H, Suilamo S, Seppälä J. Impact of PET/CT on planning of radiotherapy in head and neck cancer. Q J Nucl Med Mol Imaging. 2010;54:521–532. [PubMed] [Google Scholar]
- 4.Vaupel P, Kallinowski F, Okunieff P. Blood flow, oxygen and nutrient supply, and metabolic microenvironment of human tumors: a review. Cancer Res. 1989;49:6449–6465. [PubMed] [Google Scholar]
- 5.Hanahan D, Weinberg RA. Hallmarks of cancer: the next generation. Cell. 2011;144:646–674. doi: 10.1016/j.cell.2011.02.013. [DOI] [PubMed] [Google Scholar]
- 6.Goldberg MA, Dunning SP, Bunn HF. Regulation of the erythropoietin gene: evidence that the oxygen sensor is a heme protein. Science. 1988;242:1412–1415. doi: 10.1126/science.2849206. [DOI] [PubMed] [Google Scholar]
- 7.Semenza GL, Nejfelt MK, Chi SM, Antonarakis SE. Hypoxia-inducible nuclear factors bind to an enhancer element located 3′ to the human erythropoietin gene. Proc Natl Acad Sci U S A. 1991;88:5680–5684. doi: 10.1073/pnas.88.13.5680. [DOI] [PMC free article] [PubMed] [Google Scholar]
- 8.Semenza GL. HIF-1: upstream and downstream of cancer metabolism. Curr Opin Genet Dev. 2010;20:51–56. doi: 10.1016/j.gde.2009.10.009. [DOI] [PMC free article] [PubMed] [Google Scholar]
- 9.Jokilehto T, Jaakkola PM. The role of HIF prolyl hydroxylases in tumour growth. J Cell Mol Med. 2010;14:758–770. doi: 10.1111/j.1582-4934.2010.01030.x. [DOI] [PMC free article] [PubMed] [Google Scholar]
- 10.Swietach P, Hulikova A, Vaughan-Jones RD, Harris AL. New insights into the physiological role of carbonic anhydrase IX in tumour pH regulation. Oncogene. 2010;29:6509–6521. doi: 10.1038/onc.2010.455. [DOI] [PubMed] [Google Scholar]
- 11.Korkeila E, Talvinen K, Jaakkola PM, Minn H, Syrjänen K, Sundström J, Pyrhönen S. Expression of carbonic anhydrase IX suggests poor outcome in rectal cancer. Br J Cancer. 2009;100:874–880. doi: 10.1038/sj.bjc.6604949. [DOI] [PMC free article] [PubMed] [Google Scholar]
- 12.Ivanov S, Liao SY, Ivanova A, Danilkovitch-Miagkova A, Tarasova N, Weirich G, Merrill MJ, Proescholdt MA, Oldfield EH, Lee J. Expression of hypoxia-inducible cell-surface transmembrane carbonic anhydrases in human cancer. Am J Pathol. 2001;158:905–919. doi: 10.1016/S0002-9440(10)64038-2. [DOI] [PMC free article] [PubMed] [Google Scholar]
- 13.Koppenol WH, Bounds PL, Dang CV. Otto Warburg's contributions to current concepts of cancer metabolism. Nat Rev Cancer. 2011;11:325–337. doi: 10.1038/nrc3038. [DOI] [PubMed] [Google Scholar]
- 14.Kunkel M, Reichert TE, Benz P, Lehr HA, Jeong JH, Wieand S, Bartenstein P, Wagner W, Whiteside TL. Overexpression of Glut-1 and increased glucose metabolism in tumors are associated with a poor prognosis in patients with oral squamous cell carcinoma. Cancer. 2003;97:1015–1024. doi: 10.1002/cncr.11159. [DOI] [PubMed] [Google Scholar]
- 15.Vaupel P, Mayer A. Hypoxia in cancer: significance and impact on clinical outcome. Cancer Metastasis Rev. 2007;26:225–239. doi: 10.1007/s10555-007-9055-1. [DOI] [PubMed] [Google Scholar]
- 16.Avril N. GLUT1 expression in tissue and 18F-FDG uptake. J Nucl Med. 2004;45:930–932. [PubMed] [Google Scholar]
- 17.Krohn KA, Link JM, Mason RP. Molecular imaging of hypoxia. J Nucl Med. 2008;49:129S–148S. doi: 10.2967/jnumed.107.045914. [DOI] [PubMed] [Google Scholar]
- 18.Komar G, Seppänen M, Eskola O, Lindholm P, Grönroos TJ, Forsback S, Sipilä H, Evans SM, Solin O, Minn H. 18F-EF5: a new PET tracer for imaging hypoxia in head and neck cancer. J Nucl Med. 2008;49:1944–1951. doi: 10.2967/jnumed.108.053785. [DOI] [PubMed] [Google Scholar]
- 19.Chang Q, Jurisica I, Do T, Hedley DW. Hypoxia predicts aggressive growth and spontaneous metastasis formation from orthotopically grown primary xenografts of human pancreatic cancer. Cancer Res. 2011;71:3110–3120. doi: 10.1158/0008-5472.CAN-10-4049. [DOI] [PubMed] [Google Scholar]
- 20.Evans SM, Judy KD, Dunphy I, Jenkins WT, Hwang WT, Nelson PT, Lustig RA, Jenkins K, Magarelli DP, Hahn SM. Hypoxia is important in the biology and aggression of human glial brain tumors. Clin Cancer Res. 2004;10:8177–8184. doi: 10.1158/1078-0432.CCR-04-1081. [DOI] [PubMed] [Google Scholar]
- 21.Eskola O, Grönroos TJ, Forsback S, Tuomela J, Komar G, Bergman J, Härkönen P, Haaparanta M, Minn H, Solin O. Tracer level electrophilic synthesis and pharmacokinetics of the hypoxia tracer [18F]EF5. Mol Imaging Biol. 2012;14:205–212. doi: 10.1007/s11307-011-0484-4. [DOI] [PubMed] [Google Scholar]
- 22.Hoogsteen IJ, Lok J, Marres HA, Takes RP, Rijken PF, van der Kogel AJ, Kaanders JH. Hypoxia in larynx carcinomas assessed by pimonidazole binding and the value of CA-IX and vascularity as surrogate markers of hypoxia. Eur J Cancer. 2009;45:2906–2914. doi: 10.1016/j.ejca.2009.07.012. [DOI] [PubMed] [Google Scholar]
- 23.Sørensen BS, Hao J, Overgaard J, Vorum H, Honoré B, Alsner J, Horsman MR. Influence of oxygen concentration and pH on expression of hypoxia induced genes. Radiother Oncol. 2005;76:187–193. doi: 10.1016/j.radonc.2005.06.037. [DOI] [PubMed] [Google Scholar]
- 24.Potter CP, Harris AL. Diagnostic, prognostic and therapeutic implications of carbonic anhydrases in cancer. Br J Cancer. 2003;89:2–7. doi: 10.1038/sj.bjc.6600936. [DOI] [PMC free article] [PubMed] [Google Scholar]
- 25.Rademakers SE, Hoogsteen IJ, Rijken PF, Oosterwijk E, Terhaard CH, Doornaert PA, Langendijk JA, van den Ende P, Takes R, De Bree R. Pattern of CAIX expression is prognostic for outcome and predicts response to ARCON in patients with laryngeal cancer treated in a phase III randomized trial. Radiother Oncol. 2013;108:517–522. doi: 10.1016/j.radonc.2013.04.022. [DOI] [PubMed] [Google Scholar]
- 26.Vordermark D, Brown JM. Evaluation of hypoxia-inducible factor-1α (HIF-1α) as an intrinsic marker of tumor hypoxia in U87 MG human glioblastoma: in vitro and xenograft studies. Int J Radiat Oncol Biol Phys. 2003;56:1184–1193. doi: 10.1016/s0360-3016(03)00289-x. [DOI] [PubMed] [Google Scholar]
- 27.Lehmann S, Stiehl DP, Honer M, Dominietto M, Keist R, Kotevic I, Wollenick K, Ametamey S, Wenger RH, Rudin M. Longitudinal and multimodal in vivo imaging of tumor hypoxia and its downstream molecular events. Proc Natl Acad Sci U S A. 2009;106:14004–14009. doi: 10.1073/pnas.0901194106. [DOI] [PMC free article] [PubMed] [Google Scholar]
- 28.Vukovic V, Haugland HK, Nicklee T, Morrison AJ, Hedley DW. Hypoxia-inducible factor-1α is an intrinsic marker for hypoxia in cervical cancer xenografts. Cancer Res. 2001;61:7394–7398. [PubMed] [Google Scholar]
- 29.Wang J, Foehrenbacher A, Su J, Patel R, Hay MP, Hicks KO, Wilson WR. The 2-nitroimidazole EF5 is a biomarker for oxidoreductases that activate the bioreductive prodrug CEN-209 under hypoxia. Clin Cancer Res. 2012;18:1684–1695. doi: 10.1158/1078-0432.CCR-11-2296. [DOI] [PubMed] [Google Scholar]
- 30.Clavo AC, Brown RS, Wahl RL. Fluorodeoxyglucose uptake in human cancer cell lines is increased by hypoxia. J Nucl Med. 1995;36:1625–1632. [PubMed] [Google Scholar]
- 31.Minn H, Clawo AC, Wahl RL. Influence of hypoxia on tracer accumulation in squamous-cell carcinoma: in vitro evaluation for PET imaging. Nucl Med Biol. 1996;23:941–946. doi: 10.1016/s0969-8051(96)00134-5. [DOI] [PubMed] [Google Scholar]
- 32.Busk M, Horsman MR, Jakobsen S, Bussink J, van der Kogel A, Overgaard J. Cellular uptake of PET tracers of glucose metabolism and hypoxia and their linkage. Eur J Nucl Med Mol Imaging. 2008;35:2294–2303. doi: 10.1007/s00259-008-0888-9. [DOI] [PubMed] [Google Scholar]