

ABSTRACT
Drug-resistant extraintestinal pathogenic Escherichia coli (ExPEC) strains are the major cause of colisepticemia (colibacillosis), a condition that has become an increasing public health problem in recent years. ExPEC strains are characterized by high resistance to serum, which is otherwise highly toxic to most bacteria. To understand how these bacteria survive and grow in serum, we performed system-wide analyses of their response to serum, making a clear distinction between the responses to nutritional immunity and innate immunity. Thus, mild heat inactivation of serum destroys the immune complement and abolishes the bactericidal effect of serum (inactive serum), making it possible to examine nutritional immunity. We used a combination of deep RNA sequencing and proteomics in order to characterize ExPEC genes whose expression is affected by the nutritional stress of serum and by the immune complement. The major change in gene expression induced by serum—active and inactive—involved metabolic genes. In particular, the serum metabolic response is coordinated by three transcriptional regulators, Fur, BasR, and CysB. Fur alone was responsible for more than 80% of the serum-induced transcriptional response. Consistent with its role as a major serum response regulator, deletion of Fur renders the bacteria completely serum sensitive. These results highlight the role of metabolic adaptation in colisepticemia and virulence.
IMPORTANCE
Drug-resistant extraintestinal pathogenic Escherichia coli (ExPEC) strains have emerged as major pathogens, especially in community- and hospital-acquired infections. These bacteria cause a large spectrum of syndromes, the most serious of which is septicemia, a condition with a high mortality rate. These bacterial strains are characterized by high resistance to serum, otherwise highly toxic to most bacteria. To understand the basis of this resistance, we carried out system-wide analyses of the response of ExPEC strains to serum by using proteomics and deep RNA sequencing. The major changes in gene expression induced by exposure to serum involved metabolic genes, not necessarily implicated in relation to virulence. One metabolic regulator—Fur—involved in iron metabolism was responsible for more than 80% of the serum-induced response, and its deletion renders the bacteria completely serum sensitive. These results highlight the role of metabolic adaptation in virulence.
INTRODUCTION
Septicemia, the presence of bacteria in the bloodstream, is among the leading causes of death worldwide, and its incidence is on the rise (1). In the past decade, there has been a rapid increase in the rates of hospitalization and mortality from severe sepsis, mainly because of the escalation of antibiotic resistance (2). While most bacteria are unable to endure the strong bactericidal effects of serum, several pathogens have evolved mechanisms that enable them to subvert the host defense systems and successfully survive in this hostile niche.
In order to survive and even proliferate in serum, bacteria must overcome two major obstacles, the nutritional immunity and innate immunity of the host. Nutritional immunity is the process by which nutrients are kept in various storage molecules that make them unavailable to pathogens (3). Thus, an invading bacterium has to pass a metabolic barrier to survive. Iron sequestration by the host is the best-studied case of nutritional immunity. Although iron is an abundant nutrient in nature, serum contains very little free iron because iron is bound to storage molecules such as ferritin and hemosiderin. Therefore, it is not surprising that iron acquisition systems and receptors were found to play a pivotal role in the virulence of numerous pathogens. For instance, TonB, a protein that provides energy for the transport of iron compounds, was found to be required for the pathogenicity of several Gram-negative bacteria (4–8). An additional factor that was shown to be important for growth in serum is the ability to synthesize nucleotides, as the inactivation of nucleotide biosynthesis genes was shown to hamper the growth of Escherichia coli, Salmonella enterica serovar Typhimurium, and Bacillus anthracis in human serum (9).
The second barrier that bacteria need to overcome to establish sustained bacteremia is the one drawn by the immune system of the host. The complement system serves as the first line of defense against invading bacteria and acts on the outer membrane. In Gram-negative bacteria, the complement complex mediates direct killing by the formation of pores in the cell membrane. To avoid the highly bactericidal effect of serum, pathogens evolved structural features that inhibit complement-dependent killing. Many of these adaptations are in surface-exposed components, such as the outer membrane lipopolysaccharide (LPS) and the bacterial capsule (10). It was previously shown that variation in the length of the O antigen, as well as its type (E. coli for instance, has more than 190 types of O antigens), influences the level of serum resistance (11). Even a single nucleotide change that consequently results in a truncated gene coding for O antigen, is sufficient to turn a serum-resistant strain to a serum-sensitive one (12). However, not all of the adaptations are structural; some bacteria can secrete complement-binding proteins and specific complement inhibitors. Staphylococcus aureus, for instance, employs an arsenal of proteins to interfere with and block the activation of the innate immune response (13). Successful evasion of the innate immune system, coupled with proper metabolic adaptations, enables pathogenic bacteria to persist and multiply in the bloodstream, a process that often leads to sepsis and, if not treated successfully, death.
Among the leading causative agents of sepsis are extraintestinal pathogenic E. coli (ExPEC) strains, which bring about high morbidity and mortality rates. E. coli infections also result in a heavy economic burden. ExPEC strains are characterized by the ability to resist the bactericidal effect of human serum, and this study was aimed at understanding the functional genomic basis of this resistance. To this end, we studied E. coli O78:H19 sequence type 88 (ST88) isolate 789 (O78-9), an ExPEC isolate able to grow, and even multiply, in serum. We performed comprehensive system-wide analyses of both its transcriptome and its proteome in response to serum. To distinguish between genes that respond to the metabolic challenge presented by serum and those that respond to the bactericidal effect of the complement system, we compared the effect of serum depleted of immune complement by heat treatment (inactive serum) with that of active serum. Here we show that the bacterial response to heat-inactivated serum included a change in the expression of a vast spectrum of known virulence determinants and iron acquisition genes, as well as transcriptional regulators. In contrast, the distinctive response to active serum (complement system) involved a much smaller group of genes, some of which are involved in the response to pH changes and others of which have unknown functions. One clear conclusion that emerged from these studies is that the key regulator of the response to serum—active and inactive—is the iron regulator Fur, which controls the expression of more than 80% of the serum-upregulated genes.
RESULTS AND DISCUSSION
ExPEC growth in serum.
Septicemic bacteria are relatively resistant to the bactericidal effect of serum. We studied a septicemic strain, E. coli serotype O78:H19 ST88 isolate 789 (O78-9), that is capable of growing in serum. The results presented in Fig. 1A show the growth of E. coli O78-9 in 40% serum in comparison with that of a nonpathogenic E. coli strain (K-12) that undergoes lysis under the same conditions (Fig. 1B). The serum component significant in growth inhibition is the immune complement, as its inactivation by heat (inactive serum, 40 min at 56°C) enables the growth of E. coli K-12 (Fig. 1B, inset).
FIG 1 .
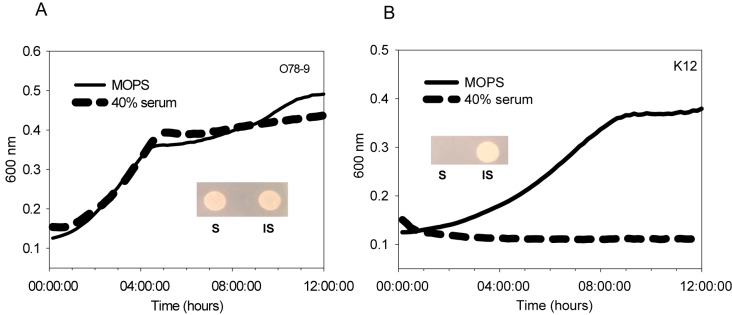
ExPEC O78-9 is serum resistant. Cultures of E. coli strains O78-9 (A) and K-12 (B) were grown overnight and diluted in MOPS medium or in MOPS medium containing 40% serum, and growth curves were generated by measuring OD600 with the BIO-TEK Eon platform. Viability was estimated by dropping 10 µl of a culture treated with serum for 60 min on LB medium plates and incubating them overnight at 37°C (insets). S, serum; IS, inactive serum.
Transcriptome analyses of ExPEC genes upon exposure to serum.
As pointed out, the response to serum is driven by two major stress conditions—nutritional stress and the bactericidal effect of complement. To study the nutritional stress, we investigated the response of ExPEC O78-9 to inactive serum. Because serum inactivation is achieved by mild heat conditions that destroy the complement system without affecting other properties such as pH and nutrient availability, the response to inactive serum represents the response to nutritional immunity. The experiments were carried out with cultures grown in minimal, salt-glucose, media. In these media, all of the biosynthetic genes are active and it is possible to study metabolic stress.
To obtain transcriptional expression data for the complete genome, we used the Illumina transcriptome sequencing (RNA-seq) platform. RNA was obtained from biological replicates of bacteria grown in minimal morpholinepropanesulfonic acid (MOPS) medium supplemented with glucose and with or without exposure to 40% inactive serum. Total RNA was extracted and rRNA depleted (as described in Materials and Methods). Two independent biological replicates and deep sequencing analyses were performed, and the data were analyzed by using strict criteria, as described in Materials and Methods. We examined only genes that were expressed the same way in the two independent biological experiments by using a 2-fold cutoff. The expression data of selected genes were confirmed by quantitative reverse transcription-PCR.
To obtain a comprehensive overview of the transcriptional response to serum, we compiled Voronoi tree maps (14, 15) from the quantitative transcriptomic data. In these tree maps, the transcripts are clustered according to their functions as obtained from the TIGR classification. Thus, functionally related elements are localized in close proximity to each other. The categories can then be subdivided sequentially down to the level of a single gene. A general representation of all functional pathways is shown in Fig. 2, upper panel. The log2 ratios (i.e., treated/control) of expression data were color coded by using a divergent color gradient (from blue for downregulated to red for upregulated). The Voronoi tree maps of the transcriptome induced by inactive serum and the pathways derived from it are presented in Fig. 2, lower panel, left side, which shows that serum affects the expression of a broad spectrum of genes with a variety of functions. Most of the serum-induced changes are metabolic; the upregulated pathways were mainly those of cations, iron-carrying compounds, amino acids, and amine biosynthesis, especially in the aspartate family. In contrast, pyruvate, glutamate, and aromatic amino acid biosynthesis pathways were downregulated. Other significantly downregulated genes included those for sulfur metabolism, the trichloroacetic acid cycle, and metabolism of polysaccharides. Most striking is the downregulation of biosynthetic genes involving the synthesis of several amino acids, mainly cysteine. The downregulated genes (Table 1) appeared to be affected directly by two major transcription factors, CysB and BasR. The cysB gene product downregulates 11 genes involved in cysteine metabolism in addition to that for the transcription factor Cbl, which is responsible for sulfate starvation. The downregulated genes also include the six members of the sugar nucleoside metabolism arn operon (16–18) (arnB, arnC. arnA, arnD, arnT, arnE), which are under the control of the BasRS two-component system. The latter consists of two proteins that are involved in iron metabolism and protect against high concentrations of external iron (19, 20). Generally, it appears that the downregulated genes encode mainly metabolic enzymes (aminotransferases, glycosyltransferases, and formyltransferases).
FIG 2 .

Tree map of differentially expressed genes in ExPEC O78-9 based on transcriptome analysis. Functional Voronoi tree maps of E. coli strain O78-9 were obtained from transcriptomes of bacteria exposed to serum for 15 min. Each cell represents one quantified transcript, and transcripts encoding functionally related proteins are subsumed in convex-shaped parental categories of increasing levels based on TIGR gene classification. The ratios of expression data were color coded by using a divergent color gradient. The bluish and orange tiles represent down- and upregulated pathways, respectively. Top panel: General representation of all functional pathways, levels 1 to 4 (left to right). Lower panel, left side: Transcription patterns in response to nutritional challenge. Lower panel, right side: Immune complement-induced gene fraction.
TABLE 1 .
Genes downregulated (at least 2-fold) in response to inactive serum
| Operon | Gene(s) differentially expressed | Function(s) | Regulator(s) |
|---|---|---|---|
| cysPUWAM | cysP, cysU, cysW, cysA | Sulfate/thiosulfate transporter | CysB, H-NS |
| cysDNC | cysD, cysN, cysC | Sulfate adenylyltransferase and adenylyl-sulfate kinase | CysB |
| cysJIH | cysJ, cysI, cysH | Sulfite and 3′-phosphoadenylylsulfate reductases | CysB, IHF |
| cysK | cysK | Cysteine synthase A | CysB |
| cbl | cbl | CysB-like transcriptional activator | CysB, NtrC |
| arnBCADTEF | arnB, arnC, arnA, arnD, arnT, arnE | Modification of LPS | BasR |
| yibD | yibD | Predicted glycosyltransferase | BasR, NsrR, PhoB |
| glnK-amtB | glnK | Nitrogen-regulatory protein | Fur, NtrC, FNR, GadX |
| ftnA | ftnA | Cytoplasmic ferritin iron storage protein | Fur, H-NS |
| basS-basR | bass, basR | Response to excess external iron | |
| ais | ais | Protein induced by aluminum | |
| yjdB | yjdB | Metal-dependent hydrolase | |
| ugd | ugd | UDP-glucose 6-dehydrogenase | |
| yeeED | yeeE, yeeD | Unknown | |
| yedEF | yedF | Unknown | |
| ydjN | ydjN | Unknown | |
| ydjO | ydjO | Unknown |
The metabolic changes in response to serum are characterized by a massive upregulation of operons attributed to various iron receptors, binding proteins, transporters, and siderophore genes (Table 2). We show that the vast majority of these genes are involved in the maintenance of iron equilibrium between the bacterium and its surroundings. Interestingly, many of the upregulated genes have basic metabolic functions. For instance, the entire operons encoding iron hydroxamate (fhuACDB), iron dicitrate (fecABCDE), FeS cluster assembly protein (sufABCDSE), an electron transport system (nrdHIEF), and enterobactin (fepA-entD) formed the scaffold of the ExPEC O78-9 iron response to serum. Notably, these operons are also found in commensal E. coli strains such as K-12.
TABLE 2 .
Genes upregulated (at least 2-fold) in response to inactive serum
| Operon | Gene(s) differentially expressed | Function(s) | Regulator(s) |
|---|---|---|---|
| fhuACDB | fhuA, fhuC, fhuD, fhuB | Iron-hydroxamate transporter | Fur |
| fepA-entD | fepA, entD | Enterobactin | Fur, CRP |
| fes-ybdZ-entF-fepE | fes, ybdZ, entF | Enterobactin | Fur, CRP |
| fepDGC | fepG, fepC | Enterobactin transporter | Fur |
| entCEBAH | entC, entE, entB, entA, entH | Enterobactin | Fur, CRP |
| sufABCDSE | sufA, sufB, sufC, sufD, sufS | FeS cluster assembly protein | Fur, IHF, IscR, NsrR, OxyR |
| nrdHIEF | nrdH, nrdI, nrdE, nrdF | Electron transport system | Fur, IscR, NrdR |
| fecABCDE | fecA, fecB, fecC, fecD, fecE | Iron-dicitrate transporter | Fur, CRP, PdhR, YjiE |
| fecIR | fecI, fecR | Signal transducer, sigma 19 | Fur |
| exbBD | exbB, exbD | Energy transduction system | Fur |
| feoABC | feoB | Ferrous iron transporter | Fur, NagC, FNR |
| fhuE | fhuE | Ferric-rhodotorulic acid transporter | Fur |
| fhuF | fhuF | Ferric iron reductase | Fur, OxyR |
| entS | entS | Enterobactin exporter | Fur |
| fepB | fepB | Enterobactin transporter | Fur, RutR |
| ybiX | ybiX | Fe(II)-dependent oxygenase | Fur |
| Fiu | Fiu | Catecholate siderophore receptor | Fur |
| bfd-bfr | bfd | Bacterioferritin, iron storage, detoxification | Fura |
| yncE | yncE | Unknown | Fur,a MarA |
| ybtA | ybtA | Yersiniabactin transcriptional regulator | Fura |
| iron | iroN | Outer membrane siderophore receptor | Fura |
| yddAB | yddA, yddB | Multidrug transporter | Fura (yddA) |
| efeU | efeU | Ferrous ion transporter | Fur,a CpxR |
| efeOB | efeO, efeB | Ferrous ion transporter | |
| yjjQ-bglJ | bglJ | DNA-binding transcriptional activator | H-NS, LeuO |
| hokE | hokE | Toxic polypeptide | LexA |
| ybiI | ybiI | Unknown | |
| yrbL | yrbL | Unknown | BasR, PhoP |
| pqqL | pqqL | Predicted peptidase | |
| 78900613 | 78900613 | Ferric enterochelin esterase | Fura |
| 78901042 | 78901042 | Phage-like element | |
| 78903310 | 78903310 | Unknown | |
| 78904620 | 78904620 | Unknown |
Fur binding box computationally detected in promoter region.
Most interesting is the upshift in the expression of bglJ, a component of the yjjQ-bglJ transcription unit. These genes detoxify the α-oxoaldehyde methylglyoxal (MG), an intracellular metabolism product; overproduction of MG results in cell death. The gene products contain the helix-turn-helix motif typical of the LuxR transcript regulator family (21) and are therefore suspected of being transcription regulators. It was previously suggested that the yjjQ gene of E. coli serotype O2:H5 (22) and S. enterica serovar Typhimurium (23) may be important for virulence in long-term systemic infections of mice.
Another upregulated gene is hokE, a homologue of hok (host killing) that is part of the hok-sok toxin-antitoxin system, an associated gene member of the SOS regulon (24). Five additional genes that are upregulated in the presence of serum have unknown functions (yrbL pqqL, 78901042, 78903310, and 78904620).
Complement-dependent transcriptomic response.
The genes responding to the bactericidal effect of serum could be identified by exposure to active serum and comparison of the transcriptome data to those obtained in the presence of inactive serum. This comparison revealed a small set of genes that were induced only in the presence of active serum—probably by the presence of complement. In contrast to the metabolic stress (Fig. 2, lower panel, left side), the complement-induced gene fraction is characterized by upregulation of the serine family, sulfur metabolism, and pyruvate and glutamate biosynthesis (Fig. 2, lower panel, right side). The complement-induced response consists of genes involved in iron metabolism (Table 3)—the ferric enterobactin transport system gene fepE and the iron storage bacterioferritin gene bfr. The presence of complement also induces galP, a gene that codes for a transporter, a member of the major facilitator superfamily of transporters. The rest of the upregulated genes have unknown functions and code for the putative proteins YcfJ (25, 26), YpfG (27), and YgaC (28, 29). Exposure to complement repressed the transcription of the enzyme-encoding genes yfaO, sodB, sorC, and fimA in addition to one conserved hypothetical protein with high homology to iraM. The observation that FimA, the major E. coli fimbrial subunit protein, is downregulated in response to serum is in line with previous findings suggesting that under low-iron conditions, E. coli decreases the expression of type I fimbriae (30, 31). The iraM gene is induced under magnesium starvation and serves as a stabilizer of RpoS, the sigma factor of the general stress response (32, 33). The sodB gene, which encodes the Fe-dependent superoxide dismutase FeSOD, is also downregulated in the presence of serum and is connected with iron metabolism (34).
TABLE 3 .
Complement-dependent genes
| Operon | Genes differentially expressed | Function(s) | Response to serumb | Regulation |
|---|---|---|---|---|
| fes-ybdZ-entF-fepE | fepE | Enterobactin | Up | Fur, CRP |
| ygaC | ygaC | Response to cytoplasmic pH stress | Up | Fur |
| ypfG | ypfG | Unknown | Up | Fura |
| ycfJ | ycfJ | Biofilm formation | Up | |
| bfd-bfr | bfr | Bacterioferritin, iron storage, detoxification | Up | |
| galP | galP | Galactose-proton symport of transport system | Up | CRP, GalR, GalS, NagC |
| 78901228 | 78901228 | Enhancement of lycopene biosynthesis protein 1 | Down | ArcA, FNR, PhoP |
| fimAICDFGH | fimA | Major type 1 fimbrial subunit | Down | H-NS, IHF, Lrp |
| sodB | sodB | Superoxide dismutase | Down | NsrR, CRP, IHF |
| yfaO | yfaO | Putative nudix hydrolase YfaO | Down | |
| sorC | sorC | Transcriptional regulator of sorbitol uptake and utilization | Down |
Fur binding box computationally detected in promoter region.
Up, upregulation. Down, downregulation.
It should be noted that in addition to the genes whose expression changes in response to complement, there are genes for other systems essential for complement survival, such as LPSs or capsule. These genes were studied in recent papers (10, 35) that looked at the effect of serum on an E. coli strain involved in urinary tract infections. Clearly, these surface components are essential for pathogenesis and survival in the bloodstream. Some of these genes are constitutive, and therefore, their expression is not affected by the presence of serum. However, the genes involved in the biosynthesis of the exopolysaccharide colanic acid are induced by serum (35) but were not detected in our system. These genes are under the control of the Rcs regulator, whose level is greatly affected by the growth medium (36). Thus, the experiments of Miajlovic et al. were conducted with cultures grown in Luria-Bertani (LB) medium, where the expression levels of the Rcs-regulated genes are low. Our experiments were carried out with cultures grown in minimal medium, where the Rcs-regulated genes are already induced and the addition of serum probably does not result in significant further induction.
Proteome analyses of the serum response.
The effect of serum on gene expression was determined at the proteome level by using mass spectrometry (MS)-based proteomics as described in Materials and Methods. As in the transcriptome experiments, the proteins were extracted from cultures exposed to active or inactive serum and an untreated reference culture. A total of 1,037 proteins were identified (see Appendix SA in the supplemental material), and many of them could be detected only under one condition—in the presence of serum or in the untreated culture. Two hundred proteins were significantly differentially expressed, at least 2-fold, in the presence of serum (113 were upregulated, and 87 were downregulated). Of these proteins, 155 were also differentially expressed in response to inactive serum (70 were upregulated, and 85 were downregulated). The proteins that are present at very low levels in the presence of serum are probably encoded by genes that were significantly repressed in the presence of serum. However, it is possible that the level of some of them goes down in the presence of serum because of degradation. In an effort to achieve a global view of the functions altered in response to innate or nutritional immunity, we mapped all of the proteins to their corresponding pathways on the basis of the Voronoi tree map representation (Fig. 3, top panel).
FIG 3 .

Tree map of differentially expressed genes in ExPEC O78-9 based on proteome analysis. The tree map shown is as described in the legend to Fig. 2 but is based on proteomic data.
The group of proteins that were induced by serum included a number of conserved hypothetical proteins. However, many of the proteins that were present in very low concentrations without serum and induced by serum (inactive and active) were involved in iron acquisition. This finding is not surprising, as serum is devoid of free iron because of the presence of human iron-binding proteins. There were also proteins that could not be detected once serum (active or inactive) was added. This group includes proteins that participate in various biosynthesis pathways, the arn operon (arnC, arnA, and arnD [16–18]), transcription regulatory factor BasR (19, 20), and conserved hypothetical proteins.
A comparison of the genes differentially expressed in the presence of active serum versus inactive serum is shown in the bottom part of Fig. 3, right side. This group contained only a few proteins, as most of the responding proteins behave the same in active and inactive serum. The unique group of complement-induced proteins contained proteins involved in energy metabolism, amino acid synthesis, and the biosynthesis of cofactors, purines pyrimidine, and nucleosides. This group also contained proteins involved in cell envelope maintenance (MurD, MurE, MreB, GlmU, Alr, GalU). The latter observation is in line with the knowledge that the innate immune system causes membrane stress and that the integrity of the bacterial cell envelope is crucial for survival in serum and circumvention of the host’s membrane attack complex (37–39).
For the complete list of proteins whose expression depends on the presence of serum, see Appendix SA in the supplemental material.
Comparison of mRNA levels and protein abundance.
An analysis of the mRNA levels and protein concentrations in response to exposure to inactive and activated serum (Fig. 4A and B, respectively) shows that under both conditions, there is a linear relationship between RNA levels and protein abundance (active serum, R2 = 0.3 and Spearman’s rank correlation coefficient = 0.45; inactivated serum, R2 = 0.25 and Spearman’s rank correlation coefficient = 0.47). These results are consistent with previous observations that mRNA levels explain one- to two-thirds of the variance in protein levels (40).
FIG 4 .
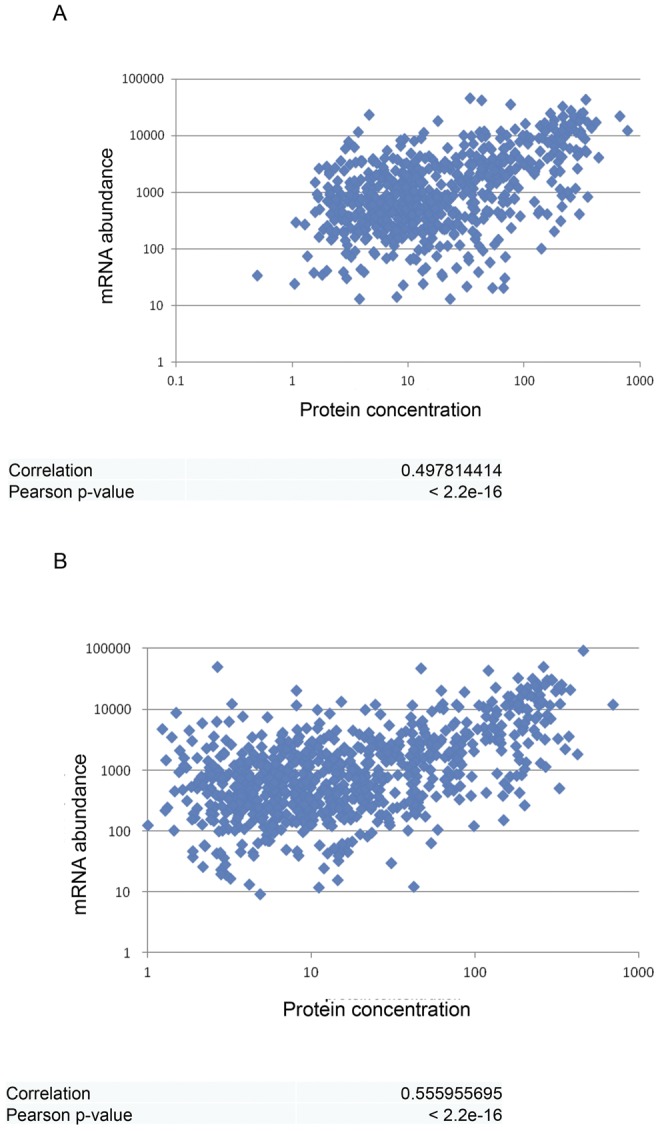
Comparative analysis of RNA and protein profiles of E. coli O78-9 in response to human serum. The results show the correlation between changes in protein (log2 fmol/ng ratio) and transcript (log2 RPKM ratio) levels in bacteria grown in 40% serum over bacteria grown in MOPS minimal medium. A 2-fold change between the conditions was used as the cutoff for up- and downregulation of RNA and protein levels. (A) After exposure to inactive serum. (B) After exposure to active serum.
Fur is the major regulator of the serum response.
In an attempt to discover the regulatory network underlying serum adaptation, we systematically analyzed which transcription factor controls each of the differentially expressed genes involved in ExPEC’s serum response. To this end, we used a literature survey and RegulonDB, a database of the regulatory interactions of E. coli K-12 (41). As shown in Table 2, in accordance with the proteome results, Fur appears to be the key regulator of serum adaptation, controlling more than 70% of all upregulated genes. Fur, the ferric uptake regulator, serves as the main iron regulator in a wide range of bacterial species (29, 42–51). Fur was found to play a role in the virulence of many bacteria, including Staphylococcus aureus, Vibrio cholerae, Neisseria species, Yersinia species, and E. coli (52, 53). Fur repression occurs under iron-depleted conditions and is achieved by binding of Fur dimers to Fur boxes of target promoters. In the absence of free iron, the repression is removed and the genes are transcribed, as occurs in serum, an iron-limiting environment.
While RegulonDB provides comprehensive data on transcription factor-gene interactions in E. coli K-12, it cannot detect new regulatory interactions that appear in other strains. To overcome this obstacle, we scanned the region upstream of each of the serum-responsive genes to identify the presence of the 19-bp Fur binding consensus box (Fig. 5, upper part) by using weight matrices taken from PRODORIC (54). The Fur binding box is composed of three adjacent hexamers that bind dimeric Fur (55). Fur binding boxes were detected in seven additional genes that were upregulated in response to inactive serum, efeU, iroN, yncE, ybtA, bfd, yddA, and the ferric enterochelin esterase-encoding gene 78900613 (Fig. 5, lower part), and in one gene, ypfG, that was induced only in the presence of complement. As expected, most of these genes are attributed to iron transporters, acquisition systems, and storage. It may be significant that two out of the eight genes found to have a Fur box, iroN and ybtA, were acquired by lateral gene transfer from other pathogens (S. enterica and Yersinia pestis, respectively) (56, 57). Thus, all in all, Fur is predicted to control more than 80% of the genes involved in the adaptation of E. coli to serum (Fig. 6 and Table 2).
FIG 5 .
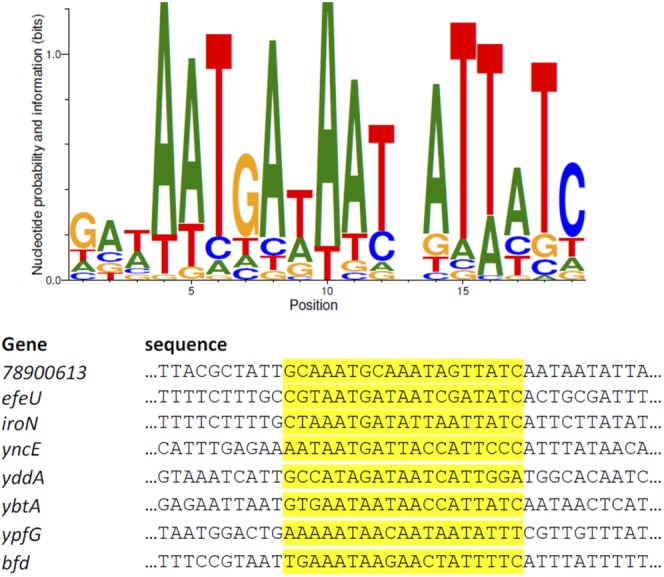
The Fur binding box motif and predicted E. coli O78-9 genes with Fur binding boxes in their promoter regions. The Fur binding box 19-bp consensus sequence was created in WebLogo (upper part). Eight O78-9 gene sequences containing a Fur binding box (highlighted) that were computationally derived from the PRODORIC database are shown at the bottom.
FIG 6 .

The majority of the genes upregulated in response to serum are controlled by Fur. Genes upregulated following exposure to inactive serum that contain a Fur binding box (blue) and genes upregulated under another transcription factor (red) are shown. Asterisks indicate genes predicted by this study to have a Fur binding box.
Fur is essential for survival in serum.
As Fur is clearly a major regulator of growth in serum, we constructed a deletion of the fur gene to study its effect on survival in serum. The results presented in Fig. 7 indicate that the removal of Fur had no effect on growth in minimal medium. In contrast, the deletion-containing bacteria grew very poorly in the presence of serum. Growth in serum was restored by complementation with the fur gene on a plasmid. Although there was an induction of many proteins involved in iron metabolism, the concentration of Fur was unchanged upon exposure to serum. These results further support the notion that the effects of Fur are not solely concentration dependent and there must be additional factors involved, such as iron-dependent changes in its activity (58, 59).
FIG 7 .

Fur is essential for growth of E. coli O78-9 in serum. Bacterial cultures were grown as described in the legend to Fig. 1. Strain 078-9 Δfur grew in MOPS medium (continuous line) or in the presence of 40% serum (dotted line). Growth arrest due to serum exposure was restored in strain 078-9 Δfur/pBADfur (dashed line). Viability was estimated as described in the legend to Fig. 1, and the results are shown on the right. S, serum; IS, inactive serum.
Our results reflect the complex role of Fur in bacterial metabolism. As Fur is the regulator of iron metabolism, its removal would disrupt the delicate balance of the function involved in this important system. Actually, one would expect that a fur deletion would have a significant effect under all growth conditions. Yet, the bacteria appear to be able to control growth in the absence of Fur but are not capable of doing so under extreme iron concentration changes, such as in the presence of serum. The effect of fur deletion is not restricted to E. coli, as it was also previously shown in Neisseria meningitidis, deletion mutants of which acquired serum sensitivity (60).
Conclusions.
Here we present data, obtained from proteomic and transcriptomic experiments, on the global effect of exposure to serum on septicemic E. coli. We focused on genes required to overcome the nutritional immunity of serum and therefore conducted our studies with minimal media, in which the metabolic genes are active. Under such conditions, it is possible to see the serum-induced metabolic changes and the regulatory networks that control them. The most striking finding is the identification of Fur as the major regulator during serum exposure. Thus, >80% of the upregulated genes are under the control of Fur, the major regulator of iron metabolism (61, 62).
Genes that encode virulence factors are essential for pathogenesis. However, recent studies indicate that bacterial virulence is highly dependent on the regulation of metabolic genes (63–66), which are no less important than genes that encode virulence factors. The results presented here strongly support this notion and indicate that the major changes in bacterial gene expression upon exposure to serum involve metabolic genes, and these changes are essential for survival in serum.
MATERIALS AND METHODS
Bacterial strains and growth media.
All of the E. coli strain and plasmids used in this study are listed in Table 4. Unless stated otherwise, all E. coli strains were grown while shaking at 30°C in minimal defined MOPS medium (with 0.2% glucose added). When required, antibiotics were added to the medium (ampicillin at 300 µg/ml, kanamycin at 50 µg/ml, chloramphenicol at 20 µg/ml). To determine growth curves, log-phase cultures were diluted to an optical density at 600 nm (OD600) of 0.04 as determined with a BioTek Eon plate reader, and turbidity at 600 nm was measured every 20 min. Viable counts were determined after 1 h of incubation with serum or inactive serum by plating 10-µl drops of increasing dilutions on LB medium plates and incubating them overnight.
TABLE 4 .
Plasmids and strains used in this study
| Plasmid or strain | Description | Reference |
|---|---|---|
| Plasmids | ||
| pKD4 | Template for kanamycin resistance cassette | 76 |
| pBAD24 | Ampr, arabinose-inducible plasmid | 69 |
| pBADfur | Ampr, arabinose-inducible plasmid containing fur ORF | This study |
| E. coli strains | ||
| MG1655 | Wild-type K-12 strain | |
| 078-9 | Wild-type ExPEC 078 strain isolated from a turkey with sepsis | |
| 078-9 Δfur | This study | |
| 078-9 Δfur/pBADfur | This study |
RNA isolation and purification.
Overnight cultures were diluted to an OD600 of 0.04 and allowed to grow to an OD600 of 0.3; cells were then introduced to serum, inactive serum, or saline to a final volume of 40%. Cells were pelleted by 10 min of centrifugation at 3,000 rpm at 4°C. Pellets were resuspended in 6 µl of freshly prepared lysozyme solution (1 mg/ml) in 10 mM Tris-HCl, pH 8.0, and incubated at 37°C for 7 min with occasional mixing. One milliliter of TriReagent was added to each sample, and the homogenate was stored at room temperature for 5 min. A 200-µl volume of chloroform was added for 15 s of incubation, and the resulting mixture was stored at room temperature for 2 to 15 min and centrifuged at 12,000 rpm for 15 min at 4°C. RNA was precipitated from the aqueous phase by mixing with isopropanol (0.5 ml/ml of the TriReagent used for the initial homogenization), stored at room temperature for 5 to 10 min, and centrifuged at 12,000 rpm for 8 min at 4 to 25°C. The RNA pellet was washed with 75% ethanol, centrifuged at 7,500 rpm for 5 min, and air dried. The pellet was dissolved in 30 to 50 µl of ultrapure water (or treated with diethyl pyrocarbonate). rRNA was depleted by using the MICROBExpress kit (Ambion) according to the manufacturer’s protocol. DNase treatment was done according to the manufacturer protocol with the Ambion TURBO DNA-free kit.
RNA-seq.
Removal of 16S and 23S rRNAs from total RNA was performed with the MICROBExpress bacterial mRNA purification kit (Ambion) according to manufacturer’s protocol (67). RNA concentrations and quality were determined by using the Bioanalyzer 2100 (Agilent). For whole-transcriptome sequencing (RNA-seq), cDNA libraries were prepared by the Illumina mRNA-seq TruSeq protocol according to the manufacturer’s protocol without the poly(A) isolation stage. Sequencing was performed with an Illumina HiSeq 2500 sequencing machine. Sequencing generated 20 to 28 million raw reads per sample, of which 2 to 6 million were mapped to protein-encoding genes. The RNA-seq data were analyzed by a standard protocol based on the number of reads per kilobase of coding sequence length per million reads analyzed (RPKM) (68).
Construction of deletions and recombinant plasmids.
All site-specific gene knockouts were obtained as described by Datsenko and Wanner (69). Briefly, competent wild-type O78-9 bacteria were transformed with plasmid pKD46. The transformants were grown in ampicillin-containing LB medium, induced with arabinose, made competent for electroporation, and stored at −70°C until used. A linear PCR product was made on the template of a kanamycin resistance cassette flanked by FLP recognition target (FRT) sequences from the pKD4 plasmid according to the region to be deleted. The primers were designed to contain 36 nucleotides from the flanking region of the sequence to be deleted from strain O78-9. Kanamycin-resistant recombinants were screened by means of colony PCR with primers k2 and kt. Unless stated otherwise, the pKD46 plasmid was cured by growth on LB medium at 42°C. The resulting bacteria were transformed with pCP20 and grown on LB medium at 42°C to promote both FRT-specific recombination and curing of the plasmid. The final deletion was verified by sequencing. Recombinant plasmids for complementation were constructed by cloning PCR-amplified DNA fragments into a pBAD24 vector with Fast-Link DNA ligase (Epicentre). The ligation products were transformed into competent 078-9 bacteria, and the resulting clones were screened by colony PCR.
Human serum.
Sterile and filtered human male AB plasma was acquired from Sigma-Aldrich. Human serum was inactivated by incubation for 40 min at 56°C to eliminate all of the active immune complement system.
Clustering and enrichment analysis.
E. coli 078-9 is still available in a roughly annotated version. HMMER (70) was used for the prediction of gene functions according the TIGRFAM classification. For this purpose, HMMER used the Hidden Markov file containing the definitions derived from sequences of already assigned TIGR protein families from other bacteria, which can be downloaded from the website ftp://ftp.jcvi.org/pub/data/TIGRFAMs. In the resulting list, locus tags (RACOXXXX) were assigned to one or more TIGRFAMs, which were assigned to (metabolic) subroles, which were then summarized in hierarchically parent main roles. TIGRFAMs that were assigned to generic categories such as hypothetical proteins, general, and so on were, if possible, manually reclassified into more-specific categories. By using Voronoi tree maps (14, 15), all functionally assigned genes were shown in a hierarchically organized and space-filling manner, as shown in Fig. 2. The space-filling approach divides the two-dimensional plane into subareas according the main rules, which are then subdivided into subsubareas of the subrules and so forth. The polygons on the last level represent all of the functionally assigned genes. Transcriptional data were mapped by using a divergent color gradient starting with gray in the middle and ending with blue (for repression) and orange (for induction) on the sides.
Identification of Fur binding sites.
Fur binding site position weight matrices (PWMs) were downloaded from PRODORIC version 8.9 (54). The score of each sequence is the log of the ratio of the likelihood of the sequence given the PWM model to the likelihood of the sequence given a background model. The background model assumes that at each position, the probability of each character equals its frequency in a concatenated regulatory sequence of 078-9. A significant hit is defined as a score of >4.6. The position-specific scoring matrix for the consensus logo was created with WebLogo.
Gel-free absolute proteome quantification.
E. coli 078-9 was grown in 50 ml of MOPS medium in shaking flasks under agitation at 37°C. At an OD600 of 0.5, human serum, inactivated human serum, or saline was added to a final concentration of 40% and the bacteria were incubated for 45 min. Cells were harvested by centrifugation (8,000 × g, 15 min, 4°C). The resulting cell pellet was resuspended and washed twice in 50 mM triethylammonium bicarbonate. Cell disruption was carried out in a RiboLyzer (Thermo Fisher Scientific, Waltham, MA) for 2 × 30 s at 6,800 rpm. Two centrifugation steps were used to remove glass beads and cell debris. The supernatant was used for the following analysis.
Protein extracts (250 µg) were digested with trypsin as described by Muntel et al. (71); this was followed by a desalting step via stage tips using a standard protocol described by Rappsilber et al. (72). For absolute quantification, an internal standard protein (tryptic digest of alcohol dehydrogenase; Waters, Milford, MA) was used to spike the samples at a final concentration of 50 fmol/µl.
Data acquisition via LC-IMSE setup.
Peptide samples were analyzed with a nanoACQUITY ultraperformance liquid chromatography (UPLC) system (Waters) coupled to a Synapt G2 mass spectrometer (Waters). For each sample condition, three biological replicates were acquired with three technical replicates each. The samples were loaded directly onto the analytical column (nanoACQUITY UPLC column, BEH130 C18, 1.7 µm, 75 by 200 mm; Waters) with 99% buffer A (1% acetic acid), 1% buffer B (1% acetic acid in acetonitrile) at a flow rate of 300 nl/min within 35 min. Separation of peptides was achieved in 165 min by applying the following gradient: to 18% buffer B in 102 min, to 26% buffer B in 22 min, to 99% buffer B in 16 min, at 99% buffer B for 10 min, and equilibration for 15 min with 99% buffer A. The Synapt G2 mass spectrometer (Waters) was equipped with a NanoLockSpray source in positive mode and operated with the MassLynx V 4.1 software (Waters). The analyzer was set to resolution mode and operated with the ion mobility separation. For analysis of peptide ions, a mass range of 50 to 2,000 Da Th was used, low-energy (MS) scans were set to 4 V (collision energy [CE]), for elevated-energy ion MS (IMSE) scans, the CE was ramped from 25 to 40 V, the scan time was set to 1 s, the wave velocity was ramped from 1,000 to 400 m/s, and the wave height was set to 40 V. For lock mass correction, [Glu1]-fibrinopeptide B solution (m/z 785.8426 Da, 500 fmol/µl in 50% [vol/vol] acetonitrile–0.1% [vol/vol] formic acid) was constantly infused at a flow rate of 500 nl/min and scans were acquired at intervals of 30 s.
Analysis of LC-IMSE data.
For identification and quantification of proteins, raw data were imported into ProteinLynx Global Server (PLGS) 2.5.3 and processed via an Apex3D algorithm. The following processing parameters were used. The chromatographic peak width and MS time-of-flight resolution were set to automatic, the lock mass for charge 2 was 785.8426 Da/e, the lock mass window was 0.25 Da, the low-energy threshold was 250 counts, the elevated-energy threshold was 30 counts, the retention time window was set to automatic, and the precursor/fragment ion cluster intensity threshold was 1,000 counts. A database search was carried out by the ion accounting algorithm implemented in PLGS (67) by using a database that consisted of 4,628 E. coli O78-9 entries in a raw database (73–75; Huja et al., unpublished data) and 51,767 human entries in a human reviewed database uploaded from UniProtKB. This database was complemented with common laboratory contaminants and the yeast ADH1 sequence. The following parameters were used for positive protein identification. The peptide tolerance was set to automatic; the protein tolerance was set to automatic; the minimum number of fragment ion matches per peptide was set to 1; the minimum number of fragment ion matches per protein was set to 5; the minimum number of peptide matches per protein was set to 1; the primary digest reagent was trypsin; the number of missed cleavages was 2; the variable modifications were carbamidomethylation C (+57.0215), deamidation N, Q (+0.9840), and oxidation M (+15.9949); the false-discovery rate (FDR) was 5%; and the calibration protein was yeast ADH1.
All of the proteins identified in only one or two of the nine replicates (three technical replicates of each of the three biological replicates) of a sample were discarded. This filter procedure has revealed protein results with an FDR of <2% on the protein level. Proteins were considered to have significant expression differences if they showed at least a 2-fold change in serum or inactivated serum relative to the MOPS control. Only genes that were detected by both LC-IMSE and RNA-seq were used for the comparison of mRNA levels and protein abundance.
SUPPLEMENTAL MATERIAL
Effects of active and inactive serum on protein levels. Protein levels were determined as described in Materials and Methods. Download
ACKNOWLEDGMENTS
This project was supported by a DIP grant from the German-Israeli Project Cooperation (RO 2612/1-1), by the EC Network of Excellence EuroPathoGenomics (CEE LSHB-CT-2005-512061), by the ERA-NET Pathogenomics project COLIRISK, by the EMIDA ERA-NET project CombatColiBacillosis (grant 0316039), and by the Israeli Ministry of Health. Support was also obtained from ERC-StG 260432 (to R.S.) and ISF grant 1303/12 (to R.S.). We thank the Alfried Krupp Kolleg for awarding a fellowship to S.H.
Footnotes
Citation Huja S, Oren Y, Biran D, Meyer S, Dobrindt U, Bernhard J, Becher D, Hecker M, Sorek R, Ron EZ. 2014. Fur is the master regulator of the extraintestinal pathogenic Escherichia coli response to serum. mBio 5(4):e01460-14. doi:10.1128/mBio.01460-14.
REFERENCES
- 1. Bearman GM, Wenzel RP. 2005. Bacteremias: a leading cause of death. Arch. Med. Res. 36:646–659. 10.1016/j.arcmed.2005.02.005 [DOI] [PubMed] [Google Scholar]
- 2. Dombrovskiy VY, Martin AA, Sunderram J, Paz HL. 2007. Rapid increase in hospitalization and mortality rates for severe sepsis in the United States: a trend analysis from 1993 to 2003. Crit. Care Med. 35:1244–1250. 10.1097/01.CCM.0000261890.41311.E9 [DOI] [PubMed] [Google Scholar]
- 3. Weinberg ED. 2009. Iron availability and infection. Biochim. Biophys. Acta 1790:600–605. 10.1016/j.bbagen.2008.07.002 [DOI] [PubMed] [Google Scholar]
- 4. Holden KM, Browning GF, Noormohammadi AH, Markham PF, Marenda MS. 2012. TonB is essential for virulence in avian pathogenic Escherichia coli. Comp. Immunol. Microbiol. Infect. Dis. 35:129–138. 10.1016/j.cimid.2011.12.004 [DOI] [PubMed] [Google Scholar]
- 5. Reeves SA, Torres AG, Payne SM. 2000. TonB is required for intracellular growth and virulence of Shigella dysenteriae. Infect. Immun. 68:6329–6336. 10.1128/IAI.68.11.6329-6336.2000 [DOI] [PMC free article] [PubMed] [Google Scholar]
- 6. Gorbacheva VY, Faundez G, Godfrey HP, Cabello FC. 2001. Restricted growth of Ent(−) and tonB mutants of Salmonella enterica serovar Typhi in human Mono Mac 6 monocytic cells. FEMS Microbiol. Lett. 196:7–11. 10.1016/S0378-1097(01)00026-X [DOI] [PubMed] [Google Scholar]
- 7. Torres VJ, Attia AS, Mason WJ, Hood MI, Corbin BD, Beasley FC, Anderson KL, Stauff DL, McDonald WH, Zimmerman LJ, Friedman DB, Heinrichs DE, Dunman PM, Skaar EP. 2010. Staphylococcus aureus fur Regulates the expression of virulence factors that contribute to the pathogenesis of pneumonia. Infect. Immun. 78:1618–1628. 10.1128/IAI.01423-09 [DOI] [PMC free article] [PubMed] [Google Scholar]
- 8. Takase H, Nitanai H, Hoshino K, Otani T. 2000. Requirement of the Pseudomonas aeruginosa tonB gene for high-affinity iron acquisition and infection. Infect. Immun. 68:4498–4504. 10.1128/IAI.68.8.4498-4504.2000 [DOI] [PMC free article] [PubMed] [Google Scholar]
- 9. Samant S, Lee H, Ghassemi M, Chen J, Cook JL, Mankin AS, Neyfakh AA. 2008. Nucleotide biosynthesis is critical for growth of bacteria in human blood. PLoS Pathog. 4(2):e37. 10.1371/journal.ppat.0040037 [DOI] [PMC free article] [PubMed] [Google Scholar]
- 10. Phan MD, Peters KM, Sarkar S, Lukowski SW, Allsopp LP, Moriel DG, Achard ME, Totsika M, Marshall VM, Upton M, Beatson SA, Schembri MA. 2013. The serum resistome of a globally disseminated multidrug resistant uropathogenic clone. PLoS Genet. 9(10):e1003834. 10.1371/journal.pgen.1003834 [DOI] [PMC free article] [PubMed] [Google Scholar]
- 11. Reeves P. 1995. Role of O-antigen variation in the immune response. Trends Microbiol. 3:381–386. 10.1016/S0966-842X(00)88983-0 [DOI] [PubMed] [Google Scholar]
- 12. Grozdanov L, Zähringer U, Blum-Oehler G, Brade L, Henne A, Knirel YA, Schombel U, Schulze J, Sonnenborn U, Gottschalk G, Hacker J, Rietschel ET, Dobrindt U. 2002. A single nucleotide exchange in the wzy gene is responsible for the semirough O6 lipopolysaccharide phenotype and serum sensitivity of Escherichia coli strain Nissle 1917. J. Bacteriol. 184:5912–5925. 10.1128/JB.184.21.5912-5925.2002 [DOI] [PMC free article] [PubMed] [Google Scholar]
- 13. Serruto D, Rappuoli R, Scarselli M, Gros P, van Strijp JA. 2010. Molecular mechanisms of complement evasion: learning from staphylococci and meningococci. Nat. Rev. Microbiol. 8:393–399. 10.1038/nrmicro2366 [DOI] [PubMed] [Google Scholar]
- 14. Mehlan H, Schmidt F, Weiss S, Schüler J, Fuchs S, Riedel K, Bernhardt J. 2013. Data visualization in environmental proteomics. Proteomics 13:2805–2821. 10.1002/pmic.201300167 [DOI] [PubMed] [Google Scholar]
- 15. Otto A, Bernhardt J, Meyer H, Schaffer M, Herbst FA, Siebourg J, Mäder U, Lalk M, Hecker M, Becher D. 2010. Systems-wide temporal proteomic profiling in glucose-starved Bacillus subtilis. Nat. Commun 1:137. 10.1038/ncomms1137 [DOI] [PMC free article] [PubMed] [Google Scholar]
- 16. Breazeale SD, Ribeiro AA, Raetz CR. 2002. Oxidative decarboxylation of UDP-glucuronic acid in extracts of polymyxin-resistant Escherichia coli. Origin of lipid A species modified with 4-amino-4-deoxy-l-arabinose. J. Biol. Chem. 277:2886–2896. 10.1074/jbc.M109377200 [DOI] [PubMed] [Google Scholar]
- 17. Breazeale SD, Ribeiro AA, Raetz CR. 2003. Origin of lipid A species modified with 4-amino-4-deoxy-l-arabinose in polymyxin-resistant mutants of Escherichia coli. An aminotransferase (ArnB) that generates UDP-4-deoxyl-l-arabinose. J. Biol. Chem. 278:24731–24739. 10.1074/jbc.M304043200 [DOI] [PubMed] [Google Scholar]
- 18. Yan A, Guan Z, Raetz CR. 2007. An undecaprenyl phosphate-aminoarabinose flippase required for polymyxin resistance in Escherichia coli. J. Biol. Chem. 282:36077–36089. 10.1074/jbc.M706172200 [DOI] [PMC free article] [PubMed] [Google Scholar]
- 19. Lee LJ, Barrett JA, Poole RK. 2005. Genome-wide transcriptional response of chemostat-cultured Escherichia coli to zinc. J. Bacteriol. 187:1124–1134. 10.1128/JB.187.3.1124-1134.2005 [DOI] [PMC free article] [PubMed] [Google Scholar]
- 20. Nagasawa S, Ishige K, Mizuno T. 1993. Novel members of the two-component signal transduction genes in Escherichia coli. J. Biochem. 114:350–357 [DOI] [PubMed] [Google Scholar]
- 21. Kim I, Kim J, Min B, Lee C, Park C. 2007. Screening of genes related to methylglyoxal susceptibility. J. Microbiol. 45:339–343 [PubMed] [Google Scholar]
- 22. Li G, Laturnus C, Ewers C, Wieler LH. 2005. Identification of genes required for avian Escherichia coli septicemia by signature-tagged mutagenesis. Infect. Immun. 73:2818–2827. 10.1128/IAI.73.5.2818-2827.2005 [DOI] [PMC free article] [PubMed] [Google Scholar]
- 23. Lawley TD, Chan K, Thompson LJ, Kim CC, Govoni GR, Monack DM. 2006. Genome-wide screen for Salmonella genes required for long-term systemic infection of the mouse. PLoS Pathog. 2(2):e11. 10.1371/journal.ppat.0020011 [DOI] [PMC free article] [PubMed] [Google Scholar]
- 24. Fernández De Henestrosa AR, Ogi T, Aoyagi S, Chafin D, Hayes JJ, Ohmori H, Woodgate R. 2000. Identification of additional genes belonging to the LexA regulon in Escherichia coli. Mol. Microbiol. 35:1560–1572. 10.1046/j.1365-2958.2000.01826.x [DOI] [PubMed] [Google Scholar]
- 25. Dufour A, Furness RB, Hughes C. 1998. Novel genes that upregulate the Proteus mirabilis flhDC master operon controlling flagellar biogenesis and swarming. Mol. Microbiol. 29:741–752. 10.1046/j.1365-2958.1998.00967.x [DOI] [PubMed] [Google Scholar]
- 26. Beloin C, Valle J, Latour-Lambert P, Faure P, Kzreminski M, Balestrino D, Haagensen JA, Molin S, Prensier G, Arbeille B, Ghigo JM. 2004. Global impact of mature biofilm lifestyle on Escherichia coli K-12 gene expression. Mol. Microbiol. 51:659–674. 10.1046/j.1365-2958.2003.03865.x [DOI] [PubMed] [Google Scholar]
- 27. Zhai Y, Saier MH., Jr. 2002. The beta-barrel finder (BBF) program, allowing identification of outer membrane beta-barrel proteins encoded within prokaryotic genomes. Protein Sci. 11:2196–2207. 10.1110/ps.0209002 [DOI] [PMC free article] [PubMed] [Google Scholar]
- 28. Kannan G, Wilks JC, Fitzgerald DM, Jones BD, Bondurant SS, Slonczewski JL. 2008. Rapid acid treatment of Escherichia coli: transcriptomic response and recovery. BMC Microbiol. 8:37. 10.1186/1471-2180-8-37 [DOI] [PMC free article] [PubMed] [Google Scholar]
- 29. Vassinova N, Kozyrev D. 2000. A method for direct cloning of Fur-regulated genes: identification of seven new Fur-regulated loci in Escherichia coli. Microbiology 146:3171–3182 [DOI] [PubMed] [Google Scholar]
- 30. Karjalainen TK, Evans DG, Evans DJ, Jr, Graham DY, Lee CH. 1991. Iron represses the expression of CFA/I fimbriae of enterotoxigenic E. coli. Microb. Pathog. 11:317–323. 10.1016/0882-4010(91)90017-5 [DOI] [PubMed] [Google Scholar]
- 31. Wu Y, Outten FW. 2009. IscR controls iron-dependent biofilm formation in Escherichia coli by regulating type I fimbria expression. J. Bacteriol. 191:1248–1257. 10.1128/JB.01086-08 [DOI] [PMC free article] [PubMed] [Google Scholar]
- 32. Bougdour A, Cunning C, Baptiste PJ, Elliott T, Gottesman S. 2008. Multiple pathways for regulation of sigmas (RpoS) stability in Escherichia coli via the action of multiple anti-adaptors. Mol. Microbiol. 68:298–313. 10.1111/j.1365-2958.2008.06146.x [DOI] [PubMed] [Google Scholar]
- 33. Battesti A, Tsegaye YM, Packer DG, Majdalani N, Gottesman S. 2012. H-NS regulation of IraD and IraM antiadaptors for control of RpoS degradation. J. Bacteriol. 194:2470–2478. 10.1128/JB.00132-12 [DOI] [PMC free article] [PubMed] [Google Scholar]
- 34. Niederhoffer EC, Naranjo CM, Bradley KL, Fee JA. 1990. Control of Escherichia coli superoxide dismutase (sodA and sodB) genes by the ferric uptake regulation (fur) locus. J. Bacteriol. 172:1930–1938 [DOI] [PMC free article] [PubMed] [Google Scholar]
- 35. Miajlovic H, Cooke NM, Moran GP, Rogers TR, Smith SG. 2014. The response of extraintestinal pathogenic Escherichia coli to human serum reveals a protective role for Rcs-regulated exopolysaccharide colanic acid. Infect. Immun. 82:298–305. 10.1128/IAI.00800-13 [DOI] [PMC free article] [PubMed] [Google Scholar]
- 36. Tao H, Bausch C, Richmond C, Blattner FR, Conway T. 1999. Functional genomics: expression analysis of Escherichia coli growing on minimal and rich media. J. Bacteriol. 181:6425–6440 [DOI] [PMC free article] [PubMed] [Google Scholar]
- 37. Thompson GA. 1992. Dosage regimen design: a pharmacokinetic approach. J. Clin. Pharmacol. 32:210–214. 10.1002/j.1552-4604.1992.tb03828.x [DOI] [PubMed] [Google Scholar]
- 38. Born J, Bhakdi S. 1986. Does complement kill E. coli by producing transmural pores? Immunology 59:139–145 [PMC free article] [PubMed] [Google Scholar]
- 39. Jann K, Jann B. 1991. Biochemistry and expression of bacterial capsules. Biochem. Soc. Trans. 19:623–628 [DOI] [PubMed] [Google Scholar]
- 40. Westermann AJ, Gorski SA, Vogel J. 2012. Dual RNA-seq of pathogen and host. Nat. Rev. Microbiol. 10:618–630. 10.1038/nrmicro2852 [DOI] [PubMed] [Google Scholar]
- 41. Salgado H, Peralta-Gil M, Gama-Castro S, Santos-Zavaleta A, Muñiz-Rascado L, García-Sotelo JS, Weiss V, Solano-Lira H, Martínez-Flores I, Medina-Rivera A, Salgado-Osorio G, Alquicira-Hernández S, Alquicira-Hernández K, López-Fuentes A, Porrón-Sotelo L, Huerta AM, Bonavides-Martínez C, Balderas-Martínez YI, Pannier L, Olvera M, Labastida A, Jiménez-Jacinto V, Vega-Alvarado L, Del Moral-Chávez V, Hernández-Alvarez A, Morett E, Collado-Vides J. 2013. RegulonDB v8.0: omics data sets, evolutionary conservation, regulatory phrases, cross-validated gold standards and more. Nucleic Acids Res. 41:D203–D213. 10.1093/nar/gkt1054 [DOI] [PMC free article] [PubMed] [Google Scholar]
- 42. D’Autreaux B, Touati D, Bersch B, Latour JM, Michaud-Soret I. 2002. Direct inhibition by nitric oxide of the transcriptional ferric uptake regulation protein via nitrosylation of the iron. Proc. Natl. Acad. Sci. U. S. A. 99:16619–16624. 10.1073/pnas.252591299 [DOI] [PMC free article] [PubMed] [Google Scholar]
- 43. de Lorenzo V, Wee S, Herrero M, Neilands JB. 1987. Operator sequences of the aerobactin operon of plasmid ColV-K30 binding the ferric uptake regulation (fur) repressor. J. Bacteriol. 169:2624–2630 [DOI] [PMC free article] [PubMed] [Google Scholar]
- 44. Griggs DW, Konisky J. 1989. Mechanism for iron-regulated transcription of the Escherichia coli cir gene: metal-dependent binding of Fur protein to the promoters. J. Bacteriol. 171:1048–1054 [DOI] [PMC free article] [PubMed] [Google Scholar]
- 45. Hantke K. 2001. Iron and metal regulation in bacteria. Curr. Opin. Microbiol. 4:172–177. 10.1016/S1369-5274(00)00184-3 [DOI] [PubMed] [Google Scholar]
- 46. Mills SA, Marletta MA. 2005. Metal binding characteristics and role of iron oxidation in the ferric uptake regulator from Escherichia coli. Biochemistry 44:13553–13559. 10.1021/bi0507579 [DOI] [PubMed] [Google Scholar]
- 47. Cheng D, Zhu S, Su Z, Zuo W, Lu H. 2012. Prevalence and isoforms of the pathogenicity island ETT2 among Escherichia coli isolates from colibacillosis in pigs and mastitis in cows. Curr. Microbiol. 64:43–49. 10.1007/s00284-011-0032-0 [DOI] [PubMed] [Google Scholar]
- 48. McHugh JP, Rodríguez-Quinoñes F, Abdul-Tehrani H, Svistunenko DA, Poole RK, Cooper CE, Andrews SC. 2003. Global iron-dependent gene regulation in Escherichia coli: a new mechanism for iron homeostasis. J. Biol. Chem. 278:29478–29486. 10.1074/jbc.M303381200 [DOI] [PubMed] [Google Scholar]
- 49. Lee JW, Helmann JD. 2007. Functional specialization within the Fur family of metalloregulators. Biometals 20:485–499. 10.1007/s10534-006-9070-7 [DOI] [PubMed] [Google Scholar]
- 50. Lee HJ, Bang SH, Lee KH, Park SJ. 2007. Positive regulation of fur gene expression via direct interaction of fur in a pathogenic bacterium, Vibrio vulnificus. J. Bacteriol. 189:2629–2636. 10.1128/JB.01791-06 [DOI] [PMC free article] [PubMed] [Google Scholar]
- 51. Chen Z, Lewis KA, Shultzaberger RK, Lyakhov IG, Zheng M, Doan B, Storz G, Schneider TD. 2007. Discovery of Fur binding site clusters in Escherichia coli by information theory models. Nucleic Acids Res. 35:6762–6777. 10.1093/nar/gkm631 [DOI] [PMC free article] [PubMed] [Google Scholar]
- 52. Mey AR, Wyckoff EE, Kanukurthy V, Fisher CR, Payne SM. 2005. Iron and fur regulation in Vibrio cholerae and the role of fur in virulence. Infect. Immun. 73:8167–8178. 10.1128/IAI.73.12.8167-8178.2005 [DOI] [PMC free article] [PubMed] [Google Scholar]
- 53. Torres VJ, Attia AS, Mason WJ, Hood MI, Corbin BD, Beasley FC, Anderson KL, Stauff DL, McDonald WH, Zimmerman LJ, Friedman DB, Heinrichs DE, Dunman PM, Skaar EP. 2010. Staphylococcus aureus Fur regulates the expression of virulence factors that contribute to the pathogenesis of pneumonia. Infect. Immun. 78:1618–1628. 10.1128/IAI.01423-09 [DOI] [PMC free article] [PubMed] [Google Scholar]
- 54. Grote A, Klein J, Retter I, Haddad I, Behling S, Bunk B, Biegler I, Yarmolinetz S, Jahn D, Münch R. 2009. PRODORIC (release 2009): a database and tool platform for the analysis of gene regulation in prokaryotes. Nucleic Acids Res. 37:D61–D65. 10.1093/nar/gkn837 [DOI] [PMC free article] [PubMed] [Google Scholar]
- 55. Lavrrar JL, McIntosh MA. 2003. Architecture of a Fur binding site: a comparative analysis. J. Bacteriol. 185:2194–2202. 10.1128/JB.185.7.2194-2202.2003 [DOI] [PMC free article] [PubMed] [Google Scholar]
- 56. Bäumler AJ, Norris TL, Lasco T, Voight W, Reissbrodt R, Rabsch W, Heffron F. 1998. IroN, a novel outer membrane siderophore receptor characteristic of Salmonella enterica. J. Bacteriol. 180:1446–1453 [DOI] [PMC free article] [PubMed] [Google Scholar]
- 57. Perry RD, Fetherston JD. 2011. Yersiniabactin iron uptake: mechanisms and role in Yersinia pestis pathogenesis. Microbes Infect. 13:808–817. 10.1016/j.micinf.2011.04.008 [DOI] [PMC free article] [PubMed] [Google Scholar]
- 58. Andrews SC, Robinson AK, Rodríguez-Quiñones F. 2003. Bacterial iron homeostasis. FEMS Microbiol. Rev. 27:215–237. 10.1016/S0168-6445(03)00055-X [DOI] [PubMed] [Google Scholar]
- 59. Carpenter BM, Whitmire JM, Merrell DS. 2009. This is not your mother’s repressor: the complex role of fur in pathogenesis. Infect. Immun. 77:2590–2601. 10.1128/IAI.00116-09 [DOI] [PMC free article] [PubMed] [Google Scholar]
- 60. Echenique-Rivera H, Muzzi A, Del Tordello E, Seib KL, Francois P, Rappuoli R, Pizza M, Serruto D. 2011. Transcriptome analysis of Neisseria meningitidis in human whole blood and mutagenesis studies identify virulence factors involved in blood survival. PLoS Pathog. 7(5):e1002027. 10.1371/journal.ppat.1002027 [DOI] [PMC free article] [PubMed] [Google Scholar]
- 61. Litwin CM, Calderwood SB. 1993. Role of iron in regulation of virulence genes. Clin. Microbiol. Rev. 6:137–149 [DOI] [PMC free article] [PubMed] [Google Scholar]
- 62. Miller JF, Mekalanos JJ, Falkow S. 1989. Coordinate regulation and sensory transduction in the control of bacterial virulence. Science 243:916–922. 10.1126/science.2537530 [DOI] [PubMed] [Google Scholar]
- 63. Alteri CJ, Smith SN, Mobley HL. 2009. Fitness of Escherichia coli during urinary tract infection requires gluconeogenesis and the TCA cycle. PLoS Pathog. 5(5):e1000448. 10.1371/journal.ppat.1000448 [DOI] [PMC free article] [PubMed] [Google Scholar]
- 64. Tomenius H, Pernestig AK, Jonas K, Georgellis D, Möllby R, Normark S, Melefors O. 2006. The Escherichia coli BarA-UvrY two-component system is a virulence determinant in the urinary tract. BMC Microbiol. 6:27. 10.1186/1471-2180-6-27 [DOI] [PMC free article] [PubMed] [Google Scholar]
- 65. Pernestig AK, Georgellis D, Romeo T, Suzuki K, Tomenius H, Normark S, Melefors O. 2003. The Escherichia coli BarA-UvrY two-component system is needed for efficient switching between glycolytic and gluconeogenic carbon sources. J. Bacteriol. 185:843–853. 10.1128/JB.185.3.843-853.2003 [DOI] [PMC free article] [PubMed] [Google Scholar]
- 66. Zdziarski J, Brzuszkiewicz E, Wullt B, Liesegang H, Biran D, Voigt B, Grönberg-Hernandez J, Ragnarsdottir B, Hecker M, Ron EZ, Daniel R, Gottschalk G, Hacker J, Svanborg C, Dobrindt U. 2010. Host imprints on bacterial genomes—rapid, divergent evolution in individual patients. PLoS Pathog. 6(8):e1001078. 10.1371/journal.ppat.1001078 [DOI] [PMC free article] [PubMed] [Google Scholar]
- 67. He S, Wurtzel O, Singh K, Froula JL, Yilmaz S, Tringe SG, Wang Z, Chen F, Lindquist EA, Sorek R, Hugenholtz P. 2010. Validation of two ribosomal RNA removal methods for microbial metatranscriptomics. Nat. Methods 7:807–812. 10.1038/nmeth.1507 [DOI] [PubMed] [Google Scholar]
- 68. Croucher NJ, Thomson NR. 2010. Studying bacterial transcriptomes using RNA-seq. Curr. Opin. Microbiol. 13:619–624. 10.1016/j.mib.2010.09.009 [DOI] [PMC free article] [PubMed] [Google Scholar]
- 69. Datsenko KA, Wanner BL. 2000. One-step inactivation of chromosomal genes in Escherichia coli K-12 using PCR products. Proc. Natl. Acad. Sci. U. S. A. 97:6640–6645. 10.1073/pnas.120163297 [DOI] [PMC free article] [PubMed] [Google Scholar]
- 70. Finn RD, Clements J, Eddy SR. 2011. HMMER web server: interactive sequence similarity searching. Nucleic Acids Res. 39:W29–W37. 10.1093/nar/gkr367 [DOI] [PMC free article] [PubMed] [Google Scholar]
- 71. Muntel J, Hecker M, Becher D. 2012. An exclusion list based label-free proteome quantification approach using an LTQ Orbitrap. Rapid Commun. Mass Spectrom. 26:701–709. 10.1002/rcm.6147 [DOI] [PubMed] [Google Scholar]
- 72. Rappsilber J, Mann M, Ishihama Y. 2007. Protocol for micro-purification, enrichment, pre-fractionation and storage of peptides for proteomics using StageTips. Nat. Protoc. 2:1896–1906. 10.1038/nprot.2007.261 [DOI] [PubMed] [Google Scholar]
- 73. Dziva F, Hauser H, Connor TR, van Diemen PR, Prescott G, Chaudhuri RR, Ewers C, Mellata M, Mukhopadhyay S, Curtiss R, III, Dougan G, Wieler LH, Thomson NR, Pickard DJ, Stevens MP. 2013. Sequencing and functional annotation of avian pathogenic Escherichia coli serogroup O78 strains reveals the evolution of E. coli lineages pathogenic for poultry via distinct mechanisms. Infect. Immun. 81:838–849. 10.1128/IAI.00585-12 [DOI] [PMC free article] [PubMed] [Google Scholar]
- 74. Mangiamele P, Nicholson B, Wannemuehler Y, Seemann T, Logue CM, Li G, Tivendale KA, Nolan LK. 2013. Complete genome sequence of the avian pathogenic Escherichia coli strain APEC O78. Genome Announc. 1(2):e0002613. 10.1128/genomeA.00026-13 [DOI] [PMC free article] [PubMed] [Google Scholar]
- 75. Mellata M, Touchman JW, Curtiss R. 2009. Full sequence and comparative analysis of the plasmid pAPEC-1 of avian pathogenic E. coli χ7122 (O78:K80:H9). PLoS One 4(1):e4232. 10.1371/journal.pone.0004232 [DOI] [PMC free article] [PubMed] [Google Scholar]
- 76. Guzman L-M, Belin D, Carson MJ, Beckwith J. 1995. Tight regulation, modulation, and high-level expression by vectors containing the arabinose PBAD promoter. J. Bacteriol. 177:4121–4130 [DOI] [PMC free article] [PubMed] [Google Scholar]
Associated Data
This section collects any data citations, data availability statements, or supplementary materials included in this article.
Supplementary Materials
Effects of active and inactive serum on protein levels. Protein levels were determined as described in Materials and Methods. Download