

Abstract
Background
We have shown that low nephron number (Nglom) is a strong determinant of individual glomerular volume (IGV) in male Americans. However, whether the same pattern is present in female Americans remains unclear. The contributions of body surface area (BSA) and race to IGV in the context of Nglom also require further evaluation.
Methods
Kidneys without overt renal disease were collected at autopsy in Mississippi, USA. The extremes of female Nglom were used to define high and low Nglom for both sexes. Nglom and IGV were estimated by design-based stereology. A total of 24 African and Caucasian American females (n = 12 per race; 6 per Nglom extreme) were included. These subjects were subsequently matched to 24 comparable males by age and Nglom and to 18 additional males by age, Nglom and BSA.
Results
IGV average and variance were very similar in female African and Caucasian Americans with high and low Nglom. Males with low Nglom from both races showed greater IGV average and variance than comparable females matched by age and Nglom. These differences in IGV between sexes were not observed in Caucasian Americans with low Nglom that were matched by age, Nglom and BSA. In contrast, glomeruli from African Americans were larger than those from Caucasian Americans, especially in subjects with high Nglom.
Conclusions
While female Americans with low Nglom did not show glomerular hypertrophy, comparable males with low Nglom showed marked glomerular hypertrophy that was closely associated with high BSA. Glomerular size in African Americans may be confounded by multiple additional factors.
Keywords: body size, glomerular hypertrophy, nephron number, race, sex
INTRODUCTION
Chronic kidney disease (CKD) is a major health problem worldwide [1, 2]. To date, early detection based on screening of high risk patients and effective early intervention are the best approaches to delay CKD development and progression [3].
It has been suggested that subjects with low total nephron number (Nglom) may be at greater risk of kidney disease [4–8]. According to the hyperfiltration theory [9], low Nglom—whether congenital or acquired—results in compensatory hypertrophy of remaining glomeruli in order to match physiological requirements and sustain renal function. Initially, glomerular hypertrophy appears to be an appropriate compensatory response. However, there is a point at which hypertrophy is unsustainable, leading to glomerulosclerosis, proteinuria and reduced renal function [5]. Interestingly, glomerular hypertrophy has pivotal roles in the development of focal and segmental glomerulosclerosis [10, 11] and the progression of diabetic nephropathy [12–14], two of the most common causes of CKD. While the boundary between adaptive and pathological glomerular hypertrophy remains unclear, efforts to identify risk factors associated with glomerular hypertrophy in subjects without renal disease are essential to characterize this process [15] and develop preventive strategies in the future.
The role of sex in the development and progression of CKD has been widely debated in recent years [16]. A comprehensive meta-analysis by Neugarten et al. [17] concluded that renal disease in women progressed at a slower rate than in men. There is also evidence from several animal models of renal disease, such as aging, renal ablation, hypertension and polycystic kidney disease, in which females are relatively protected from the development of renal pathology compared with males [18].
It has been proposed that structural factors (i.e. Nglom) could explain this relative protection observed in females [19], but so far all findings have failed to support this hypothesis. Our group has reported that if anything, American females have slightly lower Nglom than males [20] and Neugarten et al. [21] showed that despite having similar Nglom between sexes, Danish males had larger glomeruli than females, which was not related to sex and was closely associated with body surface area (BSA), a measure of body size and surrogate marker of renal cortical volume [22, 23]. In multiple autopsy studies, we have consistently shown larger BSA in males than in female Americans [20, 24, 25], which provides a unique opportunity to explore the contribution of BSA to glomerular size.
There are several methods to investigate glomerular size in human kidneys [4]. For example, mean glomerular volume (Vglom) provides a single summary statistic for all glomeruli in the kidney [26, 27]. We have recently been reporting individual glomerular volume (IGV) [28], which provides new insights into glomerular size variability within kidneys. Zimanyi et al. [29] reported that Caucasian American males with low Nglom had greater average IGV and more heterogeneous IGV distributions than comparable subjects with high Nglom, both of which suggested a process of glomerular hypertrophy. Moreover, this study [29] also showed that African American males presented glomerular hypertrophy, even in subjects with robust Nglom. However, it remains unclear if these trends could also be found in females.
The current study provides a unique approach to further understand the role of human compensatory glomerular hypertrophy in pre-disease stages. We hypothesized that people with low Nglom will show glomerular hypertrophy when physiological demands (represented by BSA) cannot be met by the existing number of nephrons (represented by Nglom); a scenario that is characterized by a combination of low Nglom and high BSA. Two aims were defined: (i) to evaluate for the first time IGV estimates between extremes of Nglom in female African and Caucasian Americans, a cohort with innate low BSA; and (ii) to compare IGV distributions between sexes in the context of Nglom, BSA and race.
MATERIALS AND METHODS
Tissue collection and subject selection
Kidneys were collected during autopsies performed at the University of Mississippi Medical Center, Jackson, MS, USA [24, 25] with the approval of the Institutional Review Board of the University of Mississippi Medical Center and the Monash University Human Research Ethics Committee. Subjects were included if their kidneys were of approximately equal size and showed grossly normal or mild-to-moderate arteriolonephrosclerosis with a uniform granular subcapsular cortex. Kidneys from patients with diabetes were analysed if they showed mild-to-moderate arteriolonephrosclerosis but were excluded if there was microscopic evidence of diabetic nephropathy. Based on this, two diabetic Caucasian Americans were included in this study. Furthermore, kidneys were excluded if coarse pits or any angular or depressed cortical scars were found. Kidneys from patients who had clinically diagnosed kidney disease and/or diagnosed congenital abnormalities (i.e. congenital heart disease) were also excluded.
Extremes of Nglom were defined based on the best possible pairing between extreme quintiles within 77 African Americans and 52 Caucasian Americans. High Nglom was defined as ≥1.0 million glomeruli and low Nglom as ≤0.66 million glomeruli. A total of 24 females, including 12 African and 12 Caucasian Americans (6 with high and 6 with low Nglom) were selected for analysis. These subjects were carefully age-matched within each race and represented our matching reference group for the rest of the study. Next, we analysed IGV average and variance between comparable females and males. Because the extremes of Nglom distributions were different between sexes, we were not able to compare strict extremes of Nglom. Therefore, males were matched to females within each race only by age and Nglom; a matching strategy referred to as model 1. To account for differences in BSA between sexes, we selected additional males and matched them to females within each race by age, Nglom and BSA; a matching strategy referred to as model 2. Multiple selection criteria for models 1 and 2 did not allow a higher sample size per group. A total of 66 subjects were included in this study (n = 32 for African Americans and n = 34 for Caucasian Americans), including all females and males.
Demographic data
General demographic data, including age, race, sex, height, body weight, medical history (i.e. history of diabetes or hypertension), blood pressure (BP) and medical treatment (i.e. prescribed anti-hypertensive medication) were all obtained from the medical records and forensic reports. Body mass index (BMI) was calculated based on weight and height [30] at the time of autopsy. BSA was calculated using the Mosteller equation [31]. BP from terminal hospital admissions was not used unless patients were diagnosed as hypertensive and BP was consistently elevated. Mean arterial blood pressure (MAP) was calculated from an average of at least three blood pressure measurements and was only available for 45 patients. Hypertension status was defined as hypertensive or normotensive based on pathology findings (i.e. presence of cardiomegaly and severity of intrarenal arteriosclerosis), and medical records (i.e. history of hypertension and consistently elevated BP ≥140/90 mmHg) [20, 25, 32].
Design-based stereology
Design-based stereology was performed at Monash University. Nglom was estimated in all 66 subjects as described previously [20, 24–26, 33–35] applying a combination of systematic uniform random sampling and the physical disector/fractionator combination. Some of the male IGV values have previously been published [15, 28, 29, 36–38].
Formalin-fixed tissue from female kidneys (n = 24) stored at Monash University was used for glomerular sampling. Mid-hilar kidney slices of 1 cm × 1 cm × 1 mm were embedded in glycol methacrylate (Technovit 7100, Heraeus Kulzer, Germany) and serially sectioned at 10 µm. Every second section was stained with periodic acid Schiff (PAS). Thirty glomeruli per subject were sampled (10 from each cortical zone: superficial, middle and juxtamedullary) using the disector principle [39]. IGV was calculated using the Cavalieri estimator [40]. In short, virtual images were obtained with an Olympus DotSlide system (Olympus Soft Imaging, Tokyo, Japan) equipped with a 20× objective lens and a monochrome slide Peltier cooled digital camera at Monash Micro Imaging. The areas of glomerular tufts were measured by point counting using an orthogonal grid placed over each glomerular profile. Grid size and total magnification were calibrated before each measurement and adjusted to obtain at least 100 grid points per glomerulus [28].
Statistical analysis
Data were analysed using GraphPad Prism version 5.04 for Windows (La Jolla, CA, USA) and Stata version 12.1 (Statistical Software; College Station, TX, USA: StataCorp LP). Values are expressed as median ± inter quartile range (IQR) unless otherwise stated. In order to take into account variability within and between subjects, we applied a mixed-effects regression analysis to compare IGV between groups. To reduce potential bias, given the small sample sizes, multi-level models employed restricted maximum likelihood estimates of variance. Multiple regression analysis was also conducted to assess predictors of mean IGV such as race, sex, BSA, BMI, Nglom, hypertension status, MAP and anti-hypertensive treatment. A logistic regression analysis was applied to assess predictors of hypertensive status, including age, race, sex, age, BSA and Nglom. Associations between two variables were tested by the Spearman rank coefficient and Kruskal–Wallis test, with Dunn's post hoc test applied for multiple comparisons. A probability (P) less than 0.05 was considered statistically significant.
RESULTS
General demographics in female subjects
Table 1 shows general demographic data for the age-matched female subjects (matched within a maximum of 6 years), including age, BSA, BMI, hypertensive status and Nglom. While median age was 38 years for African Americans, it was 45.5 years for Caucasian American females (P > 0.05). On the basis of BMI, 25% of African American females were obese and 50% were overweight, while 25% of Caucasian American females were obese, but only 17% were overweight. Overall, BSA was higher in African Americans than Caucasian Americans in combined data from both Nglom groups within each race (P = 0.01). Among females with low Nglom, the frequency of hypertensive subjects was 67% for African Americans and 33% for Caucasian Americans.
Table 1.
Age-matched female subject pairs in African and Caucasian Americans
| High Nglom |
Low Nglom |
|||||||
|---|---|---|---|---|---|---|---|---|
| Pairs | Age | BSA | BMI | Nglom | Age | BSA | BMI | Nglom |
| (years) | (m2) | (Kg/m2) | (million) | (years) | (m2) | (Kg/m2) | (million) | |
| African Americans (n = 12) | ||||||||
| 1 | 23 | 2.19 | 38.01 | 1.13 | 24 | 1.71 | 23.36 | 0.51 |
| 2 | 29 | 2.2 | 37.1 | 1.11 | 29 | 1.95 | 25.47 | 0.64 |
| 3 | 37 | 1.68 | 17.59 | 1.2 | 37 | 1.89 | 27.41 | 0.54 |
| 4 | 39 | 1.88 | 25.92 | 1.63 | 40 | 1.98 | 28.24 | 0.62 |
| 5 | 49 | 1.73 | 24.77 | 1.07 | 49 | 1.91 | 27.61 | 0.66 |
| 6 | 50 | 2.14 | 36.69 | 1.18 | 51 | 2.14 | 28.72 | 0.56 |
| Median | 38 | 2.01 | 31.31 | 1.16 | 38.5NS | 1.93NS | 27.51NS | 0.59*** |
| (IQR) | (28–49) | (1.7–2.2) | (22.9–37.3) | (1.1–1.3) | (28–50) | (1.8–2.0) | (24.9–28.4) | (0.5–0.6) |
| Caucasian Americans (n = 12) | ||||||||
| 1 | 30 | 1.67 | 20.18 | 1.08 | 34 | 1.75 | 26.9 | 0.61 |
| 2 | 41 | 1.76 | 23.31 | 1.1 | 41 | 1.65 | 22.58 | 0.43 |
| 3 | 44 | 1.85 | 31.93 | 1 | 42 | 1.46 | 18.98 | 0.29 |
| 4 | 47 | 1.77 | 25.01 | 1.37 | 51 | 2.45 | 51.27 | 0.5 |
| 5 | 47 | 1.71 | 23.36 | 1.2 | 52 | 1.61 | 23.94 | 0.43 |
| 6 | 59 | 1.88 | 31.68 | 1.1 | 65 | 1.67 | 26.46 | 0.49 |
| Median | 45.5 | 1.76 | 24.19 | 1.1 | 46.5NS | 1.66NS | 25.2NS | 0.46**** |
| (IQR) | (38–50) | (1.7–1.9) | (22.5–31.7) | (1.1–1.2) | 39–55 | (1.6–1.9) | (21.7–32.9) | (0.4–0.5) |
Nglom: total nephron number; BSA: body surface area; BMI (body mass index); Pairs: refers to age-matched pairs formed within each race and between Nglom categories; IQR: interquartile range.
****P < 0.0001; ***P < 0.001; NS: not statistically significant—for comparisons within each race and between Nglom categories labels were placed in the Low Nglom column.
First report of individual glomerular volume in female Americans
IGV was highly variable among females, with an 8.2-fold range and a 4.8-fold range between the smallest and largest glomerulus in African and Caucasian Americans, respectively.
Importantly, average IGV and variance were very similar between females with high and low Nglom in both African Americans (P = 0.36 for average and P = 0.26 for variance) and Caucasian Americans (P = 0.35 for average and P = 0.13 for variance).
General demographics for comparisons between sexes
General demographics for female and male groups are provided in Table 2. Briefly, models 1 and 2 (males) were both comparable to females in terms of age and Nglom.
Table 2.
Analysis of general demographics by sex and Nglom in African and Caucasian Americans
| Females |
Model 1 for males (matched to females by age and Nglom) |
Model 2 for males (matched to females by age, Nglom and BSA) |
|||||||||||
|---|---|---|---|---|---|---|---|---|---|---|---|---|---|
| Age (years) |
Nglom (million) |
HTN (proportion; %) |
Rx HTN (proportion; %) |
Age (years) |
Nglom (million) |
HTN (proportion; %) |
Rx HTN (proportion; %) |
Age (years) |
Nglom (million) |
HTN (proportion; %) |
Rx HTN (proportion; %) |
||
| African Americans (n = 32) | High Nglom | 38 | 1.16 | 0/6; 0% | 0/0; 0% | 37.0NS | 1.18NS | 2/6; 33% | 2/6; 33% | 30.5NS | 1.17NS | 2/6; 33% | 2/6; 33% |
| (28–49) | (1.1–1.3) | NA | NA | (27–43) | (1.1–1.3) | NA | NA | (21–43) | (1.1–1.3) | NA | NA | ||
| Low Nglom | 38.5 | 0.59 | 4/6; 67% | 3/6; 50% | 39.0NS | 0.59NS | 4/6; 67% | 3/6; 50% | 40.0NS | 0.53NS | 4/6; 67% | 2/6; 33% | |
| (28–50) | (0.5–0.6) | NA | NA | (35–53) | (0.5–0.6) | NA | NA | (34–54) | (0.5–0.6) | NA | NA | ||
| Caucasian Americans (n = 34) | High Nglom | 45.5 | 1.1 | 0/6; 0% | 0/0; 0% | 44.0NS | 1.11NS | 1/6; 17% | 1/6; 17% | 47.5NS | 1.04NS | 1/6; 17% | 1/6; 17% |
| (38–50) | (1.1–1.2) | NA | NA | (39–59) | (0.9–1.2) | NA | NA | (38–61) | (0.9–1.2) | NA | NA | ||
| Low Nglom | 46.5 | 0.46 | 2/6; 33% | 1/6; 17% | 40.5NS | 0.56NS | 3/6; 50% | 1/6; 17% | 51.5NS | 0.58NS | 3/6; 50% | 3/6; 50% | |
| (39–55) | (0.4–0.5) | NA | NA | (37–48) | (0.3–0.6) | NA | NA | (39–57) | (0.4–0.6) | NA | NA | ||
Values for age and Nglom are expressed as median (inter quartile range). HTN (HTN: hypertensive status) is expressed as a proportion and percentage of hypertensive subjects; Rx HTN (history of prescribed anti-hypertensive medication), which is expressed as a proportion and percentage of subjects receiving anti-hypertensive therapy to control blood pressure; Nglom: total nephron number; NSP > 0.05; all statistical comparisons were performed between females and model 1 for males and between females and model 2 for males; NA, not applicable.
From the total of 66 subjects included in this study, 24 (36%) were defined as hypertensive. From this group, 17 (71%) subjects had a history of prescribed anti-hypertensive medications. Furthermore, hypertensive subjects were more frequent in groups defined by low Nglom in both races and sexes, especially in African Americans, 67% of whom were hypertensive. Details about the proportion and percentage of subjects with a history of prescribed anti-hypertensive medications by sex and race are provided in Table 2.
Body dimensions
Table 3 provides an overview of available measurements of body dimensions, including height, weight, BSA and BMI. Importantly, BSA and BMI were strongly associated (R = 0.83, P < 0.0001).
Table 3.
Analysis of body dimensions by sex and Nglom in African and Caucasian Americans
| Females |
Model 1 for males (matched to females by age and Nglom) |
Model 2 for males (matched to females by age, Nglom and BSA) |
|||||||||||
|---|---|---|---|---|---|---|---|---|---|---|---|---|---|
| Height (cm) |
Weight (Kg) |
BSA (m2) |
BMI (Kg/m2) |
Height (cm) |
Weight (Kg) |
BSA (m2) |
BMI (Kg/m2) |
Height (cm) |
Weight (Kg) |
BSA (m2) |
BMI (Kg/m2) |
||
| African Americans (n = 32) | High Nglom | 165 | 88 | 2.01 | 31.3 | 181* | 102* | 2.28* | 31.5NS | 173NS, & | 79NS, & | 1.99NS,# | 24.8NS, & |
| (163-173) | (64–101) | (1.7–2.2) | (22.9–37.3) | (171–184) | (98–107) | (2.2–2.3) | (28.6–36.3) | (172–179) | (68–94) | (1.8–2.2) | (22.3–31.3) | ||
| Low Nglom | 169 | 78 | 1.93 | 27.5 | 182** | 90* | 2.15* | 27.3NS | 177NS, & | 85NS, & | 2.02NS, & | 26.3NS, & | |
| (167–176) | (74–84) | (1.8–2.0) | (24.9–28.4) | (178–190) | (83–98) | (2.0–2.3) | (25.4–28.5) | (171–181) | (75–91) | (1.9–2.1) | (24.1–30.3) | ||
| Caucasian Americans (n = 34) | High Nglom | 165 | 67 | 1.76 | 24.2 | 181* | 115** | 2.35* | 34.1* | 173NS, & | 71NS,# | 1.82NS,# | 24.9NS,# |
| (157–169) | (63–77) | (1.7–1.9) | (22.5–31.7) | (171–189) | (100–124) | (2.3–2.6) | (32.6–38.8) | (166–176) | (66–87) | (1.8–2.1) | (22.1–29.8) | ||
| Low Nglom | 159 | 62 | 1.66 | 25.2 | 175** | 107* | 2.32* | 34.8NS | 173*,& | 62NS,# | 1.74NS,# | 20.0NS,# | |
| (157–161) | (57–83) | (1.6–1.9) | (21.7–32.9) | (169–186) | (87–142) | (2.0–2.7) | (29.4–44.9) | (169–182) | (53–84) | (1.6–2.1) | (18.1–24.5) | ||
Values are expresses as median (inter quartile range).
BSA, body surface area; BMI, body mass index.
**P < 0.01 and *P < 0.05 in bold and NSP > 0.05 represent comparisons between females and model 1 for males and between females and model 2 for males; an additional comparison between model 1 and model 2 was done and is represented by #P < 0.05 in bold or &P > 0.05.
In model 1, males were taller, heavier and showed higher BSA than females from both races and Nglom categories. However, BMI was very similar between females and males from model 1 in all comparisons, except for Caucasian Americans with high Nglom who showed a significantly greater BMI than females.
Among Caucasian Americans, males from model 2 had very similar height, weight, BSA and BMI than females, but they also showed similar height as males from model 1 (P > 0.05). More importantly, these subjects presented significantly lower weight, BSA and BMI than males from model 1. In contrast, among African Americans, differences in weight, BSA and BMI between males from models 1 and 2 were not sufficient to achieve statistical significance, except in males from model 2 with high Nglom who showed a significant reduction in BSA compared with males from model 1.
Comparison of individual glomerular volume between sexes
Model 1: males matched to females by age and Nglom
IGV was remarkably variable among males from model 1, with a 7.7-fold range and an 11.2-fold range between the smallest and largest glomerulus in African and Caucasian Americans, respectively. Both male African Americans with low Nglom (Figure 1A; P = 0.002) and male Caucasian Americans with low Nglom (Figure 1B; P < 0.001) showed greater average IGV than those with high Nglom. Table 4 shows that average IGV was similar between sexes in subjects with high Nglom. In contrast, in subjects with low Nglom, average IGV was significantly higher in males (P < 0.01 for African Americans and P < 0.001 for Caucasian Americans).
FIGURE 1:

Sex comparisons of individual glomerular volume (IGV) by total nephron number (Nglom) in African and Caucasian Americans. Males were matched to females based on age and Nglom only (model 1). Each circle represents one glomerulus and each column represents aggregated data from 6 subjects per category (30 glomeruli per subject); black circles for African Americans, white circles for Caucasian Americans; grey and black lines represent mean IGV and standard deviation per category.
Table 4.
Summary of individual glomerular volume (IGV) values: sex comparisons in African and Caucasian Americans
| Females |
Model 1 for males (matched to females by age and Nglom) |
Model 2 for males (matched to females by age, Nglom and BSA) |
||||||||
|---|---|---|---|---|---|---|---|---|---|---|
| Smallest IGV ×106 µm3 | Largest IGV ×106 µm3 | Mean IGV (SD) ×106 µm3 | Smallest IGV ×106 µm3 | Largest IGV ×106 µm3 | Mean IGV (SD) ×106 µm3 | Smallest IGV ×106 µm3 | Largest IGV ×106 µm3 | Mean IGV (SD) ×106 µm3 | ||
| African Americans (n = 32) | High Nglom | 2.13 | 8.11 | 4.16 | 1.31 | 10.09 | 4.65NS | 1.39 | 8.2 | 4.74NS |
| (1.25) | (1.34) | (1.56) | ||||||||
| Low Nglom | 0.99 | 7.49 | 4.65 | 1.58 | 9.57 | 6.01** | 1.58 | 8.71 | 5.10NS | |
| (1.14) | (1.34) | (1.42) | ||||||||
| Caucasian Americans (n = 34) | High Nglom | 1.62 | 6.76 | 3.58 | 1.17 | 9.51 | 3.74NS | 1.17 | 7.6 | 3.42NS |
| (1.01) | (1.42) | (1.08) | ||||||||
| Low Nglom | 1.46 | 6.99 | 4.07 | 1.06 | 11.85 | 6.57*** | 0.69 | 7.95 | 3.91NS | |
| (1.20) | (2.12) | (1.34) | ||||||||
Nglom extremes: High or Low based on extremes of the female Nglom distribution; Mean IGV represents the mean value of 180 measured glomeruli per group (30 glomeruli per subject, 6 subjects per group); SD: standard deviation; NS: not statistically significant.
***P < 0.001 and **P < 0.01 in bold; NSP > 0.05; all statistical comparisons were performed between females and model 1 for males and between females and model 2 for males.
Among subjects with high Nglom, IGV variance was similar between sexes in Caucasian Americans (P = 0.81), but it was higher in African American males compared with their respective female counterparts (P = 0.03). In contrast, among subjects with low Nglom, males showed greater IGV variance than females in both racial groups (P = 0.07 for African Americans and P = 0.008 for Caucasian Americans).
Model 2: males matched to females by age, Nglom and BSA
IGV was also very variable among males from model 2, with a 6.3-fold range and an 8-fold range between the smallest and largest glomerulus in African and Caucasian American females, respectively.
Interestingly, males with high Nglom had similar average IGV as those with low Nglom in both African (Figure 2A; P = 0.58) and Caucasian Americans (Figure 2B; P = 0.40). Table 4 shows that average IGV was also similar between sexes in both races (P > 0.05 in all comparisons).
FIGURE 2:

Sex comparison of individual glomerular volume (IGV) by total nephron number (Nglom) in African and Caucasian Americans in the context of body surface area (BSA). Males were matched to females by age, Nglom and BSA (model 2). Each circle represents one glomerulus and each column represents aggregated data from six subjects per category (30 glomeruli per subject). Grey and black lines represent mean IGV and standard deviation per category.
IGV variance was also similar between sexes in all categories from Caucasian Americans (P > 0.05) and African Americans with high Nglom (P = 0.18). In African Americans with low Nglom, males showed greater IGV variance compared with their respective female pairs (P = 0.03).
Comparison of individual glomerular volume between races
Distributions of IGV from African Americans showed considerable overlap between most groups (Figure 3A). Interestingly, distributions of IGV for Caucasian Americans were remarkably similar in all categories, except for males with a combination of low Nglom and high BSA (model 1), for whom the distribution of IGV was markedly right-shifted (Figure 3B).
FIGURE 3:
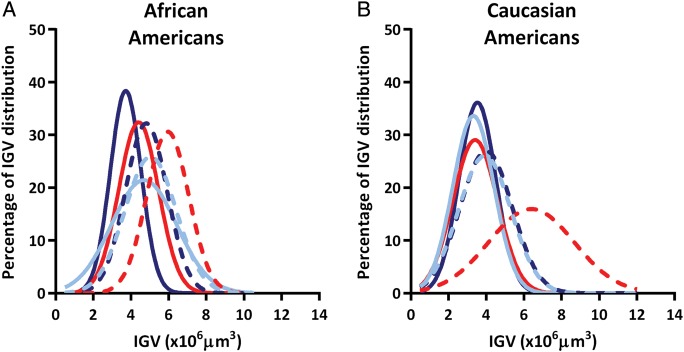
Distributions of individual glomerular volumes (IGV) by total nephron number (Nglom), and sex in (A) African Americans and (B) Caucasian Americans; dark blue line represents females with high Nglom; dark blue dashed line represents females with low Nglom; red line represents males from model 1 (matched to females by age and Nglom) with high Nglom; red dashed line represents males from model 1 (matched to females by age and Nglom) with low Nglom; light blue line represents males from model 2 (matched to females by age, Nglom and BSA) with high Nglom; and light blue dashed line represents males from model 2 (matched to females by age, Nglom and BSA) with low Nglom.
Male African Americans with high Nglom showed average IGV that was higher than that in Caucasian Americans, including 28% for model 1 (P = 0.001) with significant interactions from age (P < 0.01) and Nglom (P = 0.03), and 45% for model 2 (P = 0.11) without any interactions with age, Nglom or BSA. Among males with low Nglom, average IGV was very similar between races in model 1 (P = 0.30) and model 2 (P = 0.21), but IGV variance was higher in African Americans from model 2 compared with their respective Caucasian counterparts (P = 0.03).
What is the contribution of hypertension?
A multiple regression model was applied, including mean IGV per subject as the outcome and BSA, Nglom, race and hypertensive status as independent variables (F: 8.82, R2 = 0.35, P < 0.0001). While African American race (β: 0.26, P < 0.05), BSA (β: 0.31; P < 0.01) and Nglom (β: −0.37; P < 0.01) all predicted increases in mean IGV per subject, the contribution of hypertensive status was not significant (β: 0.15, P > 0.05). When MAP was introduced in this model (F: 4.87, R2 = 0.30, P < 0.01), the pattern was the same, with strong contributions from African American race (β: 0.34, P < 0.05), BSA (β: 0.28; P < 0.01) and Nglom (β: −0.41; P < 0.01), but no contribution from MAP (β: 0.01, P = 0.94). When anti-hypertensive therapy was introduced in this model (F: 8.30, R2 = 0.33, P < 0.0001), the same pattern was also confirmed with strong contributions from African American race (β: 0.25, P < 0.05), BSA (β: 0.31; P < 0.01) and Nglom (β: −0.36; P < 0.01), but no significant contribution from anti-hypertensive therapy (β: 0.17, P > 0.05). Furthermore, these models were applied again, this time using BMI instead of BSA. In this case, BMI, Nglom and African American race were the best predictors of mean IGV (P < 0.01) with no significant contributions from hypertension and anti-hypertensive therapy (P > 0.05).
A logistic regression using hypertensive status as the outcome variable with race, sex, age, BSA and Nglom as independent variables showed that neither the model, nor the variables were able to predict hypertension (data not shown). However, using a Spearman rank coefficient analysis, hypertensive status showed a strong positive association with age (R = 0.36, P < 0.01) and a weaker inverse correlation with Nglom (R = −0.29, P < 0.05).
DISCUSSION
The present study has three major findings: (i) American females with low Nglom did not show glomerular hypertrophy; (ii) American males with low Nglom showed marked glomerular hypertrophy that was closely associated with large body size; and (iii) glomerular size in African Americans may be confounded by multiple additional factors.
There is evidence of increases in glomerular size under physiological conditions, for example normal body growth [41, 42] and in association with multiple CKD risk factors [15, 28, 29, 34, 36–38]. It has been suggested that subjects with low Nglom may be at greater risk of kidney disease [4–8], especially because low Nglom is a strong driver of glomerular hypertrophy [26, 27]. According to the hyperfiltration theory [43], a setting of low Nglom may require a compensatory step in order to sustain renal function. Since human glomerulogenesis does not continue in the postnatal period [44], glomerular hypertrophy becomes a necessary compensatory step to meet physiological demands. However, humans have a substantial functional reserve [45], a protective factor against nephron under-endowment or nephron loss, which suggests that glomerular hypertrophy may be required if an additional stimulus is present.
In the clinical setting, parameters such as body weight [46], BSA [47] and BMI [48, 49] may represent the metabolic demands of the potential kidney recipient. Our current study suggests that high metabolic demands coupled with low Nglom are closely associated with glomerular hypertrophy. We propose that low Nglom is part of a bigger problem, which is the preservation of a proper balance between filtration surface area and physiologic demands. Indirect clinical confirmation of this hypothesis is supported by transplantation data [50, 51]. Oh et al. [50] provided direct evidence of an effect of donor graft mass and recipient metabolic demands on early graft function. This was confirmed by Tent et al. [51] who found that transplanted kidneys adapt to the recipient's body size and demands, independent of sex, without a deleterious effect in renal function and outcome up to mid-long term.
Several studies in humans have shown no differences in glomerular size between sexes [52–54]. However, differences in methodology and race across these studies may confound the interpretation. Neugarten et al. [21] reported that despite similar Nglom between sexes, males had larger glomeruli than females, which was closely associated with BSA rather than sex. While both findings were confirmed by the current study, we added a new component: glomerular size variability. As we described in males [29], glomerular size also varies significantly in female Americans and it appears to be exacerbated by glomerular stressors (i.e. low Nglom). Several theories have been proposed for this variability in the normal human kidney based around the concepts of glomerular hyper/hypo perfusion, including vascular changes that affect blood flow delivery to certain areas of the renal cortex [55] or specific glomerular features (i.e. atubular glomeruli) [56]. The question as to why some glomeruli undergo hypertrophy and others do not still remains and merits further assessment in future studies.
Low Nglom is a CKD risk factor that is currently difficult to use in clinical practice [4, 5, 8, 27]. This is primarily because of the lack of non-invasive methods for estimating Nglom in humans. The gold-standard method for estimating Nglom is based on unbiased stereology, which is by definition invasive. Interestingly, the first steps towards the development of non-invasive magnetic resonance imaging to quantify both glomerular number and size have recently been reported in ex vivo rat kidneys [57, 58], and initial efforts towards in vivo analysis of glomerular number and volume have commenced [59] and have the potential for the design and execution of future longitudinal studies.
At present, clinicians can use multiple surrogate markers of low Nglom, including low birth weight, prematurity, short stature, small kidneys, gestational diabetes and evidence of large glomeruli [5], in order to factor in the assessment of CKD risk. However, there is little that can currently be offered to these patients in order to prevent disease, but the combination of low Nglom and large body size has some potential, which is supported by strategies to reduce weight in severely obese patients with obesity-related glomerulopathy [60–62]. We postulate that body size modulation (i.e. weight control) may be particularly effective in subjects at risk of having low Nglom (i.e. low birth weight) [4, 5, 8, 27]. This hypothesis is supported by a recent publication from Silverwood et al. [63–65], who provided clinical evidence from a large British cohort that the development of overweight in those born with low birth weight is closely associated with reductions in renal function in adult life. In our study cohort, BMI and BSA were both independent predictors of glomerular hypertrophy in a setting of low Nglom providing a more general approach to body size modulation. It is noteworthy that body size can reflect fat and/or muscle mass, both of which have a direct effect on renal function [66]. Consequently, our findings may not be limited to a setting of obesity and could also be associated with increases in muscle mass (i.e. professional athletes). However, our findings illustrate that while the combination of low Nglom and large body size is powerful, race also plays a very important role in glomerular hypertrophy.
Zimanyi et al. [29] suggested that African American males were ‘not protected’ from glomerular hypertrophy by high Nglom. A similar degree of glomerular hypertrophy was observed in males with a combination of low Nglom and high BSA in both races, suggesting that there was comparable hypertrophy. Nevertheless, multiple African Americans showed excessive glomerular hypertrophy, even in cases where no apparent reason for compensatory hypertrophy was evident. Altogether, our analysis indicates that there is an overall excess of glomerular hypertrophy rather than lack of protection by high Nglom. Previous reports have suggested that this excessive hypertrophy may be explained by unidentified genetic factors in African Americans [4, 29, 33, 37]. Apo-Lipo-protein 1 (APOL1) risk alleles [67] have emerged as important risk factors for the development of FSGS and HIV-associated nephropathy in African Americans [68]. We are currently assessing associations between APOL1 risk alleles, nephron number and glomerular volume in our autopsy series.
Subjects included in this study come from the largest and most comprehensive kidney autopsy series in the world. However, we acknowledge several limitations, especially the inherent limitation of a cross-sectional study design. Firstly, our autopsy data collection did not include other parameters to further analyse body dimensions (i.e. muscle mass and waist circumference), limiting our ability to define whether body size modulation reflects changes in fat or muscle mass. Secondly, Brenner et al. [9, 43] and Keller et al. [69] proposed that low Nglom was closely associated with the development of hypertension. While the present study shows higher rates of hypertension in subjects with low Nglom, the study was not powered to assess the definite role of this variable. A regression analysis indicated that in these 66 subjects, the contributions of hypertension and prescribed anti-hypertensive medications to glomerular size were not as powerful as BSA and Nglom. Finally, our focus on histological features, such as Nglom and IGV, could oversimplify our understanding of complex processes involving multiple factors.
In conclusion, this study demonstrates for the first time that low Nglom is not associated with glomerular hypertrophy in female Americans. It also shows that compensatory glomerular hypertrophy in males with low Nglom was closely associated with high BSA. Furthermore, glomerular size in African Americans may be confounded by multiple additional factors, possibly genetic variants associated with increased risk of CKD. The development of new non-invasive technologies to study glomerular number and size will allow longitudinal studies and evaluation in large clinical cohorts of these variables.
CONFLICT OF INTEREST STATEMENT
None declared.
ACKNOWLEDGEMENTS
Part of this work was presented in poster format during the American Society of Nephrology Kidney Week, San Diego, 2012. The authors acknowledge the facilities, scientific and technical assistance from Monash Micro Imaging staff members, members of the Histology Platform at Monash University, and Susan Mott from the University of Queensland. V.G.P. received a Monash Research Graduate School Scholarship and a Faculty of Medicine International Postgraduate Scholarship to support his PhD candidature. This research was funded by grants from the National Institutes of Health (NIH 1 RO1 DK065970-01), NIH Center of Excellence in Minority Health (5P20M000534-02), the National Medical Research Council of Australia, Janssen-Cilag Australia Pty Ltd and the American Heart Association (Southeastern Affiliate).
REFERENCES
- 1.Blagg CR. Preface. Hemodial Int. 2011;15:177. doi: 10.1111/j.1542-4758.2011.00548.x. [DOI] [PubMed] [Google Scholar]
- 2.Levey AS, Coresh J. Chronic kidney disease. Lancet. 2012;379:165–180. doi: 10.1016/S0140-6736(11)60178-5. [DOI] [PubMed] [Google Scholar]
- 3.James MT, Hemmelgarn BR, Tonelli M. Early recognition and prevention of chronic kidney disease. Lancet. 2010;375:1296–1309. doi: 10.1016/S0140-6736(09)62004-3. [DOI] [PubMed] [Google Scholar]
- 4.Puelles VG, Hoy WE, Hughson MD, et al. Glomerular number and size variability and risk for kidney disease. Curr Opin Nephrol Hypertens. 2011;20:7–15. doi: 10.1097/MNH.0b013e3283410a7d. [DOI] [PubMed] [Google Scholar]
- 5.Luyckx VA, Brenner BM. The clinical importance of nephron mass. J Am Soc Nephrol. 2010;21:898–910. doi: 10.1681/ASN.2009121248. [DOI] [PubMed] [Google Scholar]
- 6.Hoy WE, Hughson MD, Bertram JF, et al. Nephron number, hypertension, renal disease, and renal failure. J Am Soc Nephrol. 2005;16:2557–2564. doi: 10.1681/ASN.2005020172. [DOI] [PubMed] [Google Scholar]
- 7.Hughson MD, Gobe GC, Hoy WE, et al. Associations of glomerular number and birth weight with clinicopathological features of African Americans and whites. Am J Kidney Dis. 2008;52:18–28. doi: 10.1053/j.ajkd.2008.03.023. [DOI] [PubMed] [Google Scholar]
- 8.Luyckx VA, Bertram JF, Brenner BM, et al. Effect of fetal and child health on kidney development and long-term risk of hypertension and kidney disease. Lancet. 2013;382:273–283. doi: 10.1016/S0140-6736(13)60311-6. [DOI] [PubMed] [Google Scholar]
- 9.Brenner BM. Nephron adaptation to renal injury or ablation. Am J Physiol. 1985;249(3 Pt 2):F324–F337. doi: 10.1152/ajprenal.1985.249.3.F324. [DOI] [PubMed] [Google Scholar]
- 10.Young RJ, Hoy WE, Kincaid-Smith P, et al. Glomerular size and glomerulosclerosis in Australian aborigines. Am J Kidney Dis. 2000;36:481–489. doi: 10.1053/ajkd.2000.9788. [DOI] [PubMed] [Google Scholar]
- 11.Ijpelaar DH, Schulz A, Koop K, et al. Glomerular hypertrophy precedes albuminuria and segmental loss of podoplanin in podocytes in Munich-Wistar-Fromter rats. Am J Physiol Renal Physiol. 2008;294:F758–F767. doi: 10.1152/ajprenal.00457.2007. [DOI] [PubMed] [Google Scholar]
- 12.Stackhouse S, Miller PL, Park SK, et al. Reversal of glomerular hyperfiltration and renal hypertrophy by blood glucose normalization in diabetic rats. Diabetes. 1990;39:989–995. doi: 10.2337/diab.39.8.989. [DOI] [PubMed] [Google Scholar]
- 13.Fabris B, Candido R, Armini L, et al. Control of glomerular hyperfiltration and renal hypertrophy by an angiotensin converting enzyme inhibitor prevents the progression of renal damage in hypertensive diabetic rats. J Hypertens. 1999;17(12 Pt 2):1925–1931. doi: 10.1097/00004872-199917121-00023. [DOI] [PubMed] [Google Scholar]
- 14.Lemley KV. A basis for accelerated progression of diabetic nephropathy in Pima Indians. Kidney Int Suppl. 2003:S38–S42. doi: 10.1046/j.1523-1755.63.s83.9.x. [DOI] [PubMed] [Google Scholar]
- 15.Hughson MD, Hoy WE, Douglas-Denton RN, et al. Towards a definition of glomerulomegaly: clinical-pathological and methodological considerations. Nephrol Dial Transplant. 2011;26:2202–2208. doi: 10.1093/ndt/gfq688. [DOI] [PMC free article] [PubMed] [Google Scholar]
- 16.Neugarten J, Golestaneh L. Gender and the prevalence and progression of renal disease. Adv Chronic Kidney Dis. 2013;20:390–395. doi: 10.1053/j.ackd.2013.05.004. [DOI] [PubMed] [Google Scholar]
- 17.Neugarten J, Acharya A, Silbiger SR. Effect of gender on the progression of nondiabetic renal disease: a meta-analysis. J Am Soc Nephrol. 2000;11:319–329. doi: 10.1681/ASN.V112319. [DOI] [PubMed] [Google Scholar]
- 18.Silbiger S, Neugarten J. Gender and human chronic renal disease. Gend Med. 2008;5(Suppl A):S3–S10. doi: 10.1016/j.genm.2008.03.002. [DOI] [PubMed] [Google Scholar]
- 19.Silbiger SR, Neugarten J. The role of gender in the progression of renal disease. Adv Ren Replace Ther. 2003;10:3–14. doi: 10.1053/jarr.2003.50001. [DOI] [PubMed] [Google Scholar]
- 20.Hughson MD, Douglas-Denton R, Bertram JF, et al. Hypertension, glomerular number, and birth weight in African Americans and white subjects in the southeastern United States. Kidney Int. 2006;69:671–678. doi: 10.1038/sj.ki.5000041. [DOI] [PubMed] [Google Scholar]
- 21.Neugarten J, Kasiske B, Silbiger SR, et al. Effects of sex on renal structure. Nephron. 2002;90:139–144. doi: 10.1159/000049033. [DOI] [PubMed] [Google Scholar]
- 22.Tan JC, Paik J, Chertow GM, et al. Validity of surrogate measures for functional nephron mass. Transplantation. 2011;92:1335–1341. doi: 10.1097/TP.0b013e31823705ef. [DOI] [PMC free article] [PubMed] [Google Scholar]
- 23.Tsuboi N, Utsunomiya Y, Koike K, et al. Factors related to the glomerular size in renal biopsies of chronic kidney disease patients. Clin Nephrol. 2013;79:277–284. doi: 10.5414/CN107817. [DOI] [PubMed] [Google Scholar]
- 24.Hoy WE, Douglas-Denton RN, Hughson MD, et al. A stereological study of glomerular number and volume: preliminary findings in a multiracial study of kidneys at autopsy. Kidney Int Suppl. 2003:S31–S37. doi: 10.1046/j.1523-1755.63.s83.8.x. [DOI] [PubMed] [Google Scholar]
- 25.Hughson M, Farris AB, III, Douglas-Denton R, et al. Glomerular number and size in autopsy kidneys: the relationship to birth weight. Kidney Int. 2003;63:2113–2122. doi: 10.1046/j.1523-1755.2003.00018.x. [DOI] [PubMed] [Google Scholar]
- 26.Douglas-Denton RN, McNamara BJ, Hoy WE, et al. Does nephron number matter in the development of kidney disease? Ethn Dis. 2006;16(2 Suppl 2) S2-40-5. [PubMed] [Google Scholar]
- 27.Bertram JF, Douglas-Denton RN, Diouf B, et al. Human nephron number: implications for health and disease. Pediatr Nephrol. 2011;26:1529–1533. doi: 10.1007/s00467-011-1843-8. [DOI] [PubMed] [Google Scholar]
- 28.Samuel T, Hoy WE, Douglas-Denton R, et al. Determinants of glomerular volume in different cortical zones of the human kidney. J Am Soc Nephrol. 2005;16:3102–3109. doi: 10.1681/ASN.2005010123. [DOI] [PubMed] [Google Scholar]
- 29.Zimanyi MA, Hoy WE, Douglas-Denton RN, et al. Nephron number and individual glomerular volumes in male Caucasian and African American subjects. Nephrol Dial Transplant. 2009;24:2428–2433. doi: 10.1093/ndt/gfp116. [DOI] [PMC free article] [PubMed] [Google Scholar]
- 30.Eknoyan G. Adolphe Quetelet (1796–1874)—the average man and indices of obesity. Nephrol Dial Transplant. 2008;23:47–51. doi: 10.1093/ndt/gfm517. [DOI] [PubMed] [Google Scholar]
- 31.Mosteller RD. Simplified calculation of body-surface area. N Engl J Med. 1987;317:1098. doi: 10.1056/NEJM198710223171717. [DOI] [PubMed] [Google Scholar]
- 32.Hughson MD, Puelles VG, Hoy WE, et al. (December 9, 2013). Hypertension, glomerular hypertrophy and nephrosclerosis: the effect of race. Nephrol Dial Transplant. 2014;29:1399–1409. doi: 10.1093/ndt/gft480. [DOI] [PMC free article] [PubMed] [Google Scholar]
- 33.McNamara BJ, Diouf B, Douglas-Denton RN, et al. A comparison of nephron number, glomerular volume and kidney weight in Senegalese Africans and African Americans. Nephrol Dial Transplant. 2010;25:1514–1520. doi: 10.1093/ndt/gfq030. [DOI] [PMC free article] [PubMed] [Google Scholar]
- 34.McNamara BJ, Diouf B, Hughson MD, et al. Associations between age, body size and nephron number with individual glomerular volumes in urban West African males. Nephrol Dial Transplant. 2009;24:1500–1506. doi: 10.1093/ndt/gfn636. [DOI] [PMC free article] [PubMed] [Google Scholar]
- 35.Hoy WE, Hughson MD, Singh GR, et al. Reduced nephron number and glomerulomegaly in Australian Aborigines: a group at high risk for renal disease and hypertension. Kidney Int. 2006;70:104–110. doi: 10.1038/sj.ki.5000397. [DOI] [PubMed] [Google Scholar]
- 36.Puelles VG, Zimanyi MA, Samuel T, et al. Estimating individual glomerular volume in the human kidney: clinical perspectives. Nephrol Dial Transplant. 2012;27:1880–1888. doi: 10.1093/ndt/gfr539. [DOI] [PMC free article] [PubMed] [Google Scholar]
- 37.Hoy WE, Hughson MD, Diouf B, et al. Distribution of volumes of individual glomeruli in kidneys at autopsy: association with physical and clinical characteristics and with ethnic group. Am J Nephrol. 2011;33(Suppl 1):15–20. doi: 10.1159/000327044. [DOI] [PubMed] [Google Scholar]
- 38.Hoy WE, Hughson MD, Zimanyi M, et al. Distribution of volumes of individual glomeruli in kidneys at autopsy: association with age, nephron number, birth weight and body mass index. Clin Nephrol. 2010;74(Suppl 1):S105–S112. doi: 10.5414/cnp74s105. [DOI] [PubMed] [Google Scholar]
- 39.Sterio DC. The unbiased estimation of number and sizes of arbitrary particles using the disector. J Microsc. 1984;134(Pt 2):127–136. doi: 10.1111/j.1365-2818.1984.tb02501.x. [DOI] [PubMed] [Google Scholar]
- 40.Bertram JF. Analyzing renal glomeruli with the new stereology. Int Rev Cytol. 1995;161:111–172. doi: 10.1016/s0074-7696(08)62497-3. [DOI] [PubMed] [Google Scholar]
- 41.Akaoka K, White RH, Raafat F. Human glomerular growth during childhood: a morphometric study. J Pathol. 1994;173:261–268. doi: 10.1002/path.1711730310. [DOI] [PubMed] [Google Scholar]
- 42.Cortes P, Zhao X, Dumler F, et al. Age-related changes in glomerular volume and hydroxyproline content in rat and human. J Am Soc Nephrol. 1992;2:1716–1725. doi: 10.1681/ASN.V2121716. [DOI] [PubMed] [Google Scholar]
- 43.Brenner BM, Lawler EV, Mackenzie HS. The hyperfiltration theory: a paradigm shift in nephrology. Kidney Int. 1996;49:1774–1777. doi: 10.1038/ki.1996.265. [DOI] [PubMed] [Google Scholar]
- 44.Walker KA, Bertram JF. Kidney development: core curriculum 2011. Am J Kidney Dis. 2011;57:948–958. doi: 10.1053/j.ajkd.2011.03.009. [DOI] [PubMed] [Google Scholar]
- 45.Luyckx VA, Brenner BM. Low birth weight, nephron number, and kidney disease. Kidney Int Suppl. 2005:S68–S77. doi: 10.1111/j.1523-1755.2005.09712.x. [DOI] [PubMed] [Google Scholar]
- 46.Eschwege P, Trifa M, Randrianjohany A, et al. Effects of donor and recipient weight differences on serum creatinine levels in renal transplantation. Transplant Proc. 1995;27:2456. [PubMed] [Google Scholar]
- 47.Moreso F, Seron D, Anunciada AI, et al. Recipient body surface area as a predictor of posttransplant renal allograft evolution. Transplantation. 1998;65:671–676. doi: 10.1097/00007890-199803150-00012. [DOI] [PubMed] [Google Scholar]
- 48.Cannon RM, Jones CM, Hughes MG, et al. The impact of recipient obesity on outcomes after renal transplantation. Ann Surg. 2013;257:978–984. doi: 10.1097/SLA.0b013e318275a6cb. [DOI] [PubMed] [Google Scholar]
- 49.Aalten J, Christiaans MH, de Fijter H, et al. The influence of obesity on short- and long-term graft and patient survival after renal transplantation. Transpl Int. 2006;19:901–907. doi: 10.1111/j.1432-2277.2006.00367.x. [DOI] [PubMed] [Google Scholar]
- 50.Oh CK, Jeon KO, Kim HJ, et al. Metabolic demand and renal mass supply affecting the early graft function after living donor kidney transplantation. Kidney Int. 2005;67:744–749. doi: 10.1111/j.1523-1755.2005.67136.x. [DOI] [PubMed] [Google Scholar]
- 51.Tent H, Lely AT, Toering TJ, et al. Donor kidney adapts to body dimensions of recipient: no influence of donor gender on renal function after transplantation. Am J Transplant. 2011;11:2173–2180. doi: 10.1111/j.1600-6143.2011.03687.x. [DOI] [PubMed] [Google Scholar]
- 52.McLachlan MS, Gaunt A, Fulker MJ, et al. Estimation of glomerular size and number from radiographs of the kidney. Br J Radiol. 1976;49:831–835. doi: 10.1259/0007-1285-49-586-831. [DOI] [PubMed] [Google Scholar]
- 53.Ellis EN, Mauer SM, Sutherland DE, et al. Glomerular capillary morphology in normal humans. Lab Invest. 1989;60:231–236. [PubMed] [Google Scholar]
- 54.Abdi R, Slakey D, Kittur D, et al. Heterogeneity of glomerular size in normal donor kidneys: impact of race. Am J Kidney Dis. 1998;32:43–46. doi: 10.1053/ajkd.1998.v32.pm9669422. [DOI] [PubMed] [Google Scholar]
- 55.Hoy WE, Bertram JF, Denton RD, et al. Nephron number, glomerular volume, renal disease and hypertension. Curr Opin Nephrol Hypertens. 2008;17:258–265. doi: 10.1097/MNH.0b013e3282f9b1a5. [DOI] [PubMed] [Google Scholar]
- 56.Chevalier RL, Forbes MS. Generation and evolution of atubular glomeruli in the progression of renal disorders. J Am Soc Nephrol. 2008;19:197–206. doi: 10.1681/ASN.2007080862. [DOI] [PubMed] [Google Scholar]
- 57.Beeman SC, Zhang M, Gubhaju L, et al. Measuring glomerular number and size in perfused kidneys using MRI. Am J Physiol Renal Physiol. 2011;300:F1454–F1457. doi: 10.1152/ajprenal.00044.2011. [DOI] [PubMed] [Google Scholar]
- 58.Heilmann M, Neudecker S, Wolf I, et al. Quantification of glomerular number and size distribution in normal rat kidneys using magnetic resonance imaging. Nephrol Dial Transplant. 2012;27:100–107. doi: 10.1093/ndt/gfr273. [DOI] [PubMed] [Google Scholar]
- 59.Bennett KM, Bertram JF, Beeman SC, et al. (March 20, 2013). Invited review: the emerging role of MRI in quantitative renal glomerular morphology. Am J Physiol Renal Physiol. 2013;304:F1252–F1257. doi: 10.1152/ajprenal.00714.2012. [DOI] [PMC free article] [PubMed] [Google Scholar]
- 60.Chagnac A, Weinstein T, Herman M, et al. The effects of weight loss on renal function in patients with severe obesity. J Am Soc Nephrol. 2003;14:1480–1486. doi: 10.1097/01.asn.0000068462.38661.89. [DOI] [PubMed] [Google Scholar]
- 61.Shimomura Y, Murakami M, Shimizu H, et al. Improvement of nephrotic syndrome in a massively obese patient after weight loss and treatment with an anti-allergic drug. J Med. 1990;21:337–347. [PubMed] [Google Scholar]
- 62.Bolignano D, Zoccali C. Effects of weight loss on renal function in obese CKD patients: a systematic review. Nephrol Dial Transplant. 2013;28(Suppl 4):iv82–iv98. doi: 10.1093/ndt/gft302. [DOI] [PubMed] [Google Scholar]
- 63.Silverwood RJ, Pierce M, Thomas C, et al. Association between younger age when first overweight and increased risk for CKD. J Am Soc Nephrol. 2013;24:813–821. doi: 10.1681/ASN.2012070675. [DOI] [PMC free article] [PubMed] [Google Scholar]
- 64.Silverwood RJ, Pierce M, Hardy R, et al. Early-Life Overweight Trajectory and CKD in the 1946 British Birth Cohort Study. Am J Kidney Dis. 2013;62:276–284. doi: 10.1053/j.ajkd.2013.03.032. [DOI] [PMC free article] [PubMed] [Google Scholar]
- 65.Silverwood RJ, Pierce M, Hardy R, et al. (June 12, 2013). Low birth weight, later renal function, and the roles of adulthood blood pressure, diabetes, and obesity in a British birth cohort. Kidney Int. 2013;84:1262–1270. doi: 10.1038/ki.2013.223. [DOI] [PMC free article] [PubMed] [Google Scholar]
- 66.Chew-Harris JS, Florkowski CM, George PM, et al. The relative effects of fat versus muscle mass on cystatin C and estimates of renal function in healthy young men. Ann Clin Biochem. 2013;50(Pt 1):39–46. doi: 10.1258/acb.2012.011241. [DOI] [PubMed] [Google Scholar]
- 67.Genovese G, Friedman DJ, Ross MD, et al. Association of trypanolytic ApoL1 variants with kidney disease in African Americans. Science. 2010;329:841–845. doi: 10.1126/science.1193032. [DOI] [PMC free article] [PubMed] [Google Scholar]
- 68.Kopp JB, Nelson GW, Sampath K, et al. APOL1 genetic variants in focal segmental glomerulosclerosis and HIV-associated nephropathy. J Am Soc Nephrol. 2011;22:2129–2137. doi: 10.1681/ASN.2011040388. [DOI] [PMC free article] [PubMed] [Google Scholar]
- 69.Keller G, Zimmer G, Mall G, et al. Nephron number in patients with primary hypertension. N Engl J Med. 2003;348:101–108. doi: 10.1056/NEJMoa020549. [DOI] [PubMed] [Google Scholar]