

Keywords: neural regeneration, neurodegeneration, human connectome, functional MRI, graph theory, resting state, small world property, early mild cognitive impairment, late mild cognitive impairment, Alzheimer's disease, aging, diffuse brain disease, grants-supported paper, neuroregeneration
Abstract
Brain structure and cognitive function change in the temporal lobe, hippocampus, and prefrontal cortex of patients with mild cognitive impairment and Alzheimer's disease, and brain network-connection strength, network efficiency, and nodal attributes are abnormal. However, existing research has only analyzed the differences between these patients and normal controls. In this study, we constructed brain networks using resting-state functional MRI data that was extracted from four populations (normal controls, patients with early mild cognitive impairment, patients with late mild cognitive impairment, and patients with Alzheimer's disease) using the Alzheimer's Disease Neuroimaging Initiative data set. The aim was to analyze the characteristics of resting-state functional neural networks, and to observe mild cognitive impairment at different stages before the transformation to Alzheimer's disease. Results showed that as cognitive deficits increased across the four groups, the shortest path in the resting-state functional network gradually increased, while clustering coefficients gradually decreased. This evidence indicates that dementia is associated with a decline of brain network efficiency. In addition, the changes in functional networks revealed the progressive deterioration of network function across brain regions from healthy elderly adults to those with mild cognitive impairment and Alzheimer's disease. The alterations of node attributes in brain regions may reflect the cognitive functions in brain regions, and we speculate that early impairments in memory, hearing, and language function can eventually lead to diffuse brain injury and other cognitive impairments.
INTRODUCTION
The existing medication for Alzheimer's disease (AD) is very limited; however, early detection and treatment can effectively slow down disease progression. Mild cognitive impairment (MCI) is sometimes a transitional stage between normal aging and AD that is characterized by impairments in memory or other cognitive faculties, but does not meet the criteria for dementia[1,2,3]. Amnestic MCI patients are a high-risk population for AD and it is estimated that 44% of amnestic MCI patients develop AD after 3 years, with an annual rate of up to 15%[4,5,6,7]. However, in the normal older population, the rate is only 1–2%[8]. Because AD is an irreversible disease, preclinical early warning and intervention for MCI patients is considered a key area of interest.
Neuroimaging research shows that AD and MCI patients exhibit differences in the structure or cognitive functions of the temporal lobe, hippocampus, and prefrontal cortex, and abnormal structure or function in bilateral hippocampus, amygdala, entorhinal cortex, posterior cingulate, thalamus, and spacing of temporal sulci[9,10,11,12,13,14]. Compared with normal elderly groups, medial temporal cortex was activated much less in MCI and AD patients when they performed a memory task[15], whereas the right parahippocampal gyrus showed more activity during a memory encoding task[16,17]. During a visual memory task, more brain regions were activated in AD and MCI patients compared with normal elderly subjects, primarily in the right superior frontal gyrus, bilateral middle temporal gyri, middle frontal gyrus, and bilateral cingulate gyri. Additionally, MCI patients showed more activity than AD patients in the right parahippocampal gyrus, right lentiform nucleus, right fusiform gyrus, left inferior frontal gyrus (IFG), left supramarginal gyrus (SMG), and bilateral cingulate gyri[18]. These findings indicate that cognitive impairment in AD does not occur in only a few regions, but rather involves changes to diffuse brain regions. Scholars have constructed structural or functional brain networks, have analyzed the characteristics and node attributes of these networks using graph theory, and have explored changes in key brain regions and key path abnormalities[19,20,21,22,23,24]. Filippi et al[25] found that the default network, frontal top network, working-memory network, and attention network were all abnormal in dementia patients. Delbeuck et al[26] revealed abnormal functional connections in brain regions of MCI patients. He et al[19,27] pointed out that in AD patients, abnormal connections were observed in certain brain regions or between brain regions, and that topologic anomalies were visible in structural and functional neural integration among large-scale networks. Supekar et al[28] used resting-state functional magnetic resonance imaging (fMRI) to study the local efficiency of functional brain networks, and showed that it was reduced in AD patients. Reduced connection strength and efficiency of resting-state functional brain networks as well as the loss of default network integration has been observed in MCI patients[29,30]. Compared with AD patients, the hub effect of the temporal cortex was reduced and module functions were changed in the parahippocampal gyrus, middle temporal gyrus, fusiform gyrus, and cingulate gyrus of MCI patients[31]. The network node attributes in prefrontal cortex, insula, and white matter connectivity in the parietal cortex can be used to distinguish normal elderly from MCI patients[32]. These data collectively imply that brain networks vary greatly among normal elderly subjects, MCI patients, and AD patients.
MCI can be subdivided into early MCI (EMCI) and late MCI (LMCI)[33,34]. Although we know that amyloid deposition increases and hypometabolism develops during the process by which EMCI or LMCI progress into AD[35], changes in brain networks during this transformation have yet to be studied. Here, we constructed resting-state functional brain networks, and using graph-theory method, investigated network changes as time and disease progressed.
RESULTS
Quantitative analysis of subjects and clinical information of patients
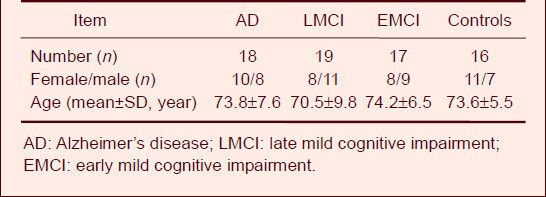
Resting-state fMRI data were obtained from 70 subjects from the AD Neuroimaging Initiative (ADNI) data set, including 18 AD patients, 19 LMCI patients, 17 EMCI patients, and 16 healthy subjects (control). No significant difference in gender or age was found among the subjects. General information for subjects is listed in Table 1.
Table 1.
General subject information
Global attributes of resting-state functional networks in normal subjects, MCI patients, and AD patients
We determined the shortest path within the resting-state functional networks, and found that while it gradually decreased as sparseness increased, the clustering coefficient gradually increased. The shortest path was the highest in the AD group, followed by LMCI and EMCI groups, and lowest in the control group. In contrast, the clustering coefficient showed the reverse pattern, being highest in the control group, then LMCI and EMCI groups, and lowest in the AD group (Figure 1). The average shortest path in the control group was significantly lower (P = 0.044), and the clustering coefficient was significantly higher (P = 0.037) than what was observed in the AD group. The control group trended towards a lower average shortest path (P = 0.086) and a higher clustering coefficient (P = 0.053) than the EMCI group. The EMCI group showed a lower average shortest path and a higher clustering coefficient than the LMCI group, but the differences were not significant. Likewise, the LMCI group showed a lower average shortest path and a higher clustering coefficient than the AD group, but the differences were not significant.
Figure 1.
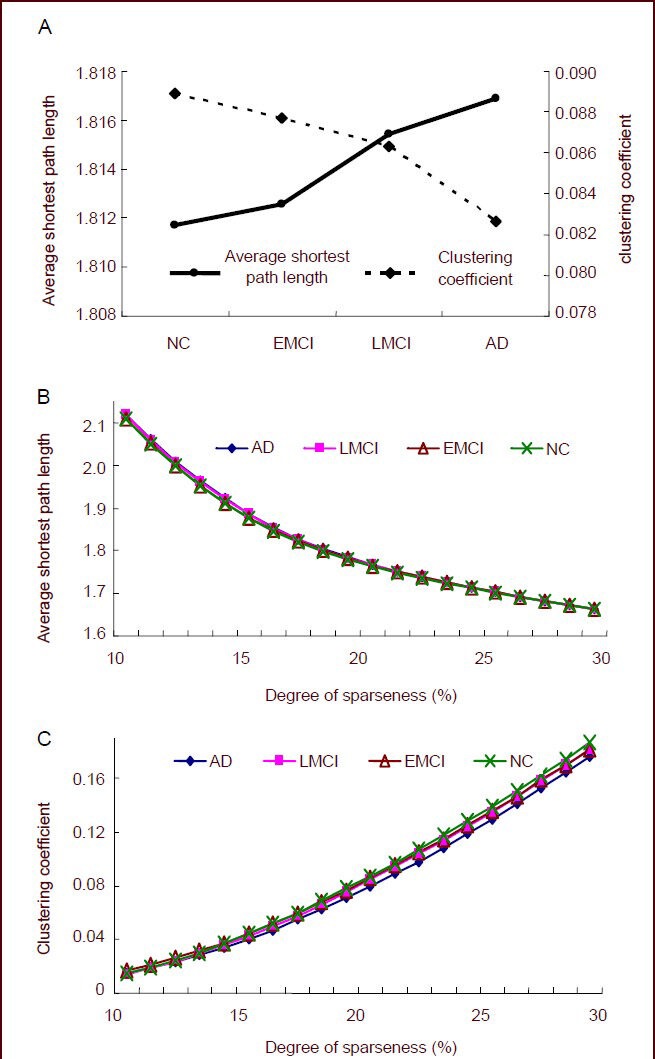
Global attributes of resting-state functional networks in normal control (NC), early mild cognitive impairment (EMCI), late mild cognitive impairment (LMCI), and Alzheimer's disease (AD) groups.
(A) The average shortest path length and clustering coefficient for the four groups under 11–30% of sparseness. The average shortest path gradually increased as cognitive deficits increased, while the average clustering coefficient gradually decreased.
(B) The shortest path length under different degrees of sparseness. As the sparseness increased, the shortest path gradually decreased with cognitive deficits.
(C) The clustering coefficient under different degrees of sparseness. As the sparseness increased, the clustering coefficient gradually increased with cognitive deficits.
Node attributes of resting-state functional networks in normal subjects, MCI patients, and AD patients
Differences in node centrality between normal subjects and EMCI patients were found in the right transverse temporal gyrus, left superior occipital gyrus, right inferior parietal margin of the angular gyrus, left anterior cingulate and paracingulate gyrus, right rectus muscle, left precuneus, and right middle orbital frontal gyrus (P < 0.05) under different degrees of sparseness. Additionally, node efficiency in the right transverse temporal gyrus, left superior occipital gyrus, and left superior parietal gyrus also showed significant differences (P < 0.05; Table 2, Figure 2). EMCI patients showed significant differences from LMCI patients regarding node centrality between the left triangular part of the IFG and the left olfactory cortex (P < 0.05), and between the left triangular part of the IFG and the left inferior orbital frontal gyrus (P < 0.05; Table 3, Figure 2) under different degrees of sparseness. Compared with LMCI patients, node centrality of AD patients between the bilateral triangular part of the IFG, left opercular part of the IFG, and left angular gyrus was significantly different (P < 0.05). Node efficiency in the opercular part of the IFG, left SMG, bilateral triangular part of the IFG, and the right superior temporal gyrus (P < 0.05; Table 4, Figure 2) also showed significant differences in AD patients under different degrees of sparseness, compared with LMCI patients.
Table 2.
Number of sparseness with different node attributes between the control group and the early mild cognitive impairment group
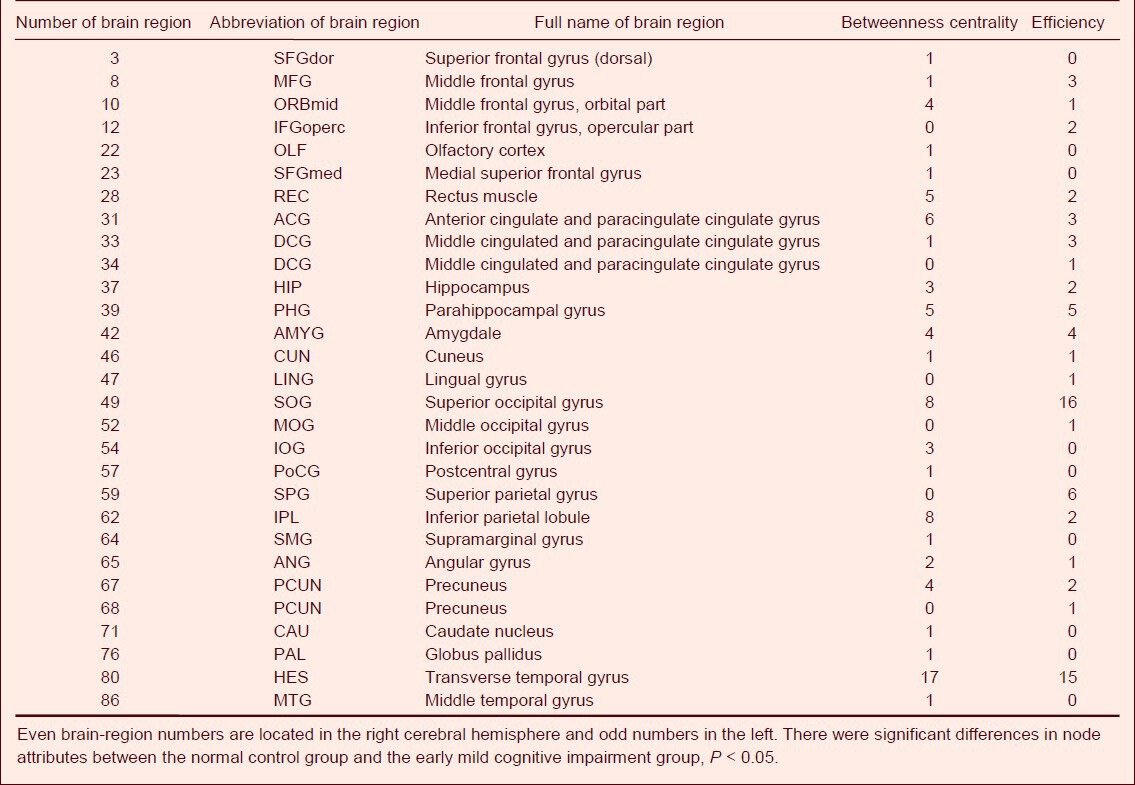
Figure 2.
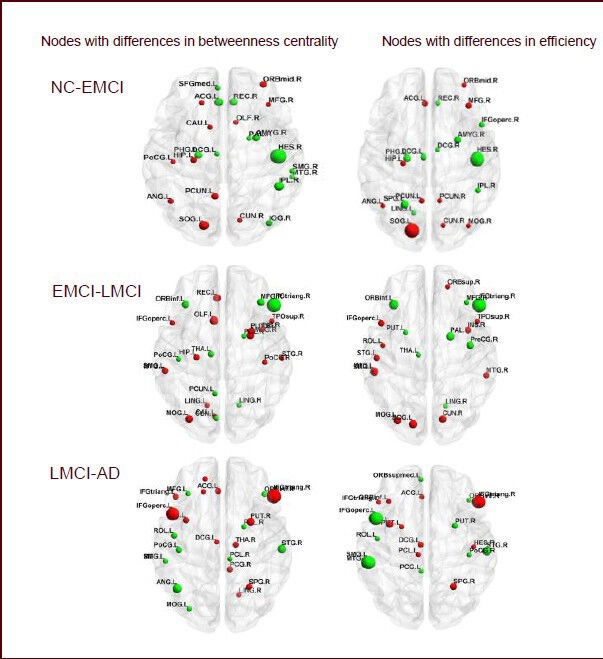
Nodes with differences in the resting-state functional network in normal control (NC), early mild cognitive impairment (EMCI), late mild cognitive impairment (LMCI), and Alzheimer's disease (AD) groups.
Each panel compares betweenness centrality and node efficiency across groups. P < 0.05 indicates differences among different groups. (NC-EMCI) Red color, values are higher in the NC group. Green color, values are higher in the EMCI group. (EMCI-LMCI) Red color, values are higher in the EMCI group. Green color, values are higher in the LMCI group. (LMCI-AD) Red color, values are higher in the LMCI group. Green color, values are higher in the AD group. Abbreviations of brain regions are shown in Tables 2–4.
Table 3.
Number of sparseness with different node attributes between the early mild cognitive impairment group and the late mild cognitive impairment group
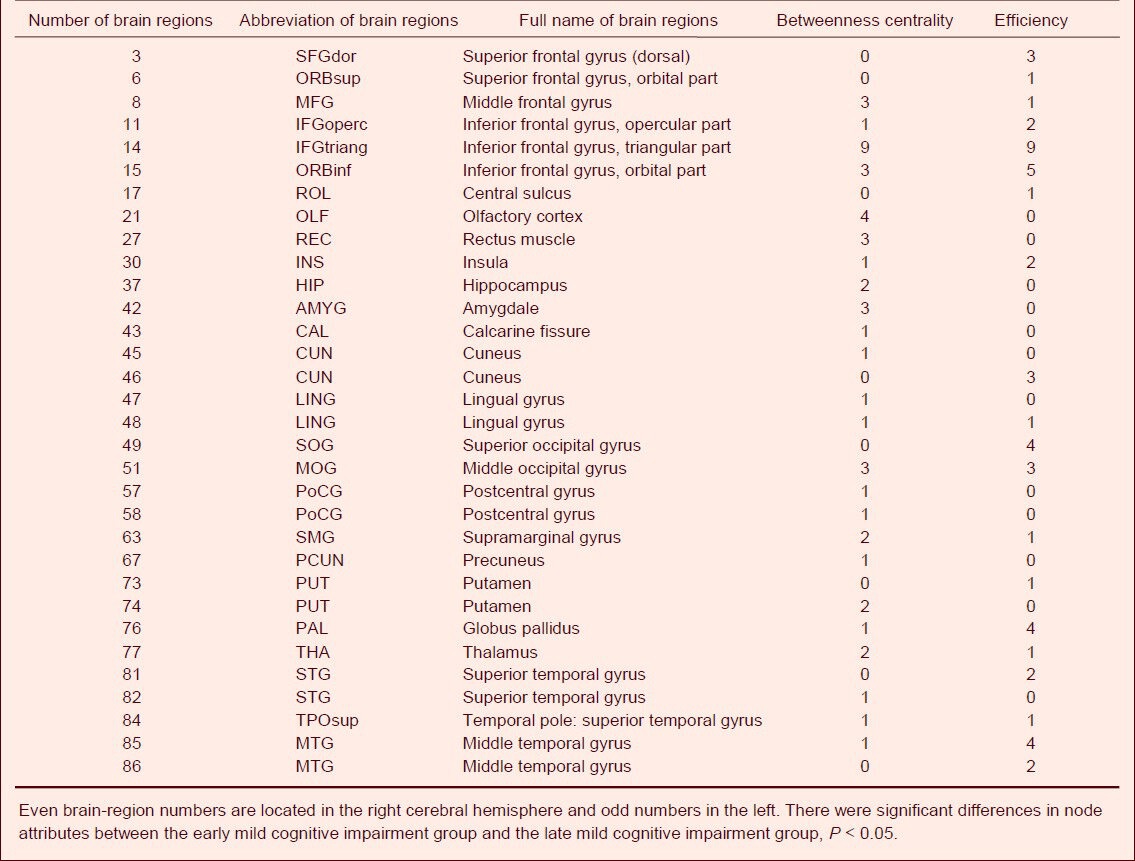
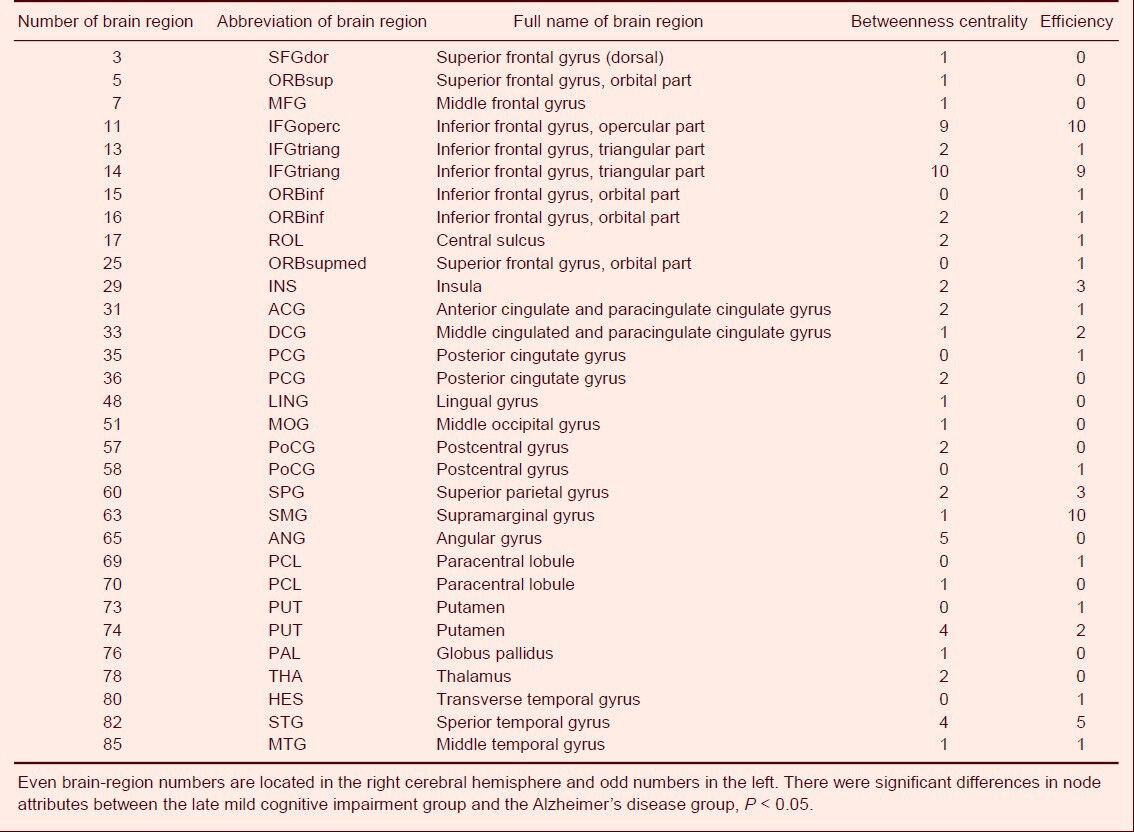
Table 4.
Number of sparseness with different node attributes between the late mild cognitive impairment group and the Alzheimer's disease group
DISCUSSION
We constructed resting-state functional brain networks in normal elderly subjects, EMCI patients, LMCI patients, and AD patients. Analysis showed significant differences in the global and nodal attributes across groups.
The resting-state functional brain networks in the four groups were characterized by a high clustering coefficient and a low shortest path length, indicating that the brain is a complex and efficient network, with small world characteristics. Comparison of the global attributes across the four groups revealed that as cognitive deficits increased, small world characteristics gradually degraded, clustering coefficients decreased, and the shortest path length increased. The clustering coefficient followed the pattern control > EMCI > LMCI > AD, and the average shortest path followed the pattern control < EMCI < LMCI < AD. Comparison of AD, MCI, and control groups revealed that the clustering coefficient was lowest and the shortest path was highest in the AD group[36]. Breitner et al[37] found that small world characteristics of resting-state functional brain networks were lower in AD patients, suggesting that whole-brain information integration is abnormal in AD patients. Similar results were also observed in electroencephalogram networks, cortical thickness, and diffusion tensor imaging networks.
Stam et al[38] constructed brain networks based on EEG signals and found that the shortest path length constructed in the beta band of AD patients was significantly longer than that of normal controls. The clustering coefficient of brain networks in AD patients has been reported as significantly less than that in normal controls[28]. He et al[39] constructed structural networks based on cortical thickness and found that clustering coefficients were low and shortest paths were high in patients with AD. Another diffusion tensor imaging study showed that neural networks of AD patients had higher shortest path values and a lower clustering coefficients than normal elderly subjects, and that global efficiency decreased primarily in the frontal cortex, and was associated with verbal working-memory capacity[40]. The white matter structure of patients with MCI has been reported to be similar to that of AD patients[41]. Yao et al[31] compared structural networks among normal controls, MCI patients, and AD patients, and found that clustering coefficients and average shortest paths in MCI patients ranged between those found in normal subjects and AD patients. Our findings support these conclusions. Additionally, in our study we found that the clustering coefficient was higher and the shortest path was lower in EMCI patients than in LMCI patients. Although the difference was not significant, this could be due to the small sample size. We speculate that cognitive impairment in AD patients is not caused by damage to only a few brain regions, but rather, it may result from the decline of local efficiency in functional brain networks, leading to cognitive impairment, and ultimately to the development of dementia.
Changes in global network attributes are triggered by changes in network topology, and analysis of network-node attributes can help find nodes with differences. Our study found that cognitive impairment in MCI and AD patients is associated with different degrees of damage in several brain regions, including the frontal cortex (rectus muscle, inferior orbital frontal gyrus, bilateral triangular part of the IFG, opercular part of the IFG, and middle frontal gyrus), parietal lobe (left precuneus, left angular gyrus, bilateral SMG, and right parietal inferior angular gyrus), temporal lobe (right transverse temporal gyrus, left middle temporal gyrus, and right superior temporal gyrus), occipital lobe (right inferior occipital gyrus, left superior occipital gyrus, left middle occipital gyrus, and occipital lobe), limbic system and basal ganglia (anterior cingulate, posterior cingulate, hippocampus and parahippocampal gyrus, bilateral thalamus, and putamen nucleus). These brain regions are highly involved in memory, hearing, language, attention, and other cognitive functions[42,43,44,45]. Increasing evidence indicates that the hippocampus, olfactory cortex, and temporal pole are critically associated with learning and memory. The precuneus is involved in many high-level cognitive functions such as episodic memory, self-related information processing, and consciousness. The superior temporal gyrus, inferior orbital frontal gyrus, parietal inferior angular gyrus, and angular gyrus are associated with language processing and understanding. The superior temporal gyrus and transverse temporal gyrus correlate with auditory perception, with the transverse temporal gyrus being the auditory center. The superior occipital gyrus is closely associated with visual-spatial processing. The hypothalamus is not only an important sensory integration center, but also participates in emotion, memory, and maintenance of wakefulness[46,47,48,49,50,51,52,53]. In our study, the abnormal brain regions coincided with regions associated with the types of cognitive dysfunctions found in AD patients, indicating that in addition to memory impairments, other cognitive functions such as language, attention, and visual-spatial ability are also damaged to varying degrees in AD patients. Through structural MRI of brain-region volume, positron emission tomography (PET) detection of brain-region metabolism, and fMRI studies of brain-region activation during cognitive processes, brain structure and cognitive functions have been found to be altered in frontal, temporal, parietal, and occipital lobes of patients with MCI and AD. This study found similar evidence regarding the nodal attributes in brain regions and the brain networks of MCI and AD patients. For example, Yao et al[31] constructed brain networks using gray matter volume in Automated Anatiomical Labeling (AAL) brain regions according to ADNI data, and found that the inferior orbital frontal gyrus was abnormal in MCI and AD patients, and the intensity of connections with other brain regions also changed. Connection intensity between orbital frontal cortex and ipsilateral inferior temporal gyrus was decreased in AD patients compared with normal controls. He et al[27,54] measured cortical thickness to investigate brain structures in AD patients, and found that, compared with normal subjects, the correlation coefficient of cortical thickness between bilateral parietal lobe was reduced in AD patients, while that of cortical thickness between lateral temporal lobe and parietal lobe and between cingulate gyrus and medial frontal lobe was higher. In addition, the node centers in the temporal lobe and parietal lobe association cortex of AD patients were reduced, and the number of central nodes in the occipital cortex increased.
Our main interest lies in the following four findings. (1) A significant difference between normal subjects and EMCI patients and insignificant differences between EMCI and LMCI patients and between LMCI and AD patients were observed in brain regions including the transverse temporal gyrus, superior occipital gyrus, rectus muscle, middle orbital frontal gyrus, precuneus, and hippocampus. (2) An insignificant difference between normal controls and EMCI patients, a significant difference between EMCI and LMCI patients, and an insignificant difference between LMCI and AD patients was observed in brain regions including the triangular part of the IFG, olfactory cortex, rectus muscle, inferior orbital frontal gyrus, and thalamus. These data imply that compared with normal elderly, cognitive functions were not apparently changed in EMCI patients, gradually worsened as the disease progressed into LMCI, but remained unchanged in the AD phase. (3) An insignificant difference between normal controls and EMCI patients and between EMCI and LMCI patients, but significant differences between LMCI and AD patients was observed in brain regions including the opercular part of the IFG. These discrepancies indicate that some brain regions are not damaged at the initial MCI stage, but may be gradually become so as deficits increase and develop into AD. (4) An insignificant difference between normal controls and EMCI patients, and significant differences between EMCI and LMC patients and between LMCI and AD patients was observed in brain regions including the middle temporal gyrus, superior temporal gyrus, lenticular putamen, SMG, middle occipital gyrus, lingual gyrus, triangular part of the IFG, and opercular part of the IFG. These differences reflect that impairments of node attributes may become aggravated as cognitive deficits worsen. We tentatively put forward that regional damage in MCI and AD patients is induced by two causes. One is that brain impairment on one side triggers a complementary injury on the opposite side, and the other is that certain regional damage affects other brain regions that are responsible for cognitive function. The data also suggest that auditory/visual processing and episodic memory functions are reduced during the early MCI stage, which progresses to impaired language and other memory functions, ultimately resulting in diffuse brain injury that triggers decline in other cognitive faculties, and ultimately dementia. However, little evidence is available because most current research focuses on normal controls, and MCI and AD patients, while studies addressing EMCI and LMCI are rare.
In summary, this study extracted resting-state fMRI data in AAL-template brain regions of normal controls, EMCI patients, LMCI patients, and AD patients, and constructed brain networks using the ADNI data set. Analysis of the global and nodal attributes showed that brain networks of all four groups presented a small-world network property characterized by large clustering coefficients and small shortest path lengths. The clustering coefficient was largest in normal controls, followed by EMCI, LMCI, and AD patients. The shortest path length was smallest in normal controls, began to increase in EMCI and LMCI patients, and was the longest in AD patients. This indicates that severe dementia is associated with the decline of general brain network efficiency, not a deficit in a single brain region. This also illustrates the necessity of multi-modal neuroimaging techniques and human neural-connection research. Many brain regions had different node attributes and these brain regions were associated with memory, language, reasoning, and other high-level cognitive functions, a finding consistent with cognitive impairment in AD patients as well as data from PET and structural MRI research. Further, regional brain impairment is regarded as the physiological basis of cognitive impairment during the progression of MCI to AD. We presume that memory impairment in MCI is caused by hearing and language dysfunctions, and that other cognitive impairments result from further diffuse brain injury.
It should be noted that we used a small sample size and failed to perform multiple comparisons and correction. Therefore, this exploratory study can only give preliminary conclusions, and future studies with larger sample sizes are required for results that are more definitive. In addition, measurement data for some subjects were not available in the ADNI data set, and thus we did not perform correlation analysis between the global network attributes and the scale, another topic that deserves attention in future investigations.
SUBJECTS AND METHODS
Design
A comparative analysis of fMRI data.
Time and setting
Experiments were performed from June 2012 to March 2013 at Taiyuan University of Technology, China.
Subjects
All data were obtained from the ADNI2 data set (www.loni.ucla.edu/ADNI). ADNI2 is a revision of ADNI1, and includes the additions of the EMCI and LMCI categories. LMCI is characterized by dysfunctions in logical memory and delayed recall, which are not present in EMCI. Therefore, we can use this discrepancy to distinguish LMCI and EMCI. Both LMCI and EMCI are often early stages of AD[31,32], and the EMCI patients bridge the gap between normal controls and LMCI patients.
Inclusion criteria
Normal control: (1) Mini-Mental State Examination (MMSE) score between 24 and 30 points. (2) Clinical Dementia Rating (CDR) score of 0. (3) Non-depressed. (4) Non-MCI. (5) No dementia.
EMCI subjects: (1) MMSE score between 24 and 30 points. (2) CDR score of 0.5. (3) Wechsler Memory Scale (WMS, Logical Memory I) score between 9 and 11 points.
LMCI subjects: (1) MMSE score between 24 and 30 points. (2) CDR score of 0.5. (3) WMS score less than 8 points.
AD subjects: (1) MMSE score between 22 and 26 points. (2) CDR score of 0.5 or 1.0. (3) Met the diagnostic criteria of the National Institute of Neurological and Communicative Disorders and Stroke and the AD and Related Disorders Association[33,34].
The resting-state functional data obtained in the first scans were adopted for every subject to exclude the impact of changes due to the disease course[36,55].
Methods
Data acquisition and pre-processing
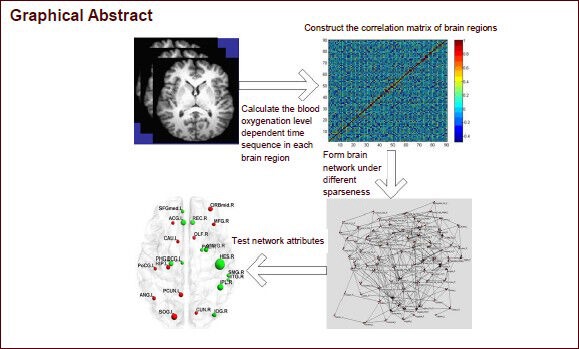
All the resting-state fMRI data were collected using 3.0 T MRI equipment (Philips, the Netherlands). During the scanning, subjects were kept conscious and clear headed and stationary. Scan parameters were as follows: repetition time = 3 000; slice thickness = 3.3; field strength = 3.0; echo time = 30.0, other parameters can be found on the ADNI website (http://adni.loni.ucla.edu/). Resting-state fMRI data were pre-processed as previously described[56]. In brief, data sets were subjected to tome-slice correction and motion correction, with head motion limited to less than 2 mm or 2°. The corrected images underwent spatial standardization, and conformed to MNI standard space with 3-mm voxels. Finally, images were filtered at low frequency (0.01–0.08 Hz), to reduce low-frequency drift and high-frequency biological noise.
Construction of functional brain networks
Using the AAL template[34], the whole brain was divided into 90 brain regions (45 in each hemisphere), each brain region was defined as a node in the network. The average time sequence of all voxels in the same brain region was calculated, as were the partial correlation coefficients between any two regions, and a 90 × 90 incidence matrix was obtained. According to the set threshold, the incidence matrix was transformed into a binary adjacency matrix. Thus, if the partial correlation coefficient between node i and node j was greater than a certain threshold, the matrix element aij was 1, indicating a connection between node i and node j. Otherwise, the value of aij was 0. If the correlation coefficient threshold was the same among all four groups, the number of connection lines and the size of the networks were different between the four groups, making it meaningless to analyze network and node attributes. Previous studies adopted sparseness as a means to determine the connection lines between nodes, so that different brain networks have the same size. Sparseness (S) is the ratio of the actual number of connection lines in a network to the maximum number (N) of possible connection lines[37]. In this experiment, we compared brain networks under the same sparsenesses. After the sparseness threshold was defined, the correlation coefficient of incidence matrix is arranged in a decreased manner. For example, if the correlation coefficient between nodes i and j is lower than S × N, a unidirectional connection line can be plotted between the nodes. There is no gold standard for the definition of the single sparseness threshold, and different sparsenesses lead to different experimental results[36,39,54]. Here we chose 11–30% sparseness at an interval of 0.01.
Network statistics, characteristics, and analysis
The characteristics of complex networks generally include global network attributes and node attributes. Node attributes consist of betweenness centrality and efficiency. The intermediate betweenness centrality (BC) of node i (BCi) is defined as the number of the shortest path lengths among other node pairs in network which cross through node i, and reflects the importance of node i in network[57]. The efficiency at node k (Ek) is defined as the average sum of the shortest path reciprocal between node k and other nodes in network, and reflects the degree of difficulty in transferring information from node k to other nodes. The higher the efficiency, the easier it is for information to be transmitted from node k to other nodes, and the fewer resources are consumed[58]. Global network attributes include the clustering coefficient and the average shortest path. Clustering coefficient (Cp) is the average clustering coefficient of all nodes in the network. The clustering coefficient of node i (Ci) is the ratio of the actual number of lines of other nodes (except node i) that connect with node i in network to the number of maximum possible lines for those nodes. Cp is used to measure the local information transmission efficiency in a network, with higher Cp values indicating a more efficient network. The shortest path length (Lp) is the average of the shortest path lengths of all nodes in the network. The shortest path on node i (Lpi) is the average of the shortest path lengths from node i to other nodes in network. Lp is used to measure the global information transmission efficiency in network, with lower shortest path lengths indicating faster information transmission. The ability to transmit information lays the base for network functional integration[59].
According to these definitions, the global attributes (the Lp and Cp) and node attributes (BCi and Ei) of each subject were calculated under each sparseness level. Owing to the small size and abnormal distribution of samples, many studies addressing brain network analysis use non-parametric tests[60,61]. Here we applied a non-parametric permutation test to compare the differences of global and node attributes between normal controls and EMCI patients, between EMCI and LMCI patients, and between LMCI and AD patients. The Cp and the Lp were averaged and significant differences were detected using a non-parametric two-sample Kolmogorov-Smirnov test. As for node attributes, BC and efficiency, we also performed non-parametric two-sample Kolmogorov-Smirnov test at different sparsities to determine the significant differences in brain region (P < 0.05), then found out the number of sparsities which existed significant difference of each brain region. Furthermore the number of subjects with significant differences under different sparseness levels was statistically analyzed (P < 0.05 was considered significant).
Research background: A means of finding early signs of Alzheimer's disease by imaging brain networks.
Research frontiers: When certain brain regions or subsystems are injured, the properties of brain networks change. Exploring the relationship between changes in brain network properties and neuropsychiatric disorders using imaging technology is a key topic in current research.
Clinical significance: Mild cognitive disorder and Alzheimer's disease-associated cognitive impairments are not caused by damage in only a few brain regions. Rather, they result from differing extents of damage to several brain regions, leading to alterations in the properties of brain networks. Changes in brain network properties or nodes might be good measures for clinical diagnoses.
Academic terminology: Resting-state functional brain network: a functional network constructed using fMRI data obtained while subjects lay quietly in the scanner, without performing any task or giving any responses. The observed activity is therefore spontaneous.
Peer review: Brain networks were constructed from resting-state fMRI data from four groups that were obtained using the Alzheimer's disease Neuroimaging Initiative data set. Data analysis revealed progressive changes in network function across groups (from health elderly to those with mild cognitive impairment and Alzheimer's disease), thus exploring the causes of diffuse brain injury and cognitive dysfunctions.
Acknowledgments
We sincerely thank the Alzheimer's Disease Neuroimaging Initiative for providing the data.
Footnotes
Funding: This study was sponsored by the National Natural Science Foundation of China, No. 61070077, 61170136, 61373101; the Natural Science Foundation of Shanxi Province, No. 2011011015-4; and Beijing Postdoctoral Science Foundation, No. Q6002020201201.
Conflicts of interest: None declared.
(Reviewed by Phillips A, Li HF, Cao XH)
(Edited by Yu J, Yang Y, Li CH, Song LP, Liu WJ, Zhao M)
REFERENCES
- [1].Brookmeyer R, Johnson E, Ziegler-Graham K, et al. Forecasting the global burden of Alzheimer's disease. Alzheimers Dement. 2007;3(3):186–191. doi: 10.1016/j.jalz.2007.04.381. [DOI] [PubMed] [Google Scholar]
- [2].Li J, Yu J, Niu YN. Neuropsychological impairment characteristics of MCI and its early detection and intervention: prevent and delay the onset of AD. Shengwu Huaxue yu Shengwu Wuli Jinzhan. 2012;39(8):804–810. [Google Scholar]
- [3].Petersen RC, Negash S. Mild cognitive impairment: an overview. CNS Spectr. 2008;13(1):45–53. doi: 10.1017/s1092852900016151. [DOI] [PubMed] [Google Scholar]
- [4].Misra C, Fan Y, Davatzikos C. Baseline and longitudinal patterns of brain atrophy in MCI patients, and their use in prediction of short-term conversion to AD: results from ADNI. Neuroimage. 2009;44(4):1415–1422. doi: 10.1016/j.neuroimage.2008.10.031. [DOI] [PMC free article] [PubMed] [Google Scholar]
- [5].Grundman M, Petersen RC, Ferris SH, et al. Mild cognitive impairment can be distinguished from Alzheimer disease and normal aging for clinical trials. Arch Neurol. 2004;61(1):59–66. doi: 10.1001/archneur.61.1.59. [DOI] [PubMed] [Google Scholar]
- [6].Petersen RC, Doody R, Kurz A, et al. Current concepts in mild cognitive impairment. Arch Neurol. 2001;58(12):1985–1992. doi: 10.1001/archneur.58.12.1985. [DOI] [PubMed] [Google Scholar]
- [7].Bischkopf J, Busse A, Angermeyer MC. Mild cognitive impairment--a review of prevalence, incidence and outcome according to current approaches. Acta Psychiatr Scand. 2002;106(6):403–414. doi: 10.1034/j.1600-0447.2002.01417.x. [DOI] [PubMed] [Google Scholar]
- [8].Du AT, Schuff N, Amend D, et al. Magnetic resonance imaging of the entorhinal cortex and hippocampus in mild cognitive impairment and Alzheimer's disease. J Neurol Neurosurg Psychiatry. 2001;71(4):441–447. doi: 10.1136/jnnp.71.4.441. [DOI] [PMC free article] [PubMed] [Google Scholar]
- [9].Jack CR, Jr, Petersen RC, Xu Y, et al. Rates of hippocampal atrophy correlate with change in clinical status in aging and AD. Neurology. 2000;55(4):484–489. doi: 10.1212/wnl.55.4.484. [DOI] [PMC free article] [PubMed] [Google Scholar]
- [10].Jack CR, Jr, Shiung MM, Weigand SD, et al. Brain atrophy rates predict subsequent clinical conversion in normal elderly and amnestic MCI. Neurology. 2005;65(8):1227–1231. doi: 10.1212/01.wnl.0000180958.22678.91. [DOI] [PMC free article] [PubMed] [Google Scholar]
- [11].Ding P, Wei WS, Ji M, et al. The study of brain proton magnetic resonance spectroscopy and the volume of the hippocampus in mild cognitive impairment and mild Alzheimer disease. Shiyong Fangshe Xue Zazhi. 2008;24(10):1313–1316. [Google Scholar]
- [12].Erten-Lyons D, Howieson D, Moore MM, et al. Brain volume loss in MCI predicts dementia. Neurology. 2006;66(2):233–235. doi: 10.1212/01.wnl.0000194213.50222.1a. [DOI] [PubMed] [Google Scholar]
- [13].Saka E, Dogan EA, Topcuoglu MA, et al. Linear measures of temporal lobe atrophy on brain magnetic resonance imaging (MRI) but not visual rating of white matter changes can help discrimination of mild cognitive impairment (MCI) and Alzheimer's disease (AD) Arch Gerontol Geriatr. 2007;44(2):141–151. doi: 10.1016/j.archger.2006.04.006. [DOI] [PubMed] [Google Scholar]
- [14].Xi YB, Qi S, Yin H, et al. Research on cortical volume changes of hippocampus and entorhinal in mild cognitive impairment. Zhonghua Shenjing Waike Jibing Yanjiu Zazhi. 2012;11(4):296–299. [Google Scholar]
- [15].Machulda MM, Ward HA, Borowski B, et al. Comparison of memory fMRI response among normal, MCI, and Alzheimer's patients. Neurology. 2003;61(4):500–506. doi: 10.1212/01.wnl.0000079052.01016.78. [DOI] [PMC free article] [PubMed] [Google Scholar]
- [16].Dickerson BC, Salat DH, Bates JF, et al. Medial temporal lobe function and structure in mild cognitive impairment. Ann Neurol. 2004;56(1):27–35. doi: 10.1002/ana.20163. [DOI] [PMC free article] [PubMed] [Google Scholar]
- [17].Petrella JR, Krishnan S, Slavin MJ, et al. Mild cognitive impairment: evaluation with 4-T functional MR imaging. Radiology. 2006;240(1):177–186. doi: 10.1148/radiol.2401050739. [DOI] [PubMed] [Google Scholar]
- [18].Yetkin FZ, Rosenberg RN, Weiner MF, et al. FMRI of working memory in patients with mild cognitive impairment and probable Alzheimer's disease. Eur Radiol. 2006;16(1):193–206. doi: 10.1007/s00330-005-2794-x. [DOI] [PubMed] [Google Scholar]
- [19].He Y. Advances on Alzheimer's disease with neuroimaging. Shengwu Huaxue yu Shengwu Wuli Jinzhan. 2012;39(8):811–815. [Google Scholar]
- [20].He Y, Evans A. Graph theoretical modeling of brain connectivity. Curr Opin Neurol. 2010;23(4):341–350. doi: 10.1097/WCO.0b013e32833aa567. [DOI] [PubMed] [Google Scholar]
- [21].Bassett DS, Bullmore ET. Human brain networks in health and disease. Curr Opin Neurol. 2009;22(4):340–347. doi: 10.1097/WCO.0b013e32832d93dd. [DOI] [PMC free article] [PubMed] [Google Scholar]
- [22].Guo H, Cao X, Liu Z, et al. Machine learning classifier using abnormal brain network topological metrics in major depressive disorder. Neuroreport. 2012;23(17):1006–1011. doi: 10.1097/WNR.0b013e32835a650c. [DOI] [PubMed] [Google Scholar]
- [23].Zuo XN, Ehmke R, Mennes M, et al. Network centrality in the human functional connectome. Cereb Cortex. 2012;22(8):1862–1875. doi: 10.1093/cercor/bhr269. [DOI] [PubMed] [Google Scholar]
- [24].Kaiser M, Hilgetag CC. Nonoptimal component placement, but short processing paths, due to long-distance projections in neural systems. PLoS Comput Biol. 2006;2(7):e95. doi: 10.1371/journal.pcbi.0020095. [DOI] [PMC free article] [PubMed] [Google Scholar]
- [25].Filippi M, Agosta F, Scola E, et al. Functional network connectivity in the behavioral variant of frontotemporal dementia. Cortex. doi: 10.1016/j.cortex.2012.09.017. in press. [DOI] [PubMed] [Google Scholar]
- [26].Delbeuck X, Van der Linden M, Collette F. Alzheimer's disease as a disconnection syndrome? Neuropsychol Rev. 2003;13(2):79–92. doi: 10.1023/a:1023832305702. [DOI] [PubMed] [Google Scholar]
- [27].He Y, Chen Z, Gong G, et al. Neuronal networks in Alzheimer's disease. Neuroscientist. 2009;15(4):333–350. doi: 10.1177/1073858409334423. [DOI] [PubMed] [Google Scholar]
- [28].Supekar K, Menon V, Rubin D, et al. Network analysis of intrinsic functional brain connectivity in Alzheimer's disease. PLoS Comput Biol. 2008;4(6):e1000100. doi: 10.1371/journal.pcbi.1000100. [DOI] [PMC free article] [PubMed] [Google Scholar]
- [29].Wang J, Zuo X, Dai Z, et al. Disrupted functional brain connectome in individuals at risk for Alzheimer's disease. Biol Psychiatry. 2013;73(5):472–481. doi: 10.1016/j.biopsych.2012.03.026. [DOI] [PubMed] [Google Scholar]
- [30].Drzezga A, Becker JA, Van Dijk KR, et al. Neuronal dysfunction and disconnection of cortical hubs in non-demented subjects with elevated amyloid burden. Brain. 2011;134(Pt 6):1635–1646. doi: 10.1093/brain/awr066. [DOI] [PMC free article] [PubMed] [Google Scholar]
- [31].Yao Z, Zhang Y, Lin L, et al. Abnormal cortical networks in mild cognitive impairment and Alzheimer's disease. PLoS Comput Biol. 2010;6(11):e1001006. doi: 10.1371/journal.pcbi.1001006. [DOI] [PMC free article] [PubMed] [Google Scholar]
- [32].Wee CY, Yap PT, Denny K, et al. Resting-state multi-spectrum functional connectivity networks for identification of MCI patients. PLoS One. 2012;7(5):e37828. doi: 10.1371/journal.pone.0037828. [DOI] [PMC free article] [PubMed] [Google Scholar]
- [33].Aisen PS, Petersen RC, Donohue MC, et al. Clinical Core of the Alzheimer's Disease Neuroimaging Initiative: progress and plans. Alzheimers Dement. 2010;6(3):239–246. doi: 10.1016/j.jalz.2010.03.006. [DOI] [PMC free article] [PubMed] [Google Scholar]
- [34].Tzourio-Mazoyer N, Landeau B, Papathanassiou D, et al. Automated anatomical labeling of activations in SPM using a macroscopic anatomical parcellation of the MNI MRI single-subject brain. Neuroimage. 2002;15(1):273–289. doi: 10.1006/nimg.2001.0978. [DOI] [PubMed] [Google Scholar]
- [35].Landau SM, Mintun MA, Joshi AD, et al. Amyloid deposition, hypometabolism, and longitudinal cognitive decline. Ann Neurol. 2012;72(4):578–586. doi: 10.1002/ana.23650. [DOI] [PMC free article] [PubMed] [Google Scholar]
- [36].Liu Z, Zhang Y, Yan H, et al. Altered topological patterns of brain networks in mild cognitive impairment and Alzheimer's disease: a resting-state fMRI study. Psychiatry Res. 2012;202(2):118–125. doi: 10.1016/j.pscychresns.2012.03.002. [DOI] [PubMed] [Google Scholar]
- [37].Sanz-Arigita EJ, Schoonheim MM, Damoiseaux JS, et al. Loss of ‘small-world’ networks in Alzheimer's disease: graph analysis of FMRI resting-state functional connectivity. PLoS One. 2010;5(11):e13788. doi: 10.1371/journal.pone.0013788. [DOI] [PMC free article] [PubMed] [Google Scholar]
- [38].Stam CJ, Jones BF, Nolte G, et al. Small-world networks and functional connectivity in Alzheimer's disease. Cereb Cortex. 2007;17(1):92–99. doi: 10.1093/cercor/bhj127. [DOI] [PubMed] [Google Scholar]
- [39].He Y, Chen Z, Evans A. Structural insights into aberrant topological patterns of large-scale cortical networks in Alzheimer's disease. J Neurosci. 2008;28(18):4756–4766. doi: 10.1523/JNEUROSCI.0141-08.2008. [DOI] [PMC free article] [PubMed] [Google Scholar]
- [40].Lo CY, Wang PN, Chou KH, et al. Diffusion tensor tractography reveals abnormal topological organization in structural cortical networks in Alzheimer's disease. J Neurosci. 2010;30(50):16876–16885. doi: 10.1523/JNEUROSCI.4136-10.2010. [DOI] [PMC free article] [PubMed] [Google Scholar]
- [41].Bai F, Shu N, Yuan Y, et al. Topologically convergent and divergent structural connectivity patterns between patients with remitted geriatric depression and amnestic mild cognitive impairment. J Neurosci. 2012;32(12):4307–4318. doi: 10.1523/JNEUROSCI.5061-11.2012. [DOI] [PMC free article] [PubMed] [Google Scholar]
- [42].Kurz A, Pohl C, Ramsenthaler M, et al. Cognitive rehabilitation in patients with mild cognitive impairment. Int J Geriatr Psychiatry. 2009;24(2):163–168. doi: 10.1002/gps.2086. [DOI] [PubMed] [Google Scholar]
- [43].Rozzini L, Costardi D, Chilovi BV, et al. Efficacy of cognitive rehabilitation in patients with mild cognitive impairment treated with cholinesterase inhibitors. Int J Geriatr Psychiatry. 2007;22(4):356–360. doi: 10.1002/gps.1681. [DOI] [PubMed] [Google Scholar]
- [44].Talassi E, Guerreschi M, Feriani M, et al. Effectiveness of a cognitive rehabilitation program in mild dementia (MD) and mild cognitive impairment (MCI): a case control study. Arch Gerontol Geriatr. 2007;44(Suppl 1):391–399. doi: 10.1016/j.archger.2007.01.055. [DOI] [PubMed] [Google Scholar]
- [45].Wenisch E, Cantegreil-Kallen I, De Rotrou J, et al. Cognitive stimulation intervention for elders with mild cognitive impairment compared with normal aged subjects: preliminary results. Aging Clin Exp Res. 2007;19(4):316–322. doi: 10.1007/BF03324708. [DOI] [PubMed] [Google Scholar]
- [46].Karlsgodt KH, Shirinyan D, van Erp TG, et al. Hippocampal activations during encoding and retrieval in a verbal working memory paradigm. Neuroimage. 2005;25(4):1224–1231. doi: 10.1016/j.neuroimage.2005.01.038. [DOI] [PubMed] [Google Scholar]
- [47].Margulies DS, Vincent JL, Kelly C, et al. Precuneus shares intrinsic functional architecture in humans and monkeys. Proc Natl Acad Sci U S A. 2009;106(47):20069–20074. doi: 10.1073/pnas.0905314106. [DOI] [PMC free article] [PubMed] [Google Scholar]
- [48].Broadbent NJ, Squire LR, Clark RE. Spatial memory, recognition memory, and the hippocampus. Proc Natl Acad Sci U S A. 2004;101(40):14515–14520. doi: 10.1073/pnas.0406344101. [DOI] [PMC free article] [PubMed] [Google Scholar]
- [49].Langers DR, Backes WH, van Dijk P. Representation of lateralization and tonotopy in primary versus secondary human auditory cortex. Neuroimage. 2007;34(1):264–273. doi: 10.1016/j.neuroimage.2006.09.002. [DOI] [PubMed] [Google Scholar]
- [50].Killian NJ, Jutras MJ, Buffalo EA. A map of visual space in the primate entorhinal cortex. Nature. 2012;491(7426):761–764. doi: 10.1038/nature11587. [DOI] [PMC free article] [PubMed] [Google Scholar]
- [51].Shan CL, Li JW, Weng XC. Visual word form processing: from brain areas to neural pathways. Xinli Kexue Jinzhan. 2008;16(3):441–445. [Google Scholar]
- [52].Stein T, Moritz C, Quigley M, et al. Functional connectivity in the thalamus and hippocampus studied with functional MR imaging. AJNR Am J Neuroradiol. 2000;21(8):1397–1401. [PMC free article] [PubMed] [Google Scholar]
- [53].Burgess N, Maguire EA, O’Keefe J. The human hippocampus and spatial and episodic memory. Neuron. 2002;35(4):625–641. doi: 10.1016/s0896-6273(02)00830-9. [DOI] [PubMed] [Google Scholar]
- [54].Xie T, He Y. Mapping the Alzheimer's brain with connectomics. Front Psychiatry. 2011;2:77. doi: 10.3389/fpsyt.2011.00077. [DOI] [PMC free article] [PubMed] [Google Scholar]
- [55].Chu C, Hsu AL, Chou KH, et al. Does feature selection improve classification accuracy? Impact of sample size and feature selection on classification using anatomical magnetic resonance images. Neuroimage. 2012;60(1):59–70. doi: 10.1016/j.neuroimage.2011.11.066. [DOI] [PubMed] [Google Scholar]
- [56].Chao-Gan Y, Yu-Feng Z. DPARSF: a MATLAB toolbox for “Pipeline” data analysis of resting-state fMRI. Front Syst Neurosci. 2010;4:13. doi: 10.3389/fnsys.2010.00013. [DOI] [PMC free article] [PubMed] [Google Scholar]
- [57].Freeman LC. A set of measures of centrality based on betweenness. Sociometry. 1977;40(1):35–41. [Google Scholar]
- [58].Achard S, Bullmore E. Efficiency and cost of economical brain functional networks. PLoS Comput Biol. 2007;3(2):e17. doi: 10.1371/journal.pcbi.0030017. [DOI] [PMC free article] [PubMed] [Google Scholar]
- [59].Watts DJ, Strogatz SH. Collective dynamics of ‘small-world’ networks. Nature. 1998;393(6684):440–442. doi: 10.1038/30918. [DOI] [PubMed] [Google Scholar]
- [60].Bullmore ET, Bassett DS. Brain graphs: graphical models of the human brain connectome. Annu Rev Clin Psychol. 2011;7:113–140. doi: 10.1146/annurev-clinpsy-040510-143934. [DOI] [PubMed] [Google Scholar]
- [61].Zhang J, Wang J, Wu Q, et al. Disrupted brain connectivity networks in drug-naive, first-episode major depressive disorder. Biol Psychiatry. 2011;70(4):334–342. doi: 10.1016/j.biopsych.2011.05.018. [DOI] [PubMed] [Google Scholar]