Abstract
Depression is closely linked to the morphology and functional abnormalities of multiple brain regions; however, its topological structure throughout the whole brain remains unclear. We collected resting-state functional MRI data from 36 first-onset unmedicated depression patients and 27 healthy controls. The resting-state functional connectivity was constructed using the Automated Anatomical Labeling template with a partial correlation method. The metrics calculation and statistical analysis were performed using complex network theory. The results showed that both depressive patients and healthy controls presented typical small-world attributes. Compared with healthy controls, characteristic path length was significantly shorter in depressive patients, suggesting development toward randomization. Patients with depression showed apparently abnormal node attributes at key areas in cortical-striatal-pallidal-thalamic circuits. In addition, right hippocampus and right thalamus were closely linked with the severity of depression. We selected 270 local attributes as the classification features and their P values were regarded as criteria for statistically significant differences. An artificial neural network algorithm was applied for classification research. The results showed that brain network metrics could be used as an effective feature in machine learning research, which brings about a reasonable application prospect for brain network metrics. The present study also highlighted a significant positive correlation between the importance of the attributes and the intergroup differences; that is, the more significant the differences in node attributes, the stronger their contribution to the classification. Experimental findings indicate that statistical significance is an effective quantitative indicator of the selection of brain network metrics and can assist the clinical diagnosis of depression.
Keywords: nerve regeneration, depression, functional MRI, graph theory, complex networks, brain network, classification, feature selection, NSFC grant, neural regeneration
Introduction
In recent years, resting-state functional MRI has been widely used in depression research. The study method is summarized into two types: analysis of region of interest (ROI)[1] and independent component analysis[2]. In the ROI-based analysis, some ROIs are selected as seed points according to prior knowledge, and then the functional connectivity model between the seed points and other brain regions is established. In contrast, independent component analysis can be adopted for data analysis of the whole brain, with no need for pre-set seed points, and is then divided into several independent components, with the connection model between independent components established.
Anand et al.[3] found, using ROI analysis, that functional connectivity in anterior cingulate cortex, limbic system and thalamic area was significantly reduced in patients with depression, suggesting a regulation effect on subcortical emotional circuits. Cullen et al.[4] also found the anterior cingulate to be an important area in depression pathological circuits and used ROI analysis to observe a significant reduction in functional connectivity in bilateral prefrontal-limbic-thalamic regions. Bluhm et al.[5] revealed that the bilateral precuneus and posterior cingulate cortex had significantly reduced functional connectivity with the caudate nucleus, suggesting the presence of dysfunction in the corpus striatum of depression patients. Sheline et al.[6] demonstrated a significant enhancement of functional connectivity in depression patients between the dorsal medial prefrontal lobe and the precuneus, and between the dorsal lateral prefrontal lobe and the anterior cingulate. Results from independent component analysis also supported the ROI analysis results; for example, Greicius et al.[2] found significantly enhanced functional connectivity in the anterior cingulate, thalamus, orbital frontal lobe and precuneus in depression patients, and that functional connectivity in the cingulate gyrus was positively correlated with the duration of depression. In addition, regional homogeneity has attracted increasing attention in the field of depression. Depression patients presented significantly abnormal regional homogeneity in the anterior cingulate gyrus, insula, thalamus, hippocampus, caudate nucleus, precuneus and fusiform gyrus[7,8,9,10].
The analysis of brain networks is an important method for neuroimaging research focusing on schizophrenia[11,12,13,14,15], Alzheimer's disease[16,17,18], epilepsy[19,20,21], attention deficit hyperactivity disorder[22], and stroke[23,24], as well as depression. Jin et al.[25] found some network abnormalities in some brain regions of unmedicated young patients with first-onset depression, including the anterior cingulate, dorsolateral prefrontal lobe, insula, amygdala and partial temporal lobe; the degree value of the amygdala showed significant positive correlation with the duration of disease. Tao et al.[26] constructed a resting-state functional brain network and found that, compared with healthy controls, both first-onset or long-term depression was accompanied by apparent abnormalities in the hate circuit, including the superior frontal gyrus, insula and lenticular nucleus; significant differences were also found in brain regions closely related to reward, emotion, attention and memory processing. These findings reveal that depression patients are different from healthy people in terms of their cognitive control and negative emotional expression.
The aforementioned resting-state functional MRI data showed that the frontal lobe, limbic system and thalamus are closely linked with depression. This evidence provides a radiological sign for depression diagnosis. These potential indicators can be applied to machine learning research, allowing the construction of diagnostic models and assist clinical diagnosis.
To explore thinking patterns and cognitive status, machine learning and pattern recognition have been widely used in functional MRI data analysis, including forecasting conscious visual perception, lie detection, word reading and face recognition[27]. In addition, machine learning methods have also been applied to the study of brain diseases. Costafreda et al.[28] and Fu et al.[29] classified structural and functional MRI data in healthy controls and patients with depression using a support vector machine classifier, and the classification accuracy was 67% and 86% respectively. Gong et al.[30] used a support vector machine classifier to classify refractory and non-refractory depression using inter-group differences of gray matter and white matter, and the accuracy rate reached 65.22% and 76.09% respectively.
It still remains elusive whether resting-state functional brain network metrics can be used effectively in machine learning methods for the classification of brain diseases. Moreover, the feature selection, number and evaluation are poorly understood. In this study, we analyzed the whole brains of depression patients using brain network metrics and hypothesized that the brain network topology structure of patients with depression is disordered. To test this hypothesis, resting-state functional MRI data were collected from 38 first-onset unmedicated depression patients and 28 healthy controls, to construct a resting-state functional brain network. The changes in the brain network under the depression state were analyzed using global and local attributes, in an effort to explore the radiological signs of the early diagnosis of depression and verify the potential value of brain network metrics in clinical diagnosis.
Results
Quantitative analysis of subjects
Thirty-eight unmedicated patients with first-onset severe depression (the depression group) and 28 healthy volunteers who were age- and sex-matched (the control group) were included in this study. Two cases in the depression group and one case in the control group were excluded due to head movement greater than 3 mm or 3° rotation. Demographic information for the involved participants is shown in Table 1.
Table 1.
Demographic information of participants

Resting-state functional brain network global attributes of unmedicated patients with first-onset depression
Both depression patients and healthy controls showed apparent small-world attributes in resting-state functional brain networks compared with random networks and regular networks within the predetermined threshold. The clustering coefficient γ > 1 and the characteristic path length λ ≈ 1 (Figure 1). The small-world attribute was also found in both the depression group and the control group when we calculated network efficiency. Our findings are consistent with previous studies of brain networks[31,32].
Figure 1.
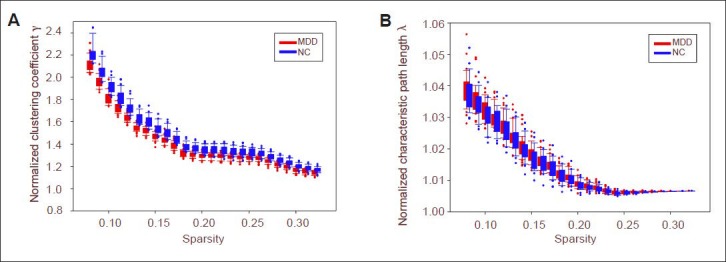
Clustering coefficient γ (A) and characteristic path length λ (B) of resting-state functional brain network in healthy controls and depression patients at different sparsities.
Clustering coefficient γ was > 1 (A) and characteristic path length λ was close to 1 (B) in two groups. Red column represents depression group (MDD) and blue column represents control group (NC). Dots represent outliers. Both ends of the box are upper quadrant lines and lower quadrant lines respectively. Both ends of upper and lower hatched lines are upper edge line and lower edge line respectively.
However, there were significant differences in small-world parameters and network efficiency between the depression group and the control group (Figure 2). Characteristic path length was significantly shorter and global efficiency was significantly greater in the depression group compared with the control group (P < 0.05, no check). The clustering coefficient and local efficiency showed no significant differences (P > 0.05).
Figure 2.
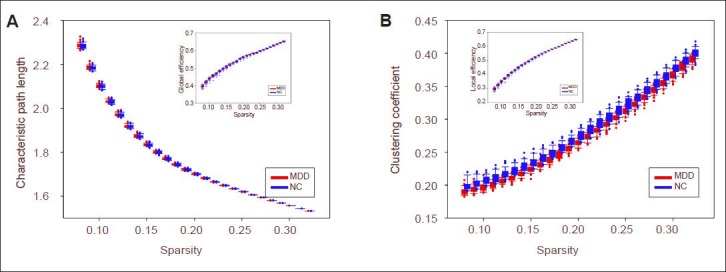
Global attributes of depression group and control group at different sparsities, including characteristic path length (A), clustering coefficient (B), global efficiency and local efficiency.
Red represents depression group (MDD) and blue represents control group (NC). Dots represent outliers. Both ends of the box are upper quadrant lines and lower quadrant lines respectively. Both ends of upper and lower hatched lines are upper edge line and lower edge line respectively.
Resting-state functional brain network node attributes of unmedicated patients with first-onset depression
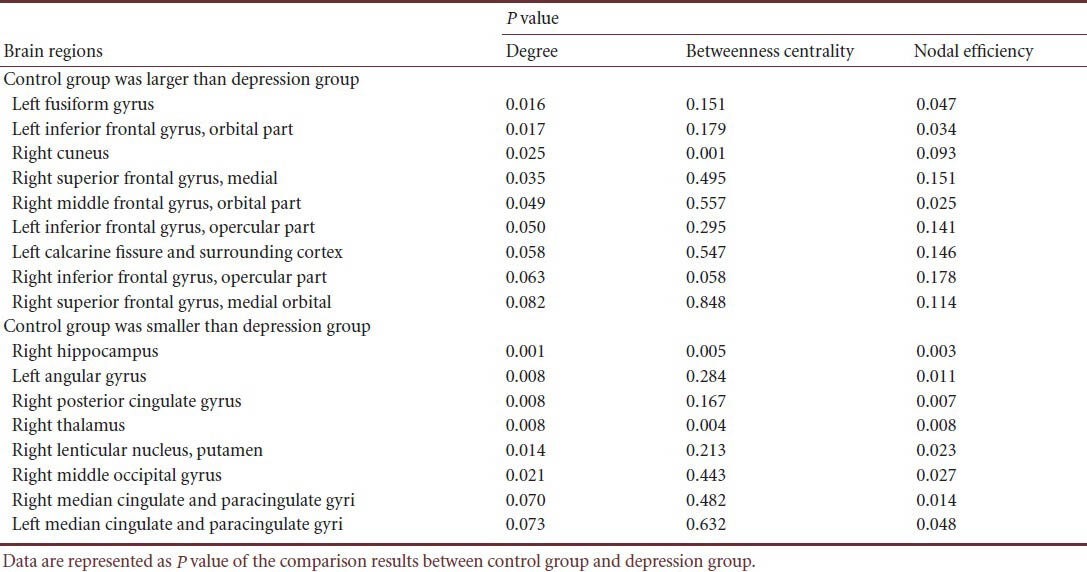
Compared with the control group, resting-state functional brain network node degree was significantly increased in the limbic system (including the right hippocampus, right posterior cingulate gyrus, bilateral medial cingulate gyri, right thalamus), basal ganglia (right putamen and right thalamus) and inferior parietal lobule (right angular gyrus) of depression patients (P < 0.05, no check), which were the default network key areas. In depression patients, node degree was significantly reduced in the following brain regions: medial occipital lobe (including right cuneus lobe and left calcarine fissure and surrounding cortex), medial temporal lobe (left fusiform gyrus) and prefrontal lobe (including left inferior frontal gyrus, orbital part, right medial superior frontal gyrus, right orbital middle frontal gyrus, bilateral opercular inferior frontal gyrus and right orbital superior frontal gyrus) (P < 0.05, no check), which were the key regions in the limbic-cortical-striatal-globus pallidus-thalamic circuit (corresponding to the hippocampus, cingulate gyrus, lentiform nucleus, and thalamus) (Figure 3, Table 2).
Figure 3.
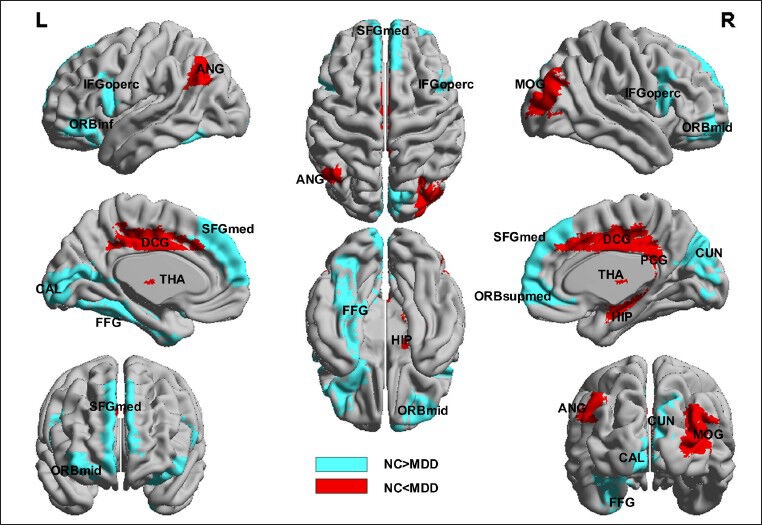
Brain regions with node abnormalities of resting-state functional brain network in unmedicated patients with first-onset depression.
Spectrum analysis adopted ICBM 152 and images were plotted using BrainNet (http://www.nitrc.org/projects/bnv/). Red represents brain regions with increasing node degree of resting-state functional network in depression patients, and blue represents brain regions with decreasing node degree of resting-state functional network in depression patients. L: Left; R: right; FFG: fusiform gyrus; ORBinf: inferior frontal gyrus (orbital part); CUN: cuneus; SFGmed: superior frontal gyrus (medial); ORBmid: middle frontal gyrus (orbital part); IFGoperc: inferior frontal gyrus (opercular part); CAL: calcarine fissure and surrounding cortex; ORBsupmed: superior frontal gyrus (medial orbital); HIP: hippocampus; ANG: angular gyrus; PCG: posterior cingulate gyrus; THA: thalamus; MOG: middle occipital gyrus; DCG: median cingulate and paracingulate gyri; NC: control group; MDD: depression group.
Table 2.
Brain regions with node abnormalities of resting-state functional brain network in unmedicated patients with first-onset depression
Correlation between resting-state functional brain network node metrics and Hamilton Rating Scale for Depression score (HAMD) in unmedicated patients with first-onset depression
We detected the correlation between node metrics, area under the curve (AUC) and HAMD scores. The results showed that the degree and nodal efficiency at the right hippocampus were significantly negatively correlated with HAMD scores, while those at the right thalamus showed a positive correlation. The betweenness centrality at the right hippocampus and thalamus was not correlated with HAMD scores. This evidence implies that the connectivity at the right hippocampus was decreased while that at the right thalamus was increased with the severity of the disease. No effect on information transmission at other nodes was found (Figure 4).
Figure 4.
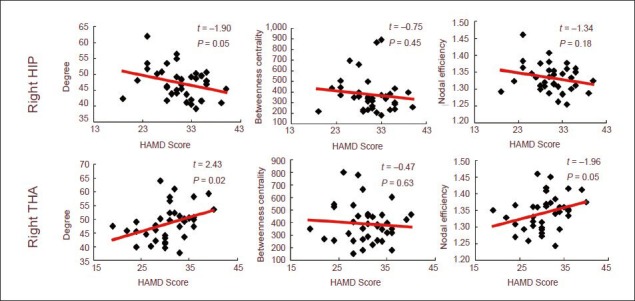
Scatterplot of right hippocampus and right thalamus with Hamilton Rating Scale for Depression (HAMD) score (24-item).
The connectivity of the right hippocampus was decreased while that of the right thalamus was increased, and no effect on the information transmission at other nodes was found. Data were analyzed using regression analysis and red lines represent the regression line.
Resting-state functional brain network classification model in unmedicated patients with first-onset depression
The classification model was constructed with a neural network classification algorithm method using the statistical significance of the features of 270 local node attributes (90 nodes and three attributes at each node). The 270 indices were ranked according to their statistical significance threshold P values and the interval for feature selection was set as 10. When the number of features was 30, the classification results were the best and the accuracy rate was 90.5% (Figure 5).
Figure 5.
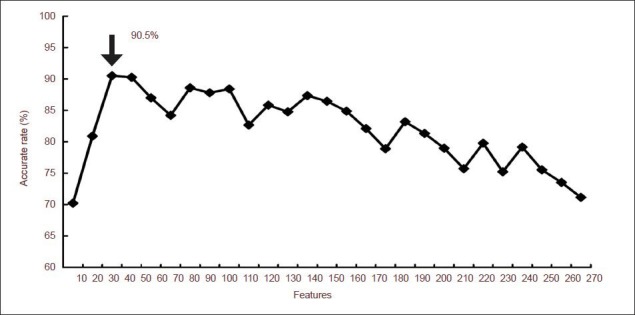
The average accuracy rate of the artificial neural network classification model.
The arrow indicates the highest accuracy rate of classification results. When the number of features is 30, the accuracy rate reaches 90.50% (arrow).
Importance and significance of resting-state functional brain network features in unmedicated patients with first-onset depression
The variations of each feature in target classification were calculated using a sensitivity analysis method to determine the importance of this feature in the classification process. The results from the node attributes showed statistical significance in betweenness centrality and nodal efficiency at the right hippocampus; degree and nodal efficiency at the right middle frontal gyrus (orbital part), left angular gyrus, right posterior cingulate gyrus, right median cingulate and paracingulate gyri; degree at the left fusiform gyrus, right medial superior frontal gyrus, left inferior frontal gyrus (orbit part); and nodal efficiency at the right precuneus. Meanwhile, some features showed nonsignificant differences such as the betweenness centrality at the left middle frontal gyrus and left middle temporal gyrus; these attributes at significantly different nodes also exhibited great importance (supplementary Figure 1 online). Furthermore, the correlation analysis between the importance of the features and the significance of intergroup difference showed that the importance of the degree, betweenness centrality and nodal efficiency was significantly positively correlated with intergroup difference. That is, the more significant the node feature difference, the more important its contribution to classification results (Figure 6). The intergroup difference results are a potential indicator of feature selection.
Figure 6.
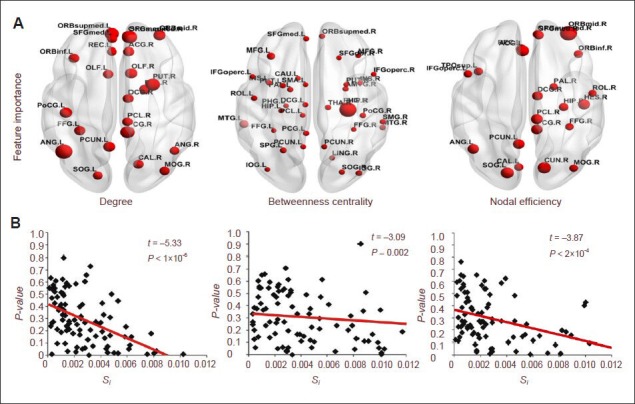
Correlation analysis of statistical significance and importance of features in brain regions.
(A) Brain regions showing an importance of feature greater than 0.004. The size of dots represents the value of the feature's importance. The bigger the dot is, the greater the value is.
(B) Correlation analysis of statistical significance and the importance of features. Data are analyzed using regression analysis. Red lines represent the regression lines. Spectrum adopts ICBM 152 and images are plotted using BrainNet (http://www.nitrc.org/projects/bnv/). Si indicates the importance of features (supplementary Text 1 online).
Discussion
Brain networks have been widely studied with respect to different spatial and temporal dimensions, including genes, proteins, synapses, neurons in each brain region and the whole brain. The structural complexity of the human brain reflects its composition in different dimensions and its patterns of cognition, feelings, behavior and disease states[33]. Even in the same dimension, different definitions of network size induce different topological features[34].
This study aims to observe variations in the brain network features of depression patients, construct a functional brain network using resting-state functional MRI data, calculate brain network metrics and compare intergroup differences. The results showed that both depression group and control group exhibited typical small-world features. Due to a high clustering coefficient and short path length, small-world networks allow specific modularized information processing in the adjacent region and integrated or differentiated information processing among different components of the whole network. Therefore, small-world networks reflect the basic principles of a brain network: functional integration and functional differentiation.
However, the brains of depression patients show significant differences in these small-world parameters. Depression has a shorter characteristic path length and stronger global efficiency, but no difference was found in local attributes between the groups. This evidence suggests that long-distance connections were increased in the brain networks of depression patients compared with the healthy control group. The brain network in the depression group trended toward randomization. Randomized brain networks are also found in other brain diseases, such as Alzheimer's disease[32,35] and schizophrenia[13]. Changes toward randomized brain networks in depressed patients obscure the role of key nodes and reduce the degree of modularity of the network, which provides new evidence that depression is a kind of divisive mental illness.
The results of node metrics analysis showed that depression patients showed a significant increase in the degree of nodes at the following brain regions: some limbic system regions (right hippocampus, right posterior cingulate gyrus, bilateral medial cingulate gyrus and paracingulate gyrus), some basal ganglia regions (right lenticular nucleus and right thalamus) and a region of the inferior parietal lobe (right angular gyrus) in comparison with the control group. Current research addressing the neuropathological mechanisms of depression is mainly focused on the widely recognized limbic-cortical-striatal-pallidal-thalamic circuit[36]. Accumulating evidence suggests that depression is closely linked with the morphology and function of this circuit. For instance, the prefrontal cortex, anterior cingulate cortex, basal ganglia, thalamus, hippocampus and amygdala volume is reduced in depressed patients[37,38,39], and the left insular cortex and cingulate activation are significantly enhanced in depressed patients during a negative emotional facial stimuli task[40]. Some studies of functional connectivity have also revealed abnormal connections in areas related to the limbic-cortical-striatal-pallidal-thalamic circuit. For instance, functional connectivity between the anterior cingulate gyrus and hippocampus, and between the amygdala and insula are reduced[41], while that between the subgenual cingulate and the thalamus are enhanced[2]. The present study demonstrated that the hippocampus, cingulate gyrus, putamen and thalamus are the key areas in the limbic-cortical-striatal-pallidal-thalamic circuit, and that the enhanced connectivity was an indicator of strengthened cooperation at these areas, which is presumably caused by depression. Our findings demonstrate novel evidence for the role of the limbic-cortical-striatal-pallidal-thalamic circuit in the pathological mechanism of depression from the perspective of brain networks.
The connectivity of the right hippocampus was negatively correlated with the severity of depression (HAMD 24-item score); the more severe the patient's illness, the fewer connections the right hippocampus had. Our finding is consistent with previous studies, which showed a negative correlation between hippocampus connectivity and the severity of clinical symptoms in untreated patients with first-onset depression[42,43]. We speculate that the severity of depression is mediated by hippocampal morphology or functional connectivity. In addition, the connectivity of the right thalamus was positively correlated with the severity of the depression; the more severe the disease, the more connections the right thalamus had. A previous anatomical study found that the number of thalamic neurons in depression patients was significantly higher than in healthy people[44]. The functional connectivity presented varying degrees of abnormality in the thalamus, and the default network crucial areas such as the anterior cingulate gyrus and subgenual cingulate gyrus. The present study provided novel support for explaining that the hippocampus and hypothalamus are the key brain regions involved in depression.
The degree of nodes was significantly reduced in the median occipital lobe (including the right cuneus, left calcarine fissure and surrounding cortex), medial temporal lobe (left fusiform gyrus) and prefrontal lobe (including the left orbital inferior frontal gyrus, right median superior frontal gyrus, right orbital middle frontal gyrus, bilateral opercular inferior frontal gyrus and right orbital superior frontal gyrus). Concerns about abnormal changes in the prefrontal lobe of depressed patients have gained momentum[45], especially in the morphology[46,47] and functionality[48]. The orbital part mentioned in this study has been previously reported. For example, gray matter volume in the orbital region was significantly reduced in elderly patients with depression[49]. Furthermore, gray matter volume in the left orbital region was negatively correlated with the patient's age[50]. Reduction in the functional connectivity in the prefrontal area is an indicator of weakening information conduction, which is presumably caused by depression. We also found reduced connectivity in the occipital part, including the cuneus, calcarine fissure and surrounding cortex. It is known that gray matter volume is reduced at the cuneus[51]. In addition, reduced white matter integrity contributed to the occipital part in untreated patients with first-onset depression[52]. Our findings are consistent with the aforementioned studies.
The importance of 270 local node attributes in the neural network model was determined using sensitivity methods to detect the contribution of each feature in the model. The results showed that related features in the majority of brain regions with statistically significant differences provided a strong contribution to the classification, including the betweenness centrality in the right hippocampus, right orbital middle frontal gyrus and right cuneus; and the degree and nodal efficiency in the left angular gyrus, right posterior cingulate gyrus, right medial and paracingulate gyri. Depression is the contributing factor in the morphological and functional abnormalities in these brain regions[53,54,55,56].
The present study also demonstrated this finding from the perspective of machine learning experiments. The results of importance analysis also highlighted the contribution of nonsignificant features, such as the betweenness centrality at the left middle frontal gyrus and left middle temporal gyrus. The changes of brain region in depression have been previously studied[57,58]. The presence of these features illustrates that, from a statistical point of view, the limited sample set did not show significant differences between groups, but could cause significant changes in the control variables. It is noted that significant differences between the groups are an indicator of feature selection (but the reliability of the sample size should be considered). Our results showed that brain network metrics can be characterized as an effective feature in machine learning and assist to achieve the automatic identification of disease data, thus providing a novel means for the diagnosis of disease and clinical applications. The study also gives a reasonable direction for brain network metrics.
In addition, we performed a correlation analysis on the feature importance and intergroup differences of node degree, betweenness centrality and nodal efficiency. The results showed a strong positive correlation, indicating that the more significant the differences of the node features, the stronger the contribution to the classification. We tentatively put forward that the differences in the features are potential indicators of feature selection. The results of statistical significance can be used to measure the contribution of selected features in the classification process; that is, an effective quantitative evaluation indicator of feature selection of the brain network.
There are still some limitations. First, there are two key issues in any area of network research: definition of nodes and definition of connections. In brain networks, these two definitions remain poorly understood. The spatial dimension defined in the brain network nodes exhibit different topological system features[34,59,60]. In this study, the definition of brain network nodes follows the traditional brain regional level. If the spatial dimension in the node definition is changed, is the previous conclusion still valid? Have any new conclusions emerged? Which spatial dimension of node definition is the most suitable for outlining the network topology structure in depression? These problems require further research. Second, brain network construction and analysis were carried out in the target population, and the homogeneity of data was ensured with the HAMD score, which ignored the differences between individuals. Exploration of the specific brain network topology structure for different clinical symptoms has a clinical application prospect. Third, the sample size here was small due to limitations in costs, equipment and participants. From a statistical point of view, the experimental results were not completely convincing; thus, large-sample studies are urgently needed. Fourth, we found that statistical significance could be used as an indicator of feature selection for a classification model; when the number of features was 30, the accuracy rate was highest. However, the optimal number of features is involved in a variety of factors, including sample size, type of classifiers, and distribution of samples, as well as the effectiveness and sorting of selected features. How to determine the optimal number of features plays a crucial role in constructing an effective classification model. Meanwhile, different brain diseases may require different brain network construction methods and different statistical methods, which deserve further research.
The present study showed that both the depression group and the control group exhibited typical small-world attributes. The node attribute was significantly abnormal in the cortex-striatum-globus pallidus-thalamic neural circuits of depressed patients. We used the attributes with significant differences between groups as classification features in machine learning methods, and achieved an accuracy rate of up to 90.5%. We tentatively put forward that the differential index of resting-state functional brain networks can be used as effective features in classification studies. Our finding gives a reasonable application method of brain network metrics. In addition, the correlation analysis between the importance and statistical significance of node attributes was detected using a sensitivity analysis method, and the results showed that the features with statistical significance played a stronger contributory role in the classification process. This evidence suggests that statistical significance is a potential method of feature selection for brain networks. The present study provided objective imaging data, explored the potential brain network index to assist clinical diagnosis, and brought about a novel means for depression diagnosis.
Subjects and Methods
Design
A comparative analysis on imaging data.
Time and setting
Data were collected from the Department of Psychiatry, the First Affiliated Hospital, Shanxi Medical University, China between September 2010 and June 2011.
Subjects
Thirty-eight unmedicated patients with first-onset severe depression (the depression group) and 28 healthy volunteers who were age- and sex-matched (the control group) were included in this study.
Depression group: Depression patients, Han population, were recruited from Department of Psychiatry, the First Affiliated Hospital, Shanxi Medical University, China. They were diagnosed according to the diagnostic criteria of the Diagnostic and Statistical Manual of Mental Disorders, Fourth Edition[61]. The severity of depression was determined with the 24-item HAMD[62] and the Clinical Global Impression of Severity[63]. Patients were excluded if they met the following criteria: secondary depression or bipolar disorder caused by other organs or drugs; received any medical treatments prior to recruitment; suffering from alcohol dependence, schizophrenia and schizoaffective disorder according to the Schedule of Clinical Interview for Diagnosis Alcoholic Dependence; suffering from serious physical illness or neurological disorders; biochemical markers or EEG, ECG were abnormal by physical examination and laboratory examination; pregnant or lactating women; in serious suicidal or injury attempt; excited, impulsive and uncooperative patients; participated in other medical treatment within the last month.
Control group: Healthy volunteers were enlisted by random advertising and matched the depressed patients in age and gender. All controls had no history of mental or neurological disorders, and personality assessment was detected as normal according to the Structured Clinical Interview for DSM-IV Dissociative Disorders[64].
All participants and their families gave informed consent.
Methods
Image acquisition
All the subjects underwent resting-state functional MRI scan using 3T MR equipment (Siemens Trio 3-Tesla scanner, Siemens, Erlangen, Germany). During the scan, subjects were instructed to relax with their eyes closed but not to fall asleep. Scanning parameters are shown in supplementary Text 2 online.
Data preprocessing
Data preprocessing was performed using SPM8 software (http://www.fil.ion.ucl.ac.uk/spm). First, the data set was subject to slice timing correction and head movement correction. The corrected images were optimized by 12-dimensional affine transformation and then conformed to 3 mm voxel MNI space. Finally, the images were filtered using low-pass filtering (0.06–0.11 Hz) to reduce low-pass drift and high-pass noise.
Construction of brain network
Using the Automated Anatomical Labeling template[65], the whole brain was divided into 90 brain regions (45 in each hemisphere), and each brain region was defined as a node in the network (supplementary Table 1 online). The average time sequence of all voxels in the same brain region was calculated as the time series of this region. The number of connection lines in the network was defined using the partial correlation coefficient. The time sequence of each brain region was obtained and subject to multivariate linear regression to remove the influence of head movement. Then the partial correlation coefficients between any two regions were calculated and a 90 × 90 incidence matrix was obtained (supplementary Figure 2A online). Finally, according to the set threshold τ, the incidence matrix was transformed into a binary adjacency matrix (supplementary Figure 2B online). Thus, if the partial correlation coefficient between node i and node j was greater than a certain threshold S, the matrix element aij was 1, indicating a connection between node i and node j. Otherwise, the value of aij was 0.
Network analysis
The image dimensions and connectivity intensity contribute to the quantization of metrics in complex network comparative studies. Therefore, quantitative topological features should be controlled before comparison among complex networks. Bollobás et al.[66] proposed two gold standards for the comparison of complex networks: the same number of nodes and the same number of connection lines. In this study, we adopted sparseness S to define the threshold. Sparseness (S) is the ratio of the actual number of connection lines in a network to the maximum number (N) of possible connection lines. Previous studies showed that brain networks are typical low-consumption networks and show typical small-world attributes. Meanwhile, the consumption/efficiency ratio of the small-world attributes showed an apparent positive correlation and reached a peak when S = 0.3[33]. Therefore, determining the threshold with small-world attributes can remove pseudo connections. (1) The average degree of all the nodes (degree is the number of connection lines to this node) is greater than 2 × Lg (N), N = 90. N is the number of nodes in the network. (2) The small-world attribute index σ > 1.1. The threshold space was calculated as S ∈ (8%, 32%). The network analysis was also performed in this space at an interval of 0.01.
Network statistics
After the brain network was constructed, the global and local network attributes at each threshold were calculated (the index of attributes is shown in the following table and the calculation is shown in supplementary Text 3 online). Meanwhile, AUC (supplementary Figure 3 online) for each index was calculated to represent the global attribute of each index at the selected threshold.
Data analysis
To determine whether global attributes have significant differences between the groups, the AUC for each index (including global attributes and node attributes) was subject to non-parametric permutation tests. Multiple linear regression analysis was used to remove the effects of gender and age on the results.
Brain network analysis index:
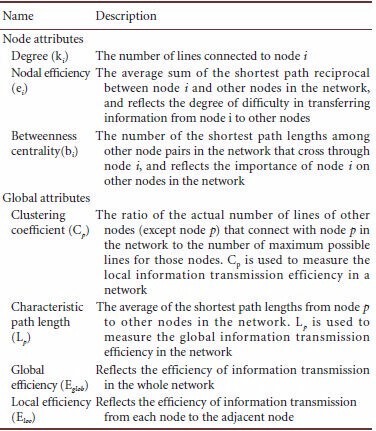
The observed significantly different index was further analyzed with the HAMD scale for correlation analysis.
Classification model
To construct the disease data model and achieve automatic identification, we constructed a classification model with a neural network algorithm using machine learning methods, taking the statistical significance of 270 local node attributes (90 nodes and three attributes of each node) as the features. The neural network algorithm and parameter settings are shown in supplementary Text 4 online. To compare the effects of different features on the classification model, all indices were ranked based on the P value, at an interval of 10 step lengths. The model was generated and verified using a cross-validation method[67]. 70% of the samples were randomly selected as the training set while the remaining 30% were the testing set. Each threshold value was tested 100 times, and the average accuracy rate was calculated.
Feature importance
The quantitative index measurement of the selected features allows us to determine its contribution in the classification, which plays an important role in the feature optimization and self-learning of the classification model. The obtained 270 local node features were analyzed using sensitivity analysis to calculate the variance of each feature in the target category and accordingly determine the importance of this feature in the classification. Features are then ranked according to the sensitivity measure. This method is applied in a variety of models of neural networks, decision trees, SVM, and Bayesian networks, and also compares the quantization of each feature in different models[68] (supplementary Text 1 online). In this study, we analyzed the correlation between the statistical significance of 270 node features and the importance of the calculated features in the neural network model, in an effort to determine the feasibility of applying statistical significance as an indicator of feature selection.
Footnotes
Funding: This study was supported by the National Natural Science Foundation of China, No. 61070077, 61170136, 61373101, 81171290; the Natural Science Foundation of Shanxi Province in China, No. 2010011020-2, 2011011015-4; Programs for Science and Technology Social Development of Shanxi Province, No. 20130313012-2; Science and Technology Projects by Shanxi Provincial Education Ministry, No. 20121003; Youth Fund by Taiyuan University of Technology, No. 2012L014; Youth Team Fund by Taiyuan University of Technology, No. 2013T047.
Conflicts of interest: None declared.
Peer review: This study combined brain network with machine learning and compared the features of functional brain network between depressed patients and normal controls using resting-state functional MRI data and Automated Anatomical Labeling template. It is a novel method to perform the classification using artificial neural network algorithm, which deserves further exploration.
Supplementary information: Supplementary data associated with this article can be found, in the online version, by visiting www.nrronline.org.
Copyedited by Jackson C, Li HF, Liu ZF, Yu J, Yang Y, Li CH, Song LP, Liu WJ, Zhao M
References
- [1].Fox MD, Raichle ME. Spontaneous fluctuations in brain activity observed with functional magnetic resonance imaging. Nat Rev Neurosci. 2007;8(9):700–711. doi: 10.1038/nrn2201. [DOI] [PubMed] [Google Scholar]
- [2].Greicius MD, Flores BH, Menon V, et al. Resting-state functional connectivity in major depression: abnormally increased contributions from subgenual cingulate cortex and thalamus. Biol Psychiatry. 2007;62(5):429–437. doi: 10.1016/j.biopsych.2006.09.020. [DOI] [PMC free article] [PubMed] [Google Scholar]
- [3].Anand A, Li Y, Wang Y, et al. Resting state corticolimbic connectivity abnormalities in unmedicated bipolar disorder and unipolar depression. Psychiatry Res. 2009;171(3):189–198. doi: 10.1016/j.pscychresns.2008.03.012. [DOI] [PMC free article] [PubMed] [Google Scholar]
- [4].Cullen KR, Gee DG, Klimes-Dougan B, et al. A preliminary study of functional connectivity in comorbid adolescent depression. Neurosci Lett. 2009;460(3):227–231. doi: 10.1016/j.neulet.2009.05.022. [DOI] [PMC free article] [PubMed] [Google Scholar]
- [5].Bluhm R, Williamson P, Lanius R, et al. Resting state default-mode network connectivity in early depression using a seed region-of-interest analysis: decreased connectivity with caudate nucleus. Psychiatry Clin Neurosci. 2009;63(6):754–761. doi: 10.1111/j.1440-1819.2009.02030.x. [DOI] [PubMed] [Google Scholar]
- [6].Sheline YI, Price JL, Yan Z, et al. Resting-state functional MRI in depression unmasks increased connectivity between networks via the dorsal nexus. Proc Natl Acad Sci U S A. 2010;107(24):11020–11025. doi: 10.1073/pnas.1000446107. [DOI] [PMC free article] [PubMed] [Google Scholar]
- [7].Guo WB, Sun XL, Liu L, et al. Disrupted regional homogeneity in treatment-resistant depression: a resting-state fMRI study. Prog Neuropsychopharmacol Biol Psychiatry. 2011;35(5):1297–1302. doi: 10.1016/j.pnpbp.2011.02.006. [DOI] [PubMed] [Google Scholar]
- [8].Liu Z, Xu C, Xu Y, et al. Decreased regional homogeneity in insula and cerebellum: a resting-state fMRI study in patients with major depression and subjects at high risk for major depression. Psychiatry Res. 2010;182(3):211–215. doi: 10.1016/j.pscychresns.2010.03.004. [DOI] [PubMed] [Google Scholar]
- [9].Wu QZ, Li DM, Kuang WH, et al. Abnormal regional spontaneous neural activity in treatment-refractory depression revealed by resting-state fMRI. Hum Brain Mapp. 2011;32(8):1290–1299. doi: 10.1002/hbm.21108. [DOI] [PMC free article] [PubMed] [Google Scholar]
- [10].Yao Z, Wang L, Lu Q, et al. Regional homogeneity in depression and its relationship with separate depressive symptom clusters: a resting-state fMRI study. J Affect Disord. 2009;115(3):430–438. doi: 10.1016/j.jad.2008.10.013. [DOI] [PubMed] [Google Scholar]
- [11].Bassett DS, Bullmore E, Verchinski BA, et al. Hierarchical organization of human cortical networks in health and schizophrenia. J Neurosci. 2008;28(37):9239–9248. doi: 10.1523/JNEUROSCI.1929-08.2008. [DOI] [PMC free article] [PubMed] [Google Scholar]
- [12].Liu Y, Liang M, Zhou Y, et al. Disrupted small-world networks in schizophrenia. Brain. 2008;131(Pt 4):945–961. doi: 10.1093/brain/awn018. [DOI] [PubMed] [Google Scholar]
- [13].Lynall ME, Bassett DS, Kerwin R, et al. Functional connectivity and brain networks in schizophrenia. J Neurosci. 2010;30(28):9477–9487. doi: 10.1523/JNEUROSCI.0333-10.2010. [DOI] [PMC free article] [PubMed] [Google Scholar]
- [14].Micheloyannis S, Pachou E, Stam CJ, et al. Small-world networks and disturbed functional connectivity in schizophrenia. Schizophr Res. 2006;87(1-3):60–66. doi: 10.1016/j.schres.2006.06.028. [DOI] [PubMed] [Google Scholar]
- [15].Rubinov M, Knock SA, Stam CJ, et al. Small-world properties of nonlinear brain activity in schizophrenia. Hum Brain Mapp. 2009;30(2):403–416. doi: 10.1002/hbm.20517. [DOI] [PMC free article] [PubMed] [Google Scholar]
- [16].He Y, Chen Z, Evans A. Structural insights into aberrant topological patterns of large-scale cortical networks in Alzheimer's disease. J Neurosci. 2008;28(18):4756–4766. doi: 10.1523/JNEUROSCI.0141-08.2008. [DOI] [PMC free article] [PubMed] [Google Scholar]
- [17].Stam CJ. Use of magnetoencephalography (MEG) to study functional brain networks in neurodegenerative disorders. J Neurol Sci. 2010;289(1-2):128–134. doi: 10.1016/j.jns.2009.08.028. [DOI] [PubMed] [Google Scholar]
- [18].Supekar K, Menon V, Rubin D, et al. Network analysis of intrinsic functional brain connectivity in Alzheimer's disease. PLoS Comput Biol. 2008;4(6):e1000100. doi: 10.1371/journal.pcbi.1000100. [DOI] [PMC free article] [PubMed] [Google Scholar]
- [19].Horstmann MT, Bialonski S, Noennig N, et al. State dependent properties of epileptic brain networks: comparative graph-theoretical analyses of simultaneously recorded EEG and MEG. Clin Neurophysiol. 2010;121(2):172–185. doi: 10.1016/j.clinph.2009.10.013. [DOI] [PubMed] [Google Scholar]
- [20].Raj A, Mueller SG, Young K, et al. Network-level analysis of cortical thickness of the epileptic brain. Neuroimage. 2010;52(4):1302–1313. doi: 10.1016/j.neuroimage.2010.05.045. [DOI] [PMC free article] [PubMed] [Google Scholar]
- [21].van Dellen E, Douw L, Baayen JC, et al. Long-term effects of temporal lobe epilepsy on local neural networks: a graph theoretical analysis of corticography recordings. PLoS One. 2009;4(11):e8081. doi: 10.1371/journal.pone.0008081. [DOI] [PMC free article] [PubMed] [Google Scholar]
- [22].Wang L, Zhu C, He Y, et al. Altered small-world brain functional networks in children with attention-deficit/hyperactivity disorder. Hum Brain Mapp. 2009;30(2):638–649. doi: 10.1002/hbm.20530. [DOI] [PMC free article] [PubMed] [Google Scholar]
- [23].de Vico Fallani F, Astolfi L, Cincotti F, et al. Evaluation of the brain network organization from EEG signals: a preliminary evidence in stroke patient. Anat Rec (Hoboken) 2009;292(12):2023–2031. doi: 10.1002/ar.20965. [DOI] [PubMed] [Google Scholar]
- [24].Wang J, Wang L, Zang Y, et al. Parcellation-dependent small-world brain functional networks: a resting-state fMRI study. Hum Brain Mapp. 2009;30(5):1511–1523. doi: 10.1002/hbm.20623. [DOI] [PMC free article] [PubMed] [Google Scholar]
- [25].Jin C, Gao C, Chen C, et al. A preliminary study of the dysregulation of the resting networks in first-episode medication-naive adolescent depression. Neurosci Lett. 2011;503(2):105–109. doi: 10.1016/j.neulet.2011.08.017. [DOI] [PubMed] [Google Scholar]
- [26].Tao H, Guo S, Ge T, et al. Depression uncouples brain hate circuit. Mol Psychiatry. 2013;18(1):101–111. doi: 10.1038/mp.2011.127. [DOI] [PMC free article] [PubMed] [Google Scholar]
- [27].O’Toole AJ, Jiang F, Abdi H, et al. Theoretical, statistical, and practical perspectives on pattern-based classification approaches to the analysis of functional neuroimaging data. J Cogn Neurosci. 2007;19(11):1735–1752. doi: 10.1162/jocn.2007.19.11.1735. [DOI] [PubMed] [Google Scholar]
- [28].Costafreda SG, Chu C, Ashburner J, et al. Prognostic and diagnostic potential of the structural neuroanatomy of depression. PLoS One. 2009;4(7):e6353. doi: 10.1371/journal.pone.0006353. [DOI] [PMC free article] [PubMed] [Google Scholar]
- [29].Fu CH, Mourao-Miranda J, Costafreda SG, et al. Pattern classification of sad facial processing: toward the development of neurobiological markers in depression. Biol Psychiatry. 2008;63(7):656–662. doi: 10.1016/j.biopsych.2007.08.020. [DOI] [PubMed] [Google Scholar]
- [30].Gong Q, Wu Q, Scarpazza C, et al. Prognostic prediction of therapeutic response in depression using high-field MR imaging. Neuroimage. 2011;55(4):1497–1503. doi: 10.1016/j.neuroimage.2010.11.079. [DOI] [PubMed] [Google Scholar]
- [31].Bullmore E, Sporns O. Complex brain networks: graph theoretical analysis of structural and functional systems. Nat Rev Neurosci. 2009;10(3):186–198. doi: 10.1038/nrn2575. [DOI] [PubMed] [Google Scholar]
- [32].He Y, Evans A. Graph theoretical modeling of brain connectivity. Curr Opin Neurol. 2010;23(4):341–350. doi: 10.1097/WCO.0b013e32833aa567. [DOI] [PubMed] [Google Scholar]
- [33].Bullmore ET, Bassett DS. Brain graphs: graphical models of the human brain connectome. Annu Rev Clin Psychol. 2011;7:113–140. doi: 10.1146/annurev-clinpsy-040510-143934. [DOI] [PubMed] [Google Scholar]
- [34].Fornito A, Zalesky A, Bullmore ET. Network scaling effects in graph analytic studies of human resting-state FMRI data. Front Syst Neurosci. 2010;4:22. doi: 10.3389/fnsys.2010.00022. [DOI] [PMC free article] [PubMed] [Google Scholar]
- [35].Stam CJ, de Haan W, Daffertshofer A, et al. Graph theoretical analysis of magnetoencephalographic functional connectivity in Alzheimer's disease. Brain. 2009;132(Pt 1):213–224. doi: 10.1093/brain/awn262. [DOI] [PubMed] [Google Scholar]
- [36].Sheline YI. Neuroimaging studies of mood disorder effects on the brain. Biol Psychiatry. 2003;54(3):338–352. doi: 10.1016/s0006-3223(03)00347-0. [DOI] [PubMed] [Google Scholar]
- [37].Kronmüller KT, Schröder J, Köhler S, et al. Hippocampal volume in first episode and recurrent depression. Psychiatry Res. 2009;174(1):62–66. doi: 10.1016/j.pscychresns.2008.08.001. [DOI] [PubMed] [Google Scholar]
- [38].Alexopoulos GS, Kelly RE., Jr Research advances in geriatric depression. World Psychiatry. 2009;8(3):140–149. doi: 10.1002/j.2051-5545.2009.tb00234.x. [DOI] [PMC free article] [PubMed] [Google Scholar]
- [39].Abe O, Yamasue H, Kasai K, et al. Voxel-based analyses of gray/white matter volume and diffusion tensor data in major depression. Psychiatry Res. 2010;181(1):64–70. doi: 10.1016/j.pscychresns.2009.07.007. [DOI] [PubMed] [Google Scholar]
- [40].Davidson RJ, Irwin W, Anderle MJ, et al. The neural substrates of affective processing in depressed patients treated with venlafaxine. Am J Psychiatry. 2003;160(1):64–75. doi: 10.1176/appi.ajp.160.1.64. [DOI] [PubMed] [Google Scholar]
- [41].Lui S, Wu Q, Qiu L, et al. Resting-state functional connectivity in treatment-resistant depression. Am J Psychiatry. 2011;168(6):642–648. doi: 10.1176/appi.ajp.2010.10101419. [DOI] [PubMed] [Google Scholar]
- [42].Cheng YQ, Xu J, Chai P, et al. Brain volume alteration and the correlations with the clinical characteristics in drug-naïve first-episode MDD patients: a voxel-based morphometry study. Neurosci Lett. 2010;480(1):30–34. doi: 10.1016/j.neulet.2010.05.075. [DOI] [PubMed] [Google Scholar]
- [43].Maller JJ, Daskalakis ZJ, Fitzgerald PB. Hippocampal volumetrics in depression: the importance of the posterior tail. Hippocampus. 2007;17(11):1023–1027. doi: 10.1002/hipo.20339. [DOI] [PubMed] [Google Scholar]
- [44].Young KA, Holcomb LA, Yazdani U, et al. Elevated neuron number in the limbic thalamus in major depression. Am J Psychiatry. 2004;161(7):1270–1277. doi: 10.1176/appi.ajp.161.7.1270. [DOI] [PubMed] [Google Scholar]
- [45].Steele JD, Currie J, Lawrie SM, et al. Prefrontal cortical functional abnormality in major depressive disorder: a stereotactic meta-analysis. J Affect Disord. 2007;101(1-3):1–11. doi: 10.1016/j.jad.2006.11.009. [DOI] [PubMed] [Google Scholar]
- [46].Coryell W, Nopoulos P, Drevets W, et al. Subgenual prefrontal cortex volumes in major depressive disorder and schizophrenia: diagnostic specificity and prognostic implications. Am J Psychiatry. 2005;162(9):170–1712. doi: 10.1176/appi.ajp.162.9.1706. [DOI] [PubMed] [Google Scholar]
- [47].Li L, Ma N, Li Z, et al. Prefrontal white matter abnormalities in young adult with major depressive disorder: a diffusion tensor imaging study. Brain Res. 2007;1168:124–128. doi: 10.1016/j.brainres.2007.06.094. [DOI] [PubMed] [Google Scholar]
- [48].Matsuo K, Glahn DC, Peluso MA, et al. Prefrontal hyperactivation during working memory task in untreated individuals with major depressive disorder. Mol Psychiatry. 2007;12(2):158–166. doi: 10.1038/sj.mp.4001894. [DOI] [PubMed] [Google Scholar]
- [49].Lai T, Payne ME, Byrum CE, et al. Reduction of orbital frontal cortex volume in geriatric depression. Biol Psychiatry. 2000;48(10):971–975. doi: 10.1016/s0006-3223(00)01042-8. [DOI] [PubMed] [Google Scholar]
- [50].Lacerda AL, Keshavan MS, Hardan AY, et al. Anatomic evaluation of the orbitofrontal cortex in major depressive disorder. Biol Psychiatry. 2004;55(4):353–358. doi: 10.1016/j.biopsych.2003.08.021. [DOI] [PubMed] [Google Scholar]
- [51].Haldane M, Cunningham G, Androutsos C, et al. Structural brain correlates of response inhibition in Bipolar Disorder I. J Psychopharmacol. 2008;22(2):138–143. doi: 10.1177/0269881107082955. [DOI] [PubMed] [Google Scholar]
- [52].Ma N, Li L, Shu N, et al. White matter abnormalities in first-episode, treatment-naive young adults with major depressive disorder. Am J Psychiatry. 2007;164(5):823–826. doi: 10.1176/ajp.2007.164.5.823. [DOI] [PubMed] [Google Scholar]
- [53].Lui S, Parkes LM, Huang X, et al. Depressive disorders: focally altered cerebral perfusion measured with arterial spin-labeling MR imaging. Radiology. 2009;251(2):476–484. doi: 10.1148/radiol.2512081548. [DOI] [PubMed] [Google Scholar]
- [54].Scheuerecker J, Meisenzahl EM, Koutsouleris N, et al. Orbitofrontal volume reductions during emotion recognition in patients with major depression. J Psychiatry Neurosci. 2010;35(5):311–320. doi: 10.1503/jpn.090076. [DOI] [PMC free article] [PubMed] [Google Scholar]
- [55].Dichter GS, Felder JN, Petty C, et al. The effects of psychotherapy on neural responses to rewards in major depression. Biol Psychiatry. 2009;66(9):886–897. doi: 10.1016/j.biopsych.2009.06.021. [DOI] [PMC free article] [PubMed] [Google Scholar]
- [56].Surguladze SA, El-Hage W, Dalgleish T, et al. Depression is associated with increased sensitivity to signals of disgust: a functional magnetic resonance imaging study. J Psychiatr Res. 2010;44(14):894–902. doi: 10.1016/j.jpsychires.2010.02.010. [DOI] [PMC free article] [PubMed] [Google Scholar]
- [57].Murphy ML, Frodl T. Meta-analysis of diffusion tensor imaging studies shows altered fractional anisotropy occurring in distinct brain areas in association with depression. Biol Mood Anxiety Disord. 2011;1(1):3. doi: 10.1186/2045-5380-1-3. [DOI] [PMC free article] [PubMed] [Google Scholar]
- [58].Zhang J, Wang J, Wu Q, et al. Disrupted brain connectivity networks in drug-naive, first-episode major depressive disorder. Biol Psychiatry. 2011;70(4):334–342. doi: 10.1016/j.biopsych.2011.05.018. [DOI] [PubMed] [Google Scholar]
- [59].Hayasaka S, Laurienti PJ. Comparison of characteristics between region-and voxel-based network analyses in resting-state fMRI data. Neuroimage. 2010;50(2):499–508. doi: 10.1016/j.neuroimage.2009.12.051. [DOI] [PMC free article] [PubMed] [Google Scholar]
- [60].Zalesky A, Fornito A, Harding IH, et al. Whole-brain anatomical networks: does the choice of nodes matter? Neuroimage. 2010;50(3):970–983. doi: 10.1016/j.neuroimage.2009.12.027. [DOI] [PubMed] [Google Scholar]
- [61].First MB, Spitzer RL, Gibbon M, et al. Arlington: American Psychiatric Publishing; 1997. User's guide for the structured clinical interview for DSM-IV axis I disorders: SCID-1 clinician version. [Google Scholar]
- [62].Williams JB. A structured interview guide for the Hamilton Depression Rating Scale. Arch Gen Psychiatry. 1988;45(8):742–747. doi: 10.1001/archpsyc.1988.01800320058007. [DOI] [PubMed] [Google Scholar]
- [63].Guy W. U.S Dept of Health, Education, and Welfare, Public Health Service, Alcohol, Drug Abuse, and Mental Health Administration, National Institute of Mental Health, Psychopharmacology Research Branch, Division of Extramural Research Programs; 1991. ECDEU Assessment Manual for Psychopharmacology. [Google Scholar]
- [64].Bouvard M, Fontaine-Buffe M, Cungi C, et al. Preliminary studies of the structured diagnostic interview for personality disorders: SCID II. Encephale. 1999;25(5):416–421. [PubMed] [Google Scholar]
- [65].Tzourio-Mazoyer N, Landeau B, Papathanassiou D, et al. Automated anatomical labeling of activations in SPM using a macroscopic anatomical parcellation of the MNI MRI single-subject brain. Neuroimage. 2002;15(1):273–289. doi: 10.1006/nimg.2001.0978. [DOI] [PubMed] [Google Scholar]
- [66].Bollobás B. Cambridge: Cambridge University Press; 2001. Random Graphs. [Google Scholar]
- [67].Pereira F, Mitchell T, Botvinick M. Machine learning classifiers and fMRI: a tutorial overview. Neuroimage. 2009;45(1 Suppl):S199–209. doi: 10.1016/j.neuroimage.2008.11.007. [DOI] [PMC free article] [PubMed] [Google Scholar]
- [68].Saltelli A. Making best use of model evaluations to compute sensitivity indices. Comput Phys Commun. 2002;145(2):280–297. [Google Scholar]


