

Abstract
The first mutation associated with hypertrophic cardiomyopathy (HCM) is the R403Q mutation in the gene encoding β-myosin heavy chain (β-MyHC). R403Q locates in the globular head of myosin (S1), responsible for interaction with actin, and thus motor function of myosin. Increased cross-bridge relaxation kinetics caused by the R403Q mutation might underlie increased energetic cost of tension generation; however, direct evidence is absent. Here we studied to what extent cross-bridge kinetics and energetics are related in single cardiac myofibrils and multicellular cardiac muscle strips of three HCM patients with the R403Q mutation and nine sarcomere mutation-negative HCM patients (HCMsmn). Expression of R403Q was on average 41 ± 4% of total MYH7 mRNA. Cross-bridge slow relaxation kinetics in single R403Q myofibrils was significantly higher (P < 0.0001) than in HCMsmn myofibrils (0.47 ± 0.02 and 0.30 ± 0.02 s−1, respectively). Moreover, compared to HCMsmn, tension cost was significantly higher in the muscle strips of the three R403Q patients (2.93 ± 0.25 and 1.78 ± 0.10 μmol l–1 s−1 kN−1 m−2, respectively) which showed a positive linear correlation with relaxation kinetics in the corresponding myofibril preparations. This correlation suggests that faster cross-bridge relaxation kinetics results in an increase in energetic cost of tension generation in human HCM with the R403Q mutation compared to HCMsmn. Therefore, increased tension cost might contribute to HCM disease in patients carrying the R403Q mutation.
Key points
The R403Q mutation, located in the S1 domain of the β-myosin heavy chain, is associated with a severe phenotype of hypertrophic cardiomyopathy (HCM).
Increased cross-bridge relaxation kinetics caused by the R403Q mutation might underlie increased energetic cost of sarcomeric tension generation; however, direct evidence is absent.
We studied the relationship between cross-bridge kinetics and energetics in single cardiac myofibrils and multicellular cardiac muscle strips in human HCM tissue with and without the R403Q mutation.
In human HCM with the R403Q mutation, cross-bridge relaxation was faster and correlated well with a rise in energetic cost of tension generation.
Our data suggest that an increase in tension cost is one of the causes underlying cardiomyopathy development in patients with the R403Q mutation.
Introduction
Familial hypertrophic cardiomyopathy (HCM) is an inherited cardiac disease with an incidence of 1:500. It is most frequently caused by mutations in genes encoding sarcomeric proteins (Maron et al. 2006a). The first identified mutation (R403Q) is located in the gene (MYH7) encoding cardiac β-myosin heavy chain and has been associated with high penetrance and a severe clinical phenotype. This malignant MYH7 mutation results in conversion of a highly conserved arginine residue to a glutamine (Geisterfer-Lowrance et al. 1990) at position 403 in the globular head of myosin (subfragment 1, S1). Based on the location of residue 403 at the base of a surface loop known to interact with actin it is most likely that the R403Q mutation directly interferes with motor and sarcomere function (Rayment et al. 1995; Volkmann et al. 2007).
A previous study in myofibrils from an HCM patient harbouring the R403Q mutation revealed faster generation and relaxation rates of tension development compared to healthy controls (Belus et al. 2008). In the two-state model of acto-myosin interactions (Brenner, 1988) the rate of force redevelopment (ktr) in myofibrils is equal to fapp + gapp in which fapp and gapp represent the apparent rate constants of the transition of the cross-bridges into the force-generating states and back into the non-force generating states, respectively. ktr can be derived from quick tension recovery after a short period of unloaded shortening or from the time course of force development (kact), as can be measured in myofibrils (Poggesi et al. 2005; Belus et al. 2008). The relaxation of myofibrils is characterized by a slow, linear relaxation phase (slow krel) and a fast exponential relaxation component (fast krel). It has been shown that the isometric slow krel is equal to gapp because at low [Ca2+], strongly bound cross-bridges leave the force-generating states upon ADP-release and ATP-rebinding whereas weakly-bound cross-bridges are unable to go into the force-generating states (Brenner, 1988; Stehle et al. 2002; Tesi et al. 2002; Poggesi et al. 2005).
Moreover, gapp is equivalent to the energetic cost of tension generation or the ratio of ATPase activity over force, tension cost = ATPase activity/force (Brenner, 1988; Piroddi et al. 2007; de Tombe & Stienen, 2007). The human myofibrils with the R403Q mutation showed a lower maximal tension, a 2-fold increase in kact and a 3-fold increase in slow krel compared to non-failing donor myofibrils (Belus et al. 2008). The prominent enhancement of relaxation kinetics indicates increased energetic cost of tension generation, and may be central in the pathogenesis of HCM caused by the R403Q mutation. However, direct demonstration that high cross-bridge detachment kinetics under isometric conditions of contraction caused by the R403Q mutation underlies increased energetic cost of tension generation (i.e. tension cost) is absent.
Therefore, we extended the previous observations by investigating if tension cost is increased in cardiac samples from three different HCM patients harbouring the R403Q mutation and how this correlates with slow relaxation kinetics. We simultaneously measured isometric force development and ATPase activity in cardiac muscle strips, providing a direct measure of tension cost at the level of the sarcomere. Cross-bridge kinetics was assessed during force measurements in myofibrils isolated from the same samples. R403Q samples were compared to cardiac tissue of eight sarcomere mutation-negative HCM patients (HCMsmn). The HCMsmn patients present with the same clinical phenotype as the R403Q patients and underwent cardiac surgery under similar conditions, which makes them a representative reference group.
Methods
Ethical approval
The study protocol is in line with the principles outlined in the Declaration of Helsinki and was approved by the local Ethics Committees. Written informed consent was obtained at the involved medical centres (Erasmus Medical Centre, Rotterdam, The Netherlands; Brigham and Women's Hospital, Cardiology, Boston, USA; and the Careggi University Hospital, Florence, Italy).
Cardiac tissue
Interventricular tissue was obtained from ten HCM patients during myectomy surgery to relieve left ventricular (LV) outflow tract obstruction, and LV tissue from two HCM patients was obtained during heart transplantation (HT) surgery. The tissue was snap frozen in liquid nitrogen. Three patients harboured the MYH7 R403Q mutation [one myectomy, R403Q(1), and two HT, R403Q(2) and R403Q(3)], while nine HCMsmn patients (myectomies) served as control [HCMsmn; no identified sarcomeric gene mutation after screening of nine HCM-associated genes, MYBPC3, MYH7, TNNT2, TNNI3, MYL2, MYL3, ACTC, TPM1, CSRP2 (Hershberger et al. 2009)]. Patient characteristics are shown in Table 1. Manifest HCM was evident from the high septal thickness (normal value <13 mm) (Shub et al. 1994) and high LV outflow tract pressure gradient (normal value <30 mmHg) (Maron et al. 2006b).
Table 1.
Patient characteristics
| Patient | Age (years) | Sex | LVOT | ST |
|---|---|---|---|---|
| HCMR403Q | ||||
| R403Q(1) | 24 | M | 85 | 34 |
| R403Q(2) | 35 | M | HT | HT |
| R403Q(3) | 59 | F | HT | HT |
| HCMsmn | ||||
| 1 | 35 | M | 76 | 30 |
| 2 | 54 | M | 100 | 33 |
| 3 | 42 | M | 75 | 26 |
| 4 | 52 | M | 169 | 22 |
| 5 | 65 | F | 85 | 19 |
| 6 | 72 | F | 88 | 24 |
| 7 | 49 | M | 61 | 20 |
| 8 | 46 | M | 81 | 19 |
| 9 | 59 | M | 85 | 18 |
Abbreviations: M, male; F, female; LVOT, left ventricular outflow tract pressure gradient (mmHg); ST, septal thickness (mm); HT, heart transplantation.
Multicellular cardiac muscle strips were isolated from three R403Q and six HCMsmn patients. In addition, cardiac myofibril preparations were isolated from the same three R403Q patients and three HCMsmn patients. Data of HCMsmn muscle strips (Witjas-Paalberends et al. 2014a) and myofibril data from patient R403Q(1) (Belus et al. 2008) have been published previously.
Sarcomere energetics in multicellular muscle strips
All muscle strips were immersed in cold relaxing solution (pH 7.0; in mmol l–1: free Mg2+ 1, KCl 145, EGTA 2, ATP 4, Imidazole 10) and cut parallel to the long axis of the fibres in cold relaxing solution to minimize damage. Subsequently, muscle strips were permeabilized overnight in relaxing solution with 1% Triton X-100 at 4°C, which allowed us to control the intracellular Ca2 concentration during measurements without interference of Ca2+ handling proteins.
The experimental procedures, solutions and equipment used for functional measurements were as described previously (Potma et al. 1994; Witjas-Paalberends et al. 2014a). The length of the preparations was adjusted on the basis of passive tension by stretching them until a level of 1–2 kN m–2 was reached, which corresponds to a sarcomere length of about 2.2 μm (Narolska et al. 2005). The ventricular muscle strips were 1.52 ± 0.09 mm (mean ± SEM) in length, 368 ± 12 μm in width and 330 ± 9 μm in depth (no significant differences between groups). Isometric force and ATPase activity were measured at maximal and submaximal [Ca2+] at 20°C. During the measurement the muscle strips were kept inside a small chamber with a volume of 30 μl with thin quartz windows. Original registrations of force development and ATPase activity are shown in Fig. 1A–D. Maximal force was determined after the force signal reached a plateau and normalized to the cross-sectional area (CSA) of the muscle strip to calculate tension (force/CSA) (Fig. 1A, B). The CSA of the preparation was estimated in the set-up assuming an elliptical shape, i.e. CSA = (width × depth × π)/4. ATPase activity was measured using an enzyme coupled assay. In this assay the ATP regeneration from ADP and phosphoenol-pyruvate, catalysed by the enzyme pyruvate kinase, is coupled to the oxidation of NADH to NAD+ and the reduction of pyruvate to lactate, catalysed by l-lactic dehydrogenase. NADH oxidation was measured photometrically from the absorbance at 340 nm of near-UV light. The absorbance signal was calibrated by adding 0.5 nmol of ADP (arrow) to the solution in the measuring chamber. Using this calibration, ATPase activity in the muscle strip could be derived from the slope of the absorbance signal (Fig. 1C, D). The maximal Ca2+-activated ATPase activity was calculated by subtracting basal ATPase activity (measured in relaxing solution) from the maximal NADH oxidation and normalization to the volume of the muscle strip. The economy of muscle contraction is expressed as tension cost, i.e. ATPase activity during force development (ATPase activity/tension).
Figure 1.
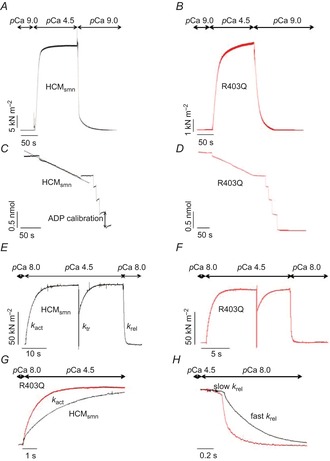
Original registrations of a multicellular muscle strip and myofibril preparation
A and B, the generation of force normalized to cross-sectional area (CSA) (tension) in an HCMsmn and R403Q muscle strip. The muscle strip was activated in a saturating [Ca2+] solution (pCa 4.5) until force reached a steady state and subsequently relaxed in a low [Ca2+] solution (pCa 9). C and D, corresponding NADH absorbance recorded during the activations shown in A and B. E and F, contraction–relaxation cycles of myofibril preparations from an HCMsmn (black curve) and R403Q (red curve) patient. G, the time course of tension activation following sudden [Ca2+] increase of the HCMsmn and R403Q(1) myofibril preparations shown in E and F superimposed on a faster time base after normalization for maximal tension. H, tension relaxation kinetics following sudden Ca2+ removal of the HCMsmn and R403Q(1) myofibril preparations superimposed on a faster time base after normalization for maximal tension. kact is the rate constant of tension generation and krel represents the rate constant of relaxation.
Cross-bridge kinetics in myofibril preparations
Thin strips of the patient cardiac samples were incubated overnight in ice-cold relaxing solution (pCa 8.0, pH 7.0, in mmol l–1: ionic strength 200, EGTA 10, Tris 10, MgATP 5, free Mg2+ 1) with 1% Triton X-100 added. Triton was then removed and the strips were homogenized in the same relaxing solution to produce myofibril suspensions that were stored at 0–4°C and used for experiments for up to 4 days. Techniques for mechanical measurements in human cardiac myofibrils were as previously described (Piroddi et al. 2007; Belus et al. 2008, 2010). Briefly, myofibrils were transferred to a temperature controlled chamber filled with relaxing solution (pCa 8.0, 15°C). The selected myofibril was mounted (initial sarcomere length around 2.2 μm) between a cantilever force probe and a glass needle mounted on the shaft of a length control motor. Myofibrils were maximally activated and fully relaxed by rapid solution switching between two continuous streams of solutions (pCa 8.0 and 4.5) (Fig. 1E–H). All solutions contained an MgATP-regenerating system and a cocktail of protease inhibitors. Slow krel is estimated from the slope of the regression line fitted to the tension trace normalized to the entire amplitude of the tension relaxation transient. The rate constant for fast krel is estimated from a mono-exponential fit.
Histology
From each R403Q patient and three HCMsmn patients, 10 myocardial cryosections of 5 μm were formalin fixed. The CSA of cardiomyocytes and the amount of fibrosis per cryosection were analysed using Wheat Germ Agglutinin (WGA) staining and Picrosirius Red staining, respectively. Photomicrographs of the cryosections stained with WGA were obtained (Leitz DMRXE; Leica, Wetzlar, Germany) and the CSA of at least 100 representative delineated cardiomyocytes per patient was quantified as width × depth × π/4 using ImageJ 1.45s software (National Institutes of Health, Bethesda, MD, USA). Photomicrographs of the cryosections stained with Picrosirius Red were obtained (Leica DM 2000) and fibrosis of each cryosection was quantified as a percentage of the total slide area using ImageJ 1.45s software.
Allelic mRNA expression analysis
RNA was extracted from 40 mg frozen cardiac tissue using the PeqGold Total RNA Kit (PeqLab, Fareham, UK) according to the supplier's protocol. RNA integrity was analysed using a PicoKit bioanalyser (Agilent, Santa Clara, CA, USA) and revealed a RNA integrity number above 6 for all patient samples. For the reverse transcription 2 μl RNA was incubated with 1× reaction buffer, 2.5 mmol dNTPs each, 8 pmol MYH7-specific primer (5′-GCCTTGCCTTTGCCCTTCTCA-3′), 20 U RiboSafe (Bioline, London, UK), and 100 U Tetro RT (Bioline) in 20 μl for 1 h at 42°C. For quantitative PCR, 1× reaction buffer S (Hot Taq DNA Polymerase, PeqLab), 25 mmol dNTPs each, 10 pmol forward primer (5′-TGACAGGCGCCATCATGCACTTTGGA-3′), 10 pmol reverse primer (5′-CTGCTTGGTCTCCAGGGTGGCA-3′), 1.25 mmol MgCl2, 1 U Hot Taq DNA Polymerase (PeqLab) in a final volume of 25 μl were applied to an initial denaturation at 95°C for 5 min, 25 cycles of denaturation at 95°C for 30 s, annealing at 70°C for 30 s, elongation at 72°C for 30 s and a final elongation step at 72°C for 2 min.
To eliminate heteroduplexes we performed a reconditioning PCR as described previously (Tripathi et al. 2011). In brief, the PCR products were diluted 1:100 and applied to eight parallel PCR reactions that were terminated in the linear phase of the PCR. The reactions were pooled, precipitated and subjected to a mutation-specific DdeI treatment by adding 1× buffer 4 and 10 U DdeI (New England Biolabs, Inc., Ipswich, MA, USA) to a final volume of 10 μl and incubated at 37°C for at least 3 h or overnight. The treatment yielded a fragment of 119 bp for both alleles, a wildtype-specific fragment of 180 bp and a mutation-specific fragment of 148 bp. The fragments were separated in 2.5% sieving agarose gels (Biozym, Hessisch Oldendorf, Germany) stained with ethidium bromide and quantified as described for other MYH7 mutations (Tripathi et al. 2011). In brief, the integrated optical density was determined for each band and normalized for the respective size. The fraction of each allele was calculated as the percentage from the common 119 bp band.
Statistical analysis
Statistical analysis of the data was performed using Prism version 5.0 (Graphpad Software, Inc., La Jolla, CA, USA) and SPSS version 20.0 (IMB, Armonk, NY, USA). The data are presented as mean ± SEM. The statistics regarding functional measurements are based on the individual myofibril preparations and multicellular muscle strips. Using the Shapiro–Wilk test the data sets were analysed regardless of whether the assumption of normality was violated. Normality was assumed when P > 0.05 and the variances were equal. As the repeated samples assessments had to be taken into account (multiple myofibril preparations and muscle strips were measured from one patient), multilevel analysis was performed using a linear mixed model procedure to investigate differences between the groups as published previously (Coppini et al. 2013; Sequeira et al. 2013; Witjas-Paalberends et al. 2013). For this, the data sets violating the normality assumption (P < 0.05) were logarithmically transformed. The histological data were analysed with the non-parametric Mann–Whitney–Wilcoxon test or Kruskal–Wallis test followed by a post hoc Dunn's test due for violation of the normality assumption. Regarding the mRNA analyses, a one-way analysis of variance (ANOVA) was performed with Bonferroni's Multiple Comparison as a post hoc test. P < 0.05 was considered significant.
Results
Sarcomere energetics
Simultaneous measurements of force generation and ATPase activity were performed in membrane-permeabilized muscle strips from three R403Q patients and five HCMsmn patients. The normality assumption was not violated by any of the datasets (P > 0.05).
Maximal tension (force normalized by CSA) on average was significantly lower (11.4 ± 1.1 kN m−2) in the R403Q muscle strips compared to HCMsmn (24.4 ± 1.6 kN m−2, Fig. 2A). The muscle strips from each individual patient showed a significant decrease in maximal tension compared to HCMsmn as well (Fig. 2B). Maximal ATPase activity, corrected for basal ATPase activity (4.4 ± 0.5 and 6.6 ± 1.2 μmol l−1 s−1, respectively), was significantly lower (30.5 ± 2.7 μmol l−1 s−1) in R403Q muscle strips compared to HCMsmn (41.4 ± 2.4 μmol l−1 s−1, Fig. 2C). When the muscle strips were separated per patient, both R403Q(1) and R403Q(3) muscle strips showed a significantly lower maximal ATPase activity compared to HCMsmn. In addition, R403Q(1) had a significantly lower ATPase activity compared to R403Q(2) (Fig. 2D). Maximal tension cost was calculated by dividing maximal ATPase activity by maximal tension. Tension cost (Fig. 2E) was significantly higher in R403Q compared to HCMsmn (2.9 ± 0.2 and 1.8 ± 0.1 μmol l−1 s−1 kN−1 m−2, respectively). In addition, maximal tension cost of R403Q(1) was significantly higher than HCMsmn and higher compared to R403Q(2) and R403Q(3) (Fig. 2F).
Figure 2.
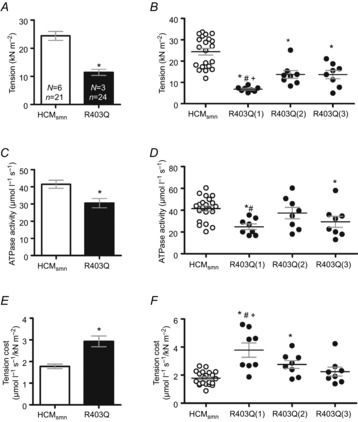
Maximal tension, ATPase activity and tension cost in multicellular muscle strips
A, maximal tension on average was significantly lower in R403Q muscle strips compared to HCMsmn (*P < 0.0001). B, the lower maximal tension was evident in each individual R403Q patient compared to HCMsmn (*P < 0.0001). In addition, muscle strips of R403Q(1) revealed a lower maximal tension compared to R403Q(2) (#P = 0.025) and R403Q(3)(+P = 0.026). C, maximal ATPase activity was significantly lower in R403Q muscle strips compared to HCMsmn (*P = 0.004). D, R403Q(1) and R403(3) muscle strips showed significantly lower ATPase activity compared to HCMsmn (*P = 0.002 and *P = 0.017, respectively). ATPase activity in R403Q(1) was significantly lower than R403Q(2) (#P = 0.04). E, tension cost was calculated by dividing maximal ATPase activity by tension. Maximal tension cost was significantly higher in R403Q compared to HCMsmn (*P < 0.0001). F, the increase in tension cost was significant in R403Q(1) and R403Q(2) compared to HCMsmn (*P < 0.0001 and *P = 0.008, respectively). In addition, tension cost in R403Q(1) muscle strips was higher compared to R403Q(2) (#P = 0.020) and R403Q(3)(+P = 0.001). Average data are shown ± SEM, N = number of patients, n = number of individual muscle strips; data points represent individual muscle strips ± SEM.
Additional measurements of force and ATPase activity were performed at submaximal [Ca2+] in a subset of muscle strips. Figure 3A shows tension development and corresponding ATPase activity of the R403Q and HCMsmn muscle strips (not corrected for basal ATPase activity) over a range of [Ca2+]. The relationship between tension and ATPase activity over the entire [Ca2+] range can be estimated by a linear equation, as shown previously (de Tombe & Stienen, 1995). The slopes of the tension–ATPase activity relationships represent tension cost over the entire range of [Ca2+]. The slopes of the R403Q muscle strips are significantly higher compared to HCMsmn (Fig. 3A). When plotting the average curves per R403Q patient, the R403Q(1) showed a significantly higher slope compared to HCMsmn and R403Q(3) (Fig. 3B).
Figure 3.
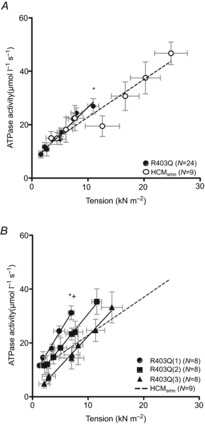
Tension cost at maximal and submaximal [Ca+]
A, tension and ATPase activity in muscle strips were measured at submaximal [Ca2+] yielding the following relations for the R403Q patients: y = 2.82x + 4.47 and HCMsmn patients: y = 1.65x + 4.47. The average slope (i.e. tension cost) of the R403Q muscle strips was significantly higher compared to HCMsmn (*P = 0.018). B, ATPase activity–tension relations of muscle strips of individual R403Q patients are as follows: R403Q(1): y = 3.66x + 7.26, R403Q(2): y = 2.59x + 5.40 and R403Q(3): y = 2.22x + 0.75. The R403Q(1) slope reached a significant difference compared to both HCMsmn (*P = 0.001) and R403Q(3) (+P = 0.026). Average data are shown ± SEM, N = number of individual muscle strips; data points represent individual muscle strips ± SEM.
Cross-bridge kinetics
The parameters of cross-bridge kinetics were measured in myofibril preparations of the three HCM patients with the R403Q mutation and of three HCMsmn patients. Data for R403Q(1) have been previously published (Belus et al. 2008), but measuring more myofibrils of this patient was not possible as the remaining preserved myectomy tissue has been used for tension cost measurements in multicellular muscle strips, histological analyses and mRNA analysis. Representative contraction–relaxation traces of myofibril preparations are shown in Fig. 1E–H. Both kact and fast krel data sets violated the normality assumption (P < 0.05) and were logarithmically transformed, resulting in data sets not violating the normality assumption.
Figure 4A shows the maximal tension (force normalized to CSA) of the entire R403Q group compared to HCMsmn, which did not differ between the two patient groups. However, when the three patients were analysed individually (Fig. 4B), myofibril preparations of the R403Q(1) patient did show a significantly lower tension compared to the myofibril preparations of HCMsmn and the other R403Q patients.
Figure 4.
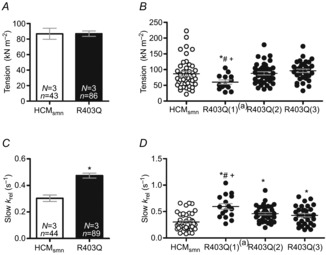
Cross-bridge kinetics in myofibril preparations
A, maximal tension on average did not differ between R403Q and HCMsmn myofibrils. B, myofibrils from R403Q(1) showed a significant decrease in maximal tension compared to the other R403Q patients and HCMsmn patients (*P = 0.02 vs. HCMsmn, #P = 0.019 vs. R403Q(2) and +P = 0.003 vs. R403Q(3)). C, slow krel (∼gapp∼tension cost) was significantly higher in R403Q myofibrils compared to HCMsmn (*P < 0.0001). D, this increase was visible in myofibrils of all R403Q patients compared to HCMsmn (R403Q(1)(2) *P < 0.0001 and R403Q(3) *P = 0.001). In addition, slow krel was significantly higher in myofibrils of R403Q(1) compared to R403Q(2)(#P = 0.006) and R403Q(3)(+P = 0.001). Data are represented as individual myofibril preparations ± SEM and N = number of patients, n = number of individual muscle strips. aData from Belus et al. (2008).
The rate constant of force development (kact) was significantly higher in R403Q myofibrils compared to HCMsmn (Table 2 and Fig. 1G). In addition, when the myofibril data were separated per patient (Table 2), each individual patient showed a significantly higher kact compared to HCMsmn. In addition, kact of R403Q(2) was significantly higher compared to the other R403Q samples (Table 2).
Table 2.
Kinetic data (mean±SD) for tension generation and fast relaxation
| HCMsmn | R403Q | R403(1)a | R403Q(2) | R403Q(3) | |
|---|---|---|---|---|---|
| kact (s−1) | 0.74 ± 0.03 (45) | 1.27 ± 0.04 (92)* | 1.4 ± 0.15 (18)* | 1.34 ± 0.06 (41)*# | 1.11 ± 0.05 (33)* |
| Fast krel (s−1) | 4.62 ± 0.20 (44) | 5.32 ± 0.18 (78)+ | 5.12 ± 0.34 (16) | 5.13 ± 0.27 (39) | 5.77 ± 0.35 (23)^ |
P < 0.0001 R403Q, R403Q(1), R403Q(2), R403Q(3) vs. HCMsmn
P = 0.01 R403Q(2) vs. R403Q(3)
P < 0.017 R403Q vs. HCMsmn
P < 0.005 R403Q(3) vs. HCMsmn; number of myofibril preparations in parentheses.
Data from Belus et al. (2008).
The fast component of relaxation (fast krel) on average was significantly increased in R403Q myofibrils compared to HCMsmn (Table 2). This difference was due to higher fast krel of myofibrils from patient R403Q(3) (Table 2). The slow component of relaxation (slow krel) was significantly higher in the myofibrils of all R403Q patients together (Figs. 1H and 4C) and when taken individually compared to HCMsmn (Fig. 4D).
As slow krel ∼ gapp ∼ tension cost, the average slow krel values of the three R403Q patients and HCMsmn patients (Fig. 4D) should correspond to the maximal tension cost values (Fig. 2F). A clear positive linear relationship is visible when the data of Figs. 2F and 4D are combined with tension cost as a function of slow krel (Fig. 5). This shows not only that cross-bridge relaxation kinetics and cross-bridge energetics correlate, but also the differences among the three R403Q patients, suggesting that factors other than the R403Q mutation underlie the changes in sarcomere properties.
Figure 5.
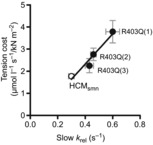
Relation between slow relaxation kinetics and sarcomere energetics and function
The correlation between slow krel of the myofibril preparations and tension cost of the muscle strips can be described by the positive linear equation y = 0.13x + 0.1 with R2 = 0.97. The slow krel measured in myofibrils correlated very well with the energetic cost of isometric tension generation (tension cost) measured in multicellular muscle strips from the same samples. Data are represented as mean ± SEM of HCMsmn (N = 9) and each individual R403Q patient.
Based on kact and slow krel, myofibril force can be estimated using the following formula: (kact – slow krel)/kact. Figure 6A shows that the estimated myofibril force of R403Q(1) was 15% lower compared to HCMsmn. In addition, the apparent rate constant of the transition of the cross-bridges into the force-generating states, fapp, can be calculated as kact – slow krel. Multilevel analysis revealed that the estimated fapp is significantly higher in the R403Q myofibrils together and for each R403Q patient individually compared to HCMsmn (Fig. 6B).
Figure 6.
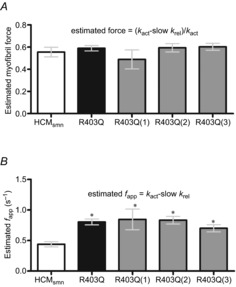
Estimated myofibril force and fapp
A, estimated myofibril force of R403Q(1) myofibrils was lower compared to HCMsmn myofibrils. B, estimated fapp was significantly higher in R403Q myofibrils *P < 0.0001 and for myofibrils of each R403Q patient individually compared to HCMsmn (*P < 0.001, *P < 0.0001 and *P < 0.005, respectively).
Histology
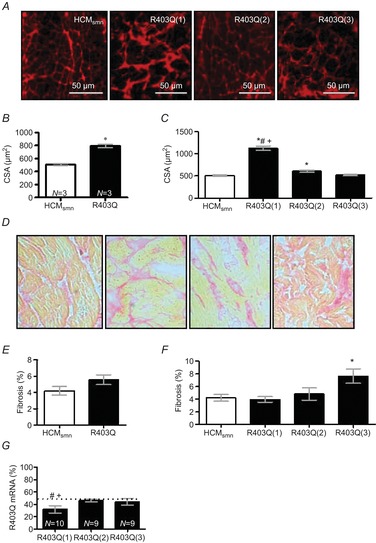
Figure 7A shows representative cross-sections of HCMsmn, R403Q(1), R403Q(2) and R403Q(3) tissue stained with WGA. CSA was significantly higher for R403Q cardiomyocytes compared to HCMsmn cells. The higher cellular CSA was mostly attributed to R403Q(1) cardiomyocytes (Fig. 7B, C). Figure 7D shows representative cross-sections of HCMsmn, R403Q(1), R403Q(2) and R403Q(3) tissue stained with Picrosirius Red. The amount of fibrosis tended to be higher (P = 0.06) in R403Q compared to HCMsmn tissue, largely due to the significantly higher percentage of fibrosis in the R403Q(3) sample (Fig. 7E, F).
Figure 7.
Histological and mRNA analysis
A, representative iamges of WGA-stained cryosections. B, CSA was significantly higher (*P < 0.0001) in the R403Q cardiomyocytes, which was mostly caused (C) by the R403Q(1) and R403Q(2) cardiomyocytes (*P < 0.0001 and P < 0.01, respectively). D, representative images of Picrosirius Red-stained cryosections. E, fibrosis tended to be higher for R403Q compared to HCMsmn (P = 0.06). F, fibrosis was highest for R403Q(3) compared to HCMsmn (P < 0.05). G, RNA was extracted three times from a tissue sample of each patient. The relative expression of the R403Q and wildtype alleles was quantified at least in duplicate. Analysis of mutant R403Q mRNA revealed a deviation from the 50:50 ratio (allelic imbalance) in R403Q(1) with a fraction of mutated mRNA being significantly lower than in R403Q(2) (#P < 0.0001) and R403Q(3) (+P < 0.0002), both showing no allelic imbalance. N = number of individual PCR reactions analysed.
Fraction of mutated MYH7 mRNA
As the three R403Q patients revealed different cross-bridge kinetics and energetics we studied the amount of mutant MYH7 mRNA present in the tissue of these patients. Three RNA extractions per patient were performed. Interestingly, Fig. 7G shows that R403Q(1) has a significant lower amount of R403Q mRNA compared to both R403Q(2) and R403Q(3), while tension cost and slow krel were highest in this patient (Figs. 2F and 4D).
Discussion
This is the first study in which cross-bridge kinetics are directly compared to cross-bridge energetics in cardiac samples from the same patients. Our measurements of ATPase activity during sarcomere contraction in multicellular strips revealed a significantly higher tension cost in R403Q compared to HCMsmn. High tension cost correlated with a significantly higher apparent rate of cross-bridge detachment under isometric conditions (measured from the isometric relaxation rate of myofibrils). Interestingly, changes in cross-bridge kinetics and energetics were not the same in all three R403Q patients. Our study provides evidence that the R403Q MYH7 mutation decreases the economy of myocardial contraction at the level of the sarcomeres and may indeed represent one of the causal factors of cardiomyopathy in patients carrying the R403Q mutation.
Decrease in maximal force
The R403Q mutation is located in a surface loop of the myosin head domain that forms an actin–myosin interface. It has been called the cardiomyopathy loop (Liu et al. 2005) as mutations in this area are known for their detrimental consequences on the cross-bridge cycle and sarcomere function. In both multicellular muscle strips and myofibril preparations of HCM with the R403Q mutation, maximal force tended to be lower compared to HCMsmn (Figs. 2A, B and 4B). Decreased maximal force generating capacity was also reported in human skeletal R403Q muscle fibres (Lankford et al. 1995; Malinchik et al. 1997) and cardiac muscle fibres from transgenic rodents (Blanchard et al. 1999) compared to controls as well. Due to the R403Q mutation the cross-bridges leave the force generating states faster, which is supported by the findings of the present study by the enhanced relaxation kinetics, i.e. increase in gapp (Fig. 4C, D). This should lead to a decline in force generation capacity of the sarcomere (Brenner, 1988; Belus et al. 2008) unless the increase in gapp is compensated for by an increase in fapp. Kinetic data in Table 2 and Fig. 4D support the idea that the R403Q mutation does increase fapp besides increasing gapp, blunting the potential impact on force generation of the increased cross-bridge detachment rate, which was confirmed when myofibril force and fapp were estimated based on kinetic data (Fig. 6A, B). In contrast to the multicellular preparations (Fig. 2B), in myofibril preparations the force reduction was only seen in R403Q(1) (Fig. 4B). This is in line with the larger effects on slow krel, and hence gapp, in this patient compared to R403Q(2) and R403Q(3) (Fig. 4D). In R403Q(2) and R403Q(3) the increase in gapp is not that large and its effect on maximal force is compensated for by the increase in fapp (Fig. 6A, B).
In multicellular preparations other than myofibrils, cellular remodelling such as cellular hypertrophy, a lower myofibrillar density and fibrosis may also contribute to the reduced force generation (Fig. 2A). Indeed, a decrease in myofibrillar density has previously been correlated with the maximal force generating capacity in single human HCM cardiomyocytes with MYH7 mutations (Kraft et al. 2013; Witjas-Paalberends et al. 2013). In the present study we show that cellular hypertrophy (Fig. 7B) and the extent of fibrosis (Fig. 7E) are higher in the R403Q group compared to the HCMsmn. Cellular hypertrophy was highest in the R403Q(1) myectomy sample, which showed the lowest force generating capacity in muscle strips (Fig. 2B), while fibrosis was most prominent in the R403Q(3) sample, which was obtained during HT surgery from an end-stage failing patient. A combination of cellular remodelling and faster gapp could explain the large decline in force in muscle strips of R403Q(1), while remodelling (i.e. fibrosis) seems to be the major determinant of reduced maximal force generation in R403Q(2) and R403Q(3) muscle strips. Another patho-mechanism that may underlie reduced force generating capacity and warrants further research may be protein modifications caused by oxidative stress such as actin carbonylation. Actin carbonylation was found to be increased in human end-stage heart failure tissue (Canton et al. 2011). Interestingly, actin carbonylation was slightly higher in MYH7mut tissue compared to HCMsmn and significantly higher compared to non-failing donor tissue (Witjas-Paalberends et al. 2014b).
Increased relaxation kinetics underlie higher tension cost
A significantly higher tension cost at maximal [Ca2+] was found in multicellular muscle strips of three HCM patients harbouring the R403Q mutation compared to muscle strips from HCMsmn patients (Fig. 2E, F). The same increase in tension cost was seen at submaximal [Ca2+], illustrated by the steeper ATPase activity – tension relationships of R403Q muscle strips compared to HCMsmn (Fig. 3). Overall, our data indicate that the R403Q mutation lowers economy of cardiac muscle contraction at the level of the sarcomere at maximal and submaximal (physiological) [Ca2+].
This study directly shows, in agreement with previous studies, that slow krel is equal to gapp and energetic cost of tension development (Brenner, 1988; Piroddi et al. 2007; de Tombe & Stienen, 2007) as in addition to a ∼80% increase in tension cost, we found a ∼67% higher slow krel of human R403Q myofibrils compared to HCMsmn (Figs. 2 and 4). Moreover, the increase in slow krel for the three patients with R403Q correlated very well with the respective increase in tension cost (Fig. 5). Our data provide evidence that an increase in cross-bridge detachment rate enhances the energetic costs of sarcomere contraction in human HCM with the R403Q mutation.
R403Q leads to a loss of function
Over the years, extensive research has been performed on the functional consequences of the R403Q mutation. In vitro actin sliding velocity (Vactin) and ATPase assays were used to analyse the effects of the R403Q mutation on cross-bridge mechanics and enzymatic properties of human skeletal muscle (Cuda et al. 1993, 1997) and human cardiac muscle expressing the mutant protein (Cuda et al. 1993, 1997; Palmiter et al. 2000; Belus et al. 2008), or on recombinant proteins/transgenic animal models (Sweeney et al. 1994; Sata & Ikebe, 1996; Roopnarine & Leinwand, 1998; Tyska et al. 2000; Yamashita et al. 2000). It appears that the use of different models leads to a variety of outcomes regarding the functional consequences of the R403Q mutation, of which an overview is provided in Table 3. Specifically, the results obtained in rodents regarding the effects of the R403Q mutation cannot directly be extrapolated to the human situation as rodents mostly express α-MyHC in the ventricles compared to mostly β-MyHC in human ventricles (Lompre et al. 1981; Mercadier et al. 1983). Studies using transgenic R403Q mice with either an α-MyHC or a β-MyHC background revealed increased Vactin, actin-activated ATPase activity and MgADP release rate in the α-MyHC background. However, expressing the R403Q mutation in β-MyHC background mice did not enhance any of the three parameters (Lowey et al. 2008, 2013), showing the impact of the specific MyHC background on the mechanical and enzymatic properties.
Table 3.
Summary of the literature regarding R403Q
| Type of tissue | Analyses | Parameters | Conclusions | |
|---|---|---|---|---|
| Cuda et al. (1993) | Soleus, pectoralis of human R403Q patients and healthy controls, cardiac biopsies from human R403Q patients | In vitro motility assay | Actin sliding velocity (Vactin) | Decreased |
| Lankford et al. (1995) | Soleus of human R403Q patients and healthy controls | Skinned fibres functional measurements |
|
|
| Sweeney et al. (1994) | Recombinant R403Q α-MyHC and WT α-MyHC | ATPase assay and In vitro motility assay |
|
|
| Malinchik et al. (1997) | Soleus of human R403Q patients and healthy controls | Skinned fibres functional measurements | Isometric force | Decreased |
| Sata and Ikebe (1996) | Recombinant R403Q β-MyHC |
|
|
|
| Cuda et al. (1997) | Soleus of human R403Q patients and healthy controls, cardiac biopsies from human R403Q patients | In vitro motility assay | Vactin | Decreased |
| Roopnarine & Leinwand (1998) | Recombinant R403Q α-MyHC | ATPase assay |
|
|
| Blanchard et al. (1999) | Cardiac LV α-MyHC403/+ tissue and WT tissue from rodents | Skinned fibres functional measurements |
|
|
| Tyska et al. (2000) | Cardiac tissue from rodents with α-MyHC403+/−, α-MyHC403+/+ and WT |
|
|
|
| Yamashita et al. (2000) | Recombinant smooth muscle R403Q myosin using insect expression systems |
|
|
|
| Palmiter et al. (2000) | Cardiac biopsies from R403Q patients |
|
|
|
| Belus et al. (2008) | Cardiac tissue from a R403Q patient and donor tissue | Functional experiments in myofibrillar preparations |
|
|
| Lowey et al. (2008) | Cardiac tissue from rodents with α-MyHC403+/−, β-MyHC403+/− and WT |
|
|
|
| Lowey et al. (2013) | Cardiac tissue from rodents with α-MyHC403+/−, β-MyHC403+/− and WT | Stopped flow kinetics |
|
|
An in vitro motility study using human cardiac tissue showed an increased Vactin (Palmiter et al. 2000). Single molecule analyses revealed that the increase in Vactin of human R403Q β-MyHC S1 was due to the lower period that the myosin head was connected to actin (ton) without changes in unitary step displacement (d) of the myosin head, suggesting that the R403Q mutation leads to destabilization of the actomyosin interaction, and hence to a more rapid myosin detachment (Palmiter et al. 2000). In a previous (Belus et al. 2008) and in the present study faster relaxation kinetics from isometric steady-state force generation and thus an increase in gapp was found in myofibril preparations of human cardiac R403Q tissue. Overall it appears that the R403Q mutation leads to faster cross-bridge kinetics in combination with an overall loss of function characterized by decreased force production by the cross-bridges and reduced economy of contraction.
Expression of R403Q and sarcomere changes
MYH7 mutations are usually heterozygous, producing both an affected and an unaffected allele, resulting in poison peptides which are incorporated in the sarcomere (Becker et al. 1997, 2007; Nier et al. 1999). Therefore, both healthy and mutated myosin proteins are present in the sarcomere. Analysis of R403Q mRNA revealed an almost 50% expression of the mutant in the two samples obtained during HT surgery, while mRNA expression level of R403Q was significantly lower in the sample (R403Q(1)) obtained during myectomy surgery (Fig. 7G). Previously, Tripathi et al. (2011) and Montag et al. (2012) revealed that heterozygous MYH7 mutations are subject to allelic imbalance, and mRNA and protein levels of mutant myosin correlated with HCM disease severity. Allelic imbalance due to cis-effects leading to different allelic expression of each parental chromosome was previously discovered in humans and linked not only to physiological differences between humans but also to the severity of diseases (Hoffmeyer et al. 1994; Buckland, 2004). Our data on mRNA expression support these previous studies and suggest that expression of mutant mRNA is higher at a more severe stage of cardiac disease, i.e. may increase during HCM development to end-stage heart failure.
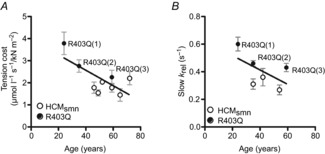
The question remains, however, why both slow krel and tension cost differed among the individual R403Q patients. While the fraction of R403Q mRNA was lowest in R403Q(1) compared to both end-stage failing samples (Fig. 5A), the R403Q(1) heart tissue showed the highest slow krel and tension cost values. The fraction of mutated mRNA therefore did not explain the differences found in kinetics and energetics in the individual R403Q patients. We cannot exclude that the protein levels of the mutant protein do not correspond to the observed mRNA levels. However, a previous study (Tripathi et al. 2011) showed similar expression of several mutants at both mRNA and protein level determined in both cardiac and skeletal muscle tissue. The influence of modifier genes, other than the causal mutated gene, could be a likely candidate as well. Modifier genes have been associated with differences in severity, penetrance and age of onset of HCM disease between patients with the same mutation or even from the same family (Marian, 2000, 2002). This could be of potential interest in R403Q(1) as this patient underwent a myectomy surgery at 25 years of age. Indeed, when age was correlated with tension cost and slow krel (Fig. 8A, B) a correlation was present between age and tension cost (P = 0.03; R2 = 0.51), which clearly cannot be due to HCMsmn as the correlation disappeared when the R403Q patients were excluded (P = 0.6; R2 = 0.09). There was no significant correlation for slow krel and age (P = 0.23; R2 = 0.33) for the entire group. However, when the HCMsmn group was excluded there tended to be a correlation (P = 0.06; R2 = 0.71). Interestingly, single myofibril measurements in a large number of non-failing donors and aortic stenosis patients do not show any effect of age on slow krel either (our unpublished results). Although the groups are too small to draw definite conclusions, based on the present data is seems that the influence of the R403Q mutation on function might be age-dependent and clearly requires future research.
Figure 8.
Correlation with age
A, there was a significant correlation between tension cost and age (P = 0.03; R2 = 0.51), which was not due to HCMsmn. B, there was no significant correlation for slow krel and age taking both HCMsmn and R403Q into account (P = 0.23; R2 = 0.33).
Conclusion
We investigated the direct influence of the MYH7 mutation R403Q on the economy of sarcomere contraction using cardiac muscle from three HCM patients. For comparison we used tissue of HCM patients with a similar clinical phenotype without a sarcomeric gene mutation after thoroughly screening nine genes. Our data show that the presence of a sarcomeric gene mutation is an important determinant of myocardial energy utilization. Our study shows faster cross-bridge kinetics and a direct increase in energetic costs of tension generation of sarcomeres harbouring the R403Q MYH7 mutation compared to HCMsmn sarcomeres. This indicates that the presence of the R403Q mutation can perturb sarcomere energetics, which may reflect one factor causing HCM disease.
Glossary
- CSA
cross-sectional area
- HCM
hypertrophic cardiomyopathy
- HT
heart transplantation
- LV
left ventricle
- MyHC
the protein myosin heavy chain
- MYH7
the gene encoding β-myosin heavy chain
- WGA
wheat germ agglutinin
Additional information
Competing interests
None
Author contributions
Our study represents a collaborative effort between different preclinical and clinical groups with diverse experimental expertise. The original conception and design of our study was born in the ‘Big-HEART’ network funded by the 7th Framework Program of the European Union. All authors approved the final version of the manuscript. Conception and design of the experiments: E.R.W.-P., J.v.d.V., C.P. Collection, analysis and interpretation of data: Myofibril preparations data: C.F., B.S., N.P., C.T., C.P. Multicellular muscle strips data: E.R.W.-P., G.J.M.S., J.v.d.V. mRNA data: J.M., T.K. Clinical and patient data: C.H., M.M., C.P. Drafting the article or revising it critically for important intellectual content: E.R.W.-P., J.M., C.T., G.J.M.S., M.M., C.Y.H., T.K., C.P., J.v.d.V.
Funding
We acknowledge support from the 7th Framework Program of the European Union (‘Big-HEART’, grant agreement 2415577), the Netherlands organization for scientific research (NWO; VIDI grant), Telethon Italy (grant GGP07133) and the Deutsche Forschungsgemeinschaft (DFG) (KR1187119-1).
References
- Becker E, Navarro-Lopez F, Francino A, Brenner B, Kraft T. Quantification of mutant versus wild-type myosin in human muscle biopsies using nano-LC/ESI-MS. Anal Chem. 2007;79:9531–9538. doi: 10.1021/ac701711h. [DOI] [PubMed] [Google Scholar]
- Becker KD, Gottshall KR, Hickey R, Perriard JC, Chien KR. Point mutations in human β cardiac myosin heavy chain have differential effects on sarcomeric structure and assembly: an ATP binding site change disrupts both thick and thin filaments, whereas hypertrophic cardiomyopathy mutations display normal assembly. J Cell Biol. 1997;137:131–140. doi: 10.1083/jcb.137.1.131. [DOI] [PMC free article] [PubMed] [Google Scholar]
- Belus A, Piroddi N, Ferrantini C, Tesi C, Cazorla O, Toniolo L, Drost M, Mearini G, Carrier L, Rossi A, Mugelli A, Cerbai E, van der Velden J, Poggesi C. Effects of chronic atrial fibrillation on active and passive force generation in human atrial myofibrils. Circ Res. 2010;107:144–152. doi: 10.1161/CIRCRESAHA.110.220699. [DOI] [PubMed] [Google Scholar]
- Belus A, Piroddi N, Scellini B, Tesi C, Amati GD, Girolami F, Yacoub M, Cecchi F, Olivotto I, Poggesi C. The familial hypertrophic cardiomyopathy-associated myosin mutation R403Q accelerates tension generation and relaxation of human cardiac myofibrils. J Physiol. 2008;586:3639–3644. doi: 10.1113/jphysiol.2008.155952. [DOI] [PMC free article] [PubMed] [Google Scholar]
- Blanchard E, Seidman C, Seidman JG, LeWinter M, Maughan D. Altered crossbridge kinetics in the MHC403/+ mouse model of familial hypertrophic cardiomyopathy. Circ Res. 1999;84:475–483. doi: 10.1161/01.res.84.4.475. [DOI] [PubMed] [Google Scholar]
- Brenner B. Effect of Ca2+ on cross-bridge turnover kinetics in skinned single rabbit psoas fibers: implications for regulation of muscle contraction. Proc Natl Acad Sci U S A. 1988;85:3265–3269. doi: 10.1073/pnas.85.9.3265. [DOI] [PMC free article] [PubMed] [Google Scholar]
- Buckland PR. Allele-specific gene expression differences in humans. Hum Mol Genet. 2004;13(2):R255–R260. doi: 10.1093/hmg/ddh227. Spec. No. x. [DOI] [PubMed] [Google Scholar]
- Canton M, Menazza S, Sheeran FL, Polverino de LP, di LisaF, Pepe S. Oxidation of myofibrillar proteins in human heart failure. J Am Coll Cardiol. 2011;57:300–309. doi: 10.1016/j.jacc.2010.06.058. [DOI] [PubMed] [Google Scholar]
- Coppini R, Ferrantini C, Yao L, Fan P, Del LM, Stillitano F, Sartiani L, Tosi B, Suffredini S, Tesi C, Yacoub M, Olivotto I, Belardinelli L, Poggesi C, Cerbai E, Mugelli A. Late sodium current inhibition reverses electromechanical dysfunction in human hypertrophic cardiomyopathy. Circulation. 2013;127:575–584. doi: 10.1161/CIRCULATIONAHA.112.134932. [DOI] [PubMed] [Google Scholar]
- Cuda G, Fananapazir L, Epstein ND, Sellers JR. The in vitro motility activity of beta-cardiac myosin depends on the nature of the beta-myosin heavy chain gene mutation in hypertrophic cardiomyopathy. J Muscle Res Cell Motil. 1997;18:275–283. doi: 10.1023/a:1018613907574. [DOI] [PubMed] [Google Scholar]
- Cuda G, Fananapazir L, Zhu WS, Sellers JR, Epstein ND. Skeletal muscle expression and abnormal function of β-myosin in hypertrophic cardiomyopathy. J Clin Invest. 1993;91:2861–2865. doi: 10.1172/JCI116530. [DOI] [PMC free article] [PubMed] [Google Scholar]
- Geisterfer-Lowrance AA, Kass S, Tanigawa G, Vosberg HP, McKenna W, Seidman CE, Seidman JG. A molecular basis for familial hypertrophic cardiomyopathy: a β cardiac myosin heavy chain gene missense mutation. Cell. 1990;62:999–1006. doi: 10.1016/0092-8674(90)90274-i. [DOI] [PubMed] [Google Scholar]
- Hershberger RE, Cowan J, Morales A, Siegfried JD. Progress with genetic cardiomyopathies: screening, counseling, and testing in dilated, hypertrophic, and arrhythmogenic right ventricular dysplasia/cardiomyopathy. Circ Heart Fail. 2009;2:253–261. doi: 10.1161/CIRCHEARTFAILURE.108.817346. [DOI] [PMC free article] [PubMed] [Google Scholar]
- Hoffmeyer S, Assum G, Kaufmann D, Krone W. Unequal expression of NF1 alleles. Nat Genet. 1994;6:331. doi: 10.1038/ng0494-331. [DOI] [PubMed] [Google Scholar]
- Kraft T, Witjas-Paalberends ER, Boontje NM, Tripathi S, Brandis A, Montag J, Hodgkinson JL, Francino A, Navarro-Lopez F, Brenner B, Stienen GJM, van der Velden J. Familial hypertrophic cardiomyopathy: functional effects of myosin mutation R723G in cardiomyocytes. J Mol Cell Cardiol. 2013;57:13–22. doi: 10.1016/j.yjmcc.2013.01.001. [DOI] [PubMed] [Google Scholar]
- Lankford EB, Epstein ND, Fananapazir L, Sweeney HL. Abnormal contractile properties of muscle fibers expressing β-myosin heavy chain gene mutations in patients with hypertrophic cardiomyopathy. J Clin Invest. 1995;95:1409–1414. doi: 10.1172/JCI117795. [DOI] [PMC free article] [PubMed] [Google Scholar]
- Liu X, Shu S, Kovács M, Korn ED. Biological, biochemical, and kinetic effects of mutations of the cardiomyopathy loop of Dictyostelium myosin II: importance of ALA400. J Biol Chem. 2005;280:26974–26983. doi: 10.1074/jbc.M504453200. [DOI] [PMC free article] [PubMed] [Google Scholar]
- Lompre AM, Mercadier JJ, Wisnewsky C, Bouveret P, Pantaloni C, D'Albis A, Schwartz K. Species- and age-dependent changes in the relative amounts of cardiac myosin isoenzymes in mammals. Dev Biol. 1981;84:286–290. doi: 10.1016/0012-1606(81)90396-1. [DOI] [PubMed] [Google Scholar]
- Lowey S, Bretton V, Gulick J, Robbins J, Trybus KM. Transgenic mouse α- and β-cardiac myosins containing the R403Q mutation show isoform dependent transient kinetic differences. J Biol Chem. 2013;288:14780–14787. doi: 10.1074/jbc.M113.450668. [DOI] [PMC free article] [PubMed] [Google Scholar]
- Lowey S, Lesko LM, Rovner AS, Hodges AR, White SL, Low RB, Rincon M, Gulick J, Robbins J. Functional effects of the hypertrophic cardiomyopathy R403Q mutation are different in an α- or β-myosin heavy chain backbone. J Biol Chem. 2008;283:20579–20589. doi: 10.1074/jbc.M800554200. [DOI] [PMC free article] [PubMed] [Google Scholar]
- Malinchik S, Cuda G, Podolsky RJ, Horowits R. Isometric tension and mutant myosin heavy chain content in single skeletal myofibers from hypertrophic cardiomyopathy patients. J Mol Cell Cardiol. 1997;29:667–676. doi: 10.1006/jmcc.1996.0309. [DOI] [PubMed] [Google Scholar]
- Marian AJ. Pathogenesis of diverse clinical and pathological phenotypes in hypertrophic cardiomyopathy. Lancet. 2000;355:58–60. doi: 10.1016/s0140-6736(99)06187-5. [DOI] [PubMed] [Google Scholar]
- Marian AJ. Modifier genes for hypertrophic cardiomyopathy. Curr Opin Cardiol. 2002;17:242–252. doi: 10.1097/01.HCO.0000013803.40803.6A. [DOI] [PMC free article] [PubMed] [Google Scholar]
- Maron BJ, Towbin JA, Thiene G, Antzelevitch C, Corrado D, Arnett D, Moss AJ, Seidman CE, Young JB. Contemporary definitions and classification of the cardiomyopathies: An American Heart Association Scientific Statement From the Council on Clinical Cardiology, Heart Failure and Transplantation Committee; Quality of Care and Outcomes Research and Functional Genomics and Translational Biology Interdisciplinary Working Groups; and Council on Epidemiology and Prevention. Circulation. 2006a;113:1807–1816. doi: 10.1161/CIRCULATIONAHA.106.174287. [DOI] [PubMed] [Google Scholar]
- Maron MS, Olivotto I, Zenovich AG, Link MS, Pandian NG, Kuvin JT, Nistri S, Cecchi F, Udelson JE, Maron BJ. Hypertrophic cardiomyopathy is predominantly a disease of left ventricular outflow tract obstruction. Circulation. 2006b;114:2232–2239. doi: 10.1161/CIRCULATIONAHA.106.644682. [DOI] [PubMed] [Google Scholar]
- Mercadier JJ, Bouveret P, Gorza L, Schiaffino S, Clark WA, Zak R, Swynghedauw B, Schwartz K. Myosin isoenzymes in normal and hypertrophied human ventricular myocardium. Circ Res. 1983;53:52–62. doi: 10.1161/01.res.53.1.52. [DOI] [PubMed] [Google Scholar]
- Montag J, Tripathi S, Weber A-L, Schulte I, Becker E, Borchert B, Navarro-Lopez F, Francino A, Perrot A, Cemil Ö, McKenna W, Osterziel K-J, Brenner B, Kraft T. MYH7-mutation associated allelic imbalance in familial hypertrophic cardiomyopathy: molecular mechanisms and correlation with disease prognosis. Biophys J. 2012;102:613a. [Google Scholar]
- Narolska NA, van Loon RB, Boontje NM, Zaremba R, Penas SE, Russell J, Spiegelenberg SR, Huybregts MA, Visser FC, de Jong JW, van der Velden J, Stienen GJM. Myocardial contraction is 5-fold more economical in ventricular than in atrial human tissue. Cardiovasc Res. 2005;65:221–229. doi: 10.1016/j.cardiores.2004.09.029. [DOI] [PubMed] [Google Scholar]
- Nier V, Schultz I, Brenner B, Forssmann W-G, Raida M. Variability in the ratio of mutant to wildtype myosin heavy chain present in the soleus muscle of patients with familial hypertrophic cardiomyopathy. A new approach for the quantification of mutant to wildtype protein. FEBS Lett. 1999;461:246–252. doi: 10.1016/s0014-5793(99)01433-7. [DOI] [PubMed] [Google Scholar]
- Palmiter KA, Tyska MJ, Haeberle JR, Alpert NR, Fananapazir L, Warshaw DM. R403Q and L908V mutant β-cardiac myosin from patients with familial hypertrophic cardiomyopathy exhibit enhanced mechanical performance at the single molecule level. J Muscle Res Cell Motil. 2000;21:609–620. doi: 10.1023/a:1005678905119. [DOI] [PubMed] [Google Scholar]
- Piroddi N, Belus A, Scellini B, Tesi C, Giunti G, Cerbai E, Mugelli A, Poggesi C. Tension generation and relaxation in single myofibrils from human atrial and ventricular myocardium. Pflugers Arch. 2007;454:63–73. doi: 10.1007/s00424-006-0181-3. [DOI] [PubMed] [Google Scholar]
- Poggesi C, Tesi C, Stehle R. Sarcomeric determinants of striated muscle relaxation kinetics. Pflugers Arch. 2005;449:505–517. doi: 10.1007/s00424-004-1363-5. [DOI] [PubMed] [Google Scholar]
- Potma EJ, Stienen GJM, Barends JP, Elzinga G. Myofibrillar ATPase activity and mechanical performance of skinned fibres from rabbit psoas muscle. J Physiol. 1994;474:303–317. doi: 10.1113/jphysiol.1994.sp020023. [DOI] [PMC free article] [PubMed] [Google Scholar]
- Rayment I, Holden HM, Sellers JR, Fananapazir L, Epstein ND. Structural interpretation of the mutations in the β-cardiac myosin that have been implicated in familial hypertrophic cardiomyopathy. Proc Natl Acad Sci U S A. 1995;92:3864–3868. doi: 10.1073/pnas.92.9.3864. [DOI] [PMC free article] [PubMed] [Google Scholar]
- Roopnarine O, Leinwand LA. Functional analysis of myosin mutations that cause familial hypertrophic cardiomyopathy. Biophys J. 1998;75:3023–3030. doi: 10.1016/S0006-3495(98)77743-4. [DOI] [PMC free article] [PubMed] [Google Scholar]
- Sata M, Ikebe M. Functional analysis of the mutations in the human cardiac β-myosin that are responsible for familial hypertrophic cardiomyopathy. Implication for the clinical outcome. J Clin Invest. 1996;98:2866–2873. doi: 10.1172/JCI119115. [DOI] [PMC free article] [PubMed] [Google Scholar]
- Sequeira V, Wijnker PJM, Nijenkamp LAM, Kuster DWD, Najafi A, Witjas-Paalberends ER, Regan JA, Boontje N, ten Cate FJ, Germans T, Carrier L, Sadayappan S, van Slegtenhorst MA, Zaremba R, Foster DB, Murphy AM, Poggesi C, dos Remedios C, Stienen GJM, Ho CY, Michels M, van der Velden J. Perturbed length-dependent activation in human hypertrophic cardiomyopathy with missense sarcomeric gene mutations. Circ Res. 2013;112:1524–1571. doi: 10.1161/CIRCRESAHA.111.300436. [DOI] [PMC free article] [PubMed] [Google Scholar]
- Shub C, Klein AL, Zachariah PK, Bailey KR, Tajik AJ. Determination of left ventricular mass by echocardiography in a normal population: effect of age and sex in addition to body size. Mayo Clin Proc. 1994;69:205–211. doi: 10.1016/s0025-6196(12)61058-1. [DOI] [PubMed] [Google Scholar]
- Stehle R, Krüger M, Pfitzer G. Force kinetics and individual sarcomere dynamics in cardiac myofibrils after rapid Ca2+ changes. Biophys J. 2002;83:2152–2161. doi: 10.1016/S0006-3495(02)73975-1. [DOI] [PMC free article] [PubMed] [Google Scholar]
- Sweeney HL, Straceski AJ, Leinwand LA, Tikunov BA, Faust L. Heterologous expression of a cardiomyopathic myosin that is defective in its actin interaction. J Biol Chem. 1994;269:1603–1605. [PubMed] [Google Scholar]
- Tesi C, Piroddi N, Colomo F, Poggesi C. Relaxation kinetics following sudden Ca2+ reduction in single myofibrils from skeletal muscle. Biophys J. 2002;83:2142–2151. doi: 10.1016/S0006-3495(02)73974-X. [DOI] [PMC free article] [PubMed] [Google Scholar]
- De Tombe PP, Stienen GJM. Protein kinase A does not alter economy of force maintenance in skinned rat cardiac trabeculae. Circ Res. 1995;76:734–741. doi: 10.1161/01.res.76.5.734. [DOI] [PubMed] [Google Scholar]
- De Tombe PP, Stienen GJM. Impact of temperature on cross-bridge cycling kinetics in rat myocardium. J Physiol. 2007;584:591–600. doi: 10.1113/jphysiol.2007.138693. [DOI] [PMC free article] [PubMed] [Google Scholar]
- Tripathi S, Schultz I, Becker E, Montag J, Borchert B, Francino A, Navarro-Lopez F, Perrot A, Ozcelik C, Osterziel KJ, McKenna WJ, Brenner B, Kraft T. Unequal allelic expression of wild-type and mutated β-myosin in familial hypertrophic cardiomyopathy. Basic Res Cardiol. 2011;106:1041–1055. doi: 10.1007/s00395-011-0205-9. [DOI] [PMC free article] [PubMed] [Google Scholar]
- Tyska MJ, Hayes E, Giewat M, Seidman CE, Seidman JG, Warshaw DM. Single-molecule mechanics of R403Q cardiac myosin isolated from the mouse model of familial hypertrophic cardiomyopathy. Circ Res. 2000;86:737–744. doi: 10.1161/01.res.86.7.737. [DOI] [PubMed] [Google Scholar]
- Volkmann N, Lui H, Hazelwood L, Trybus KM, Lowey S, Hanein D. The R403Q myosin mutation implicated in familial hypertrophic cardiomyopathy causes disorder at the actomyosin interface. PLoS One. 2007;2:e1123. doi: 10.1371/journal.pone.0001123. [DOI] [PMC free article] [PubMed] [Google Scholar]
- Witjas-Paalberends ER, Güçlü A, Germans T, Knaapen P, Harms HJ, Vermeer AMC, Christiaans I, Wilde AAM, dos Remedios C, Lammertsma AA, van Rossum AC, Stienen GJM, van Slegtenhorst M, Schinkel AF, Michels M, Ho CY, Poggesi C, van der Velden J. Gene-specific increase in energetic cost of contraction in hypertrophic cardiomyopathy caused by thick filament mutations. Cardiovasc Res. 2014a doi: 10.1093/cvr/cvu127. doi: 10.1093/cvr/cvu127. [DOI] [PubMed] [Google Scholar]
- Witjas-Paalberends ER, Piroddi N, Stam K, van Dijk SJ, Oliviera VS, Ferrara C, Scellini B, Hazebroek M, Ten Cate FJ, van Slegtenhorst M, Dos Remedios C, Niessen HWM, Tesi C, Stienen GJM, Heymans S, Michels M, Poggesi C, van der Velden J. Mutations in MYH7 reduce the force generating capacity of sarcomeres in human familial hypertrophic cardiomyopathy. Cardiovasc Res. 2013;99:432–441. doi: 10.1093/cvr/cvt119. [DOI] [PubMed] [Google Scholar]
- Witjas-Paalberends ER, Canton M, Michels M, Ho CY, Poggesi C, di Lisa F, van der Velden J. Actin carbonylation is higher in human hypertrophic cardiomyopathy due to MYH7 mutations. Biophys J. 2014b;106:778a–779a. [Google Scholar]
- Yamashita H, Tyska MJ, Warshaw DM, Lowey S, Trybus KM. Functional consequences of mutations in the smooth muscle myosin heavy chain at sites implicated in familial hypertrophic cardiomyopathy. J Biol Chem. 2000;275:28045–28052. doi: 10.1074/jbc.M005485200. [DOI] [PubMed] [Google Scholar]