

Abstract
Temporal expression of positive and negative angiogenic factors in response to detraining is poorly understood. We report the protein expression of anti-angiogenic peptides (thrombospondin-1, TSP-1; and endostatin) as well as pro-angiogenic factors (vascular endothelial growth factor, VEGF; matrix metalloproteinases-2 and -9), and nucleolin (a nuclear protein involved with synthesis and maturation of ribosomes) in response to detraining in triceps surae muscles of C57BL/6 mice. Male mice were allowed to exercise voluntarily for 21 days, and then basal and acute response to exercise were evaluated at 1, 7, 14 and 28 days detraining (D1, D7, D14, D28, respectively, n = 12/group). As seen in the D1 mice, training resulted in the increased muscle capillary-to-fibre ratio (C/F), increased maximal running time and elevated basal expression of VEGF and matrix metalloproteinase-9 (P < 0.05). After 7 days of detraining (D7), C/F levels were similar to control levels, but both basal VEGF and TSP-1 were elevated (P < 0.05). At D14 and D28, TSP-1 protein was not different compared to baseline levels; however, VEGF was elevated in gastrocnemius (GA), but not the soleus (SOL) or plantaris (PLT) muscles, of D14 mice. Endostatin tended to decrease in D14 and D28 compared to controls. Timing of nucleolin protein expression differed between muscle groups, with increases at D1, D7 and D14 in the PLT, SOL and GA muscles, respectively. The response of VEGF and nucleolin to acute exercise was blunted with training, and remained blunted in the PLT and SOL even after 28 days of detraining, at a time point long after muscle capillarization was observed to be similar to pre-training levels. These data suggest that TSP-1 may be a mediator of capillary regression with detraining, even in the face of elevated VEGF, suggesting that pro-angiogenic regulators may not be able to prevent the regression of skeletal muscle capillaries under physiological conditions. The responses of matrix metalloproteinases, endostatin and nucleolin poorly correlated with detraining-induced capillary regression.
Key points
Skeletal muscle capillary regression is associated with elevated thrombospondin-1 and vascular endothelial growth factor protein expression with detraining.
Vascular endothelial growth factor and nucleolin responses to acute exercise are blunted in the triceps surae muscles following exercise training. In the plantaris and soleus muscles, this blunted response persists up to 28 days after cessation of training.
Effects of detraining on skeletal muscle microvascular density appears to be similar among skeletal muscle of varying oxidative potential and is poorly associated with expression of matrix metalloproteinases-2 and -9 and endostatin.
Introduction
It is generally accepted that physiologic angiogenesis in skeletal muscle is controlled by a balance between positive and negative factors (Egginton, 2009; Olfert & Birot, 2011). Among the angioregulatory factors believed important in skeletal muscle are pro-angiogenic vascular endothelial growth factor (VEGF) and anti-angiogenic thrombospondin-1 (TSP-1), both of which have been shown to exhibit robust mRNA response to an acute bout of exercise in rodents and humans (Breen et al. 1996; Gustafsson et al. 1999; Richardson et al. 1999; Gavin & Wagner, 2001; Olfert et al. 2006; Hoier et al. 2012). Indeed, gene deletion strategies in mice have shown that muscle-specific loss of VEGF decreases basal muscle capillarity (Tang et al. 2004; Olfert et al. 2009), whereas a loss of TSP-1 increases basal muscle capillarity (Malek & Olfert, 2009). Moreover, lack of skeletal muscle VEGF has been reported to prevent training-induced skeletal muscle angiogenesis (Olfert et al. 2010) and muscle overload-induced angiogenesis (Gorman et al. 2014), demonstrating that myocyte-derived VEGF is essential to capillary expansion in response to angiogenic-inducing stimuli. While the molecular underpinnings of capillary expansion in response to exercise have been intensely studied (see reviews by Prior et al. 2004; Egginton, 2009; Olfert & Birot, 2011), the mechanisms involving physiologic regression of muscle capillaries (e.g. after cessation of training, during spaceflight or with ageing) are less well understood.
The timing of positive and negative angiogenic factors response to exercise has been postulated to be important to successfully executing the highly choreographed angiogenic process (Egginton, 2009; Olfert & Birot, 2011; Olenich et al. 2013). Likewise, it might also be expected that the temporal expression of angioregulatory peptides might be important in determining the regression of capillaries in skeletal muscle undergoing physical deconditioning. At present, we are aware of only two studies that report the expression of VEGF following detraining in skeletal muscle. Malek et al. (2010) report that basal VEGF protein expression is elevated in the plantaris (PLT) and unchanged in the soleus (SOL) after 7 days of detraining in rats, while Huttemann et al. (2012) report increased basal VEGF and unchanged TSP-1 protein expression in the gastrocnemius (GA) muscle of wild-type mice after 14 days of detraining. The data from these independent studies suggest the temporal response of VEGF and TSP-1 may differ with time spent detraining. Each study, however, only reported a single time point and used different rodent models; therefore, it is difficult to characterize fully and to interpret the temporal effects. Moreover, neither study included assessments of matrix metalloproteinases (MMPs) and/or endostatin, which are also known to be important in regulating angiogenesis. For example, MMP-2 and MMP-9 are needed to destabilize the basement membrane of the existing vasculature and the extracellular matrix for microvessel remodelling to occur (Nagase & Woessner, 1999; Haas et al. 2000). Endostatin is a 22 kDa anti-angiogenic fragment of collagen XVIII that is cleaved by MMPs and is capable of inhibiting VEGF and upregulating TSP-1 (Yamaguchi et al. 1999; Kim et al. 2000, 2002; Volpert et al. 2002; Hu et al. 2012) and therefore could have a significant influence on capillary regression. Also of interest, is the finding that endostatin activity may be dependent on nucleolin, which is a nuclear protein found on the surface of endothelial cells undergoing proliferation and is important for processing ribosome transcription and the import/export of proteins to the nuclear membrane (Lapeyre et al. 1987; Srivastava & Pollard, 1999). There is evidence that nucleolin and endostatin colocalize on the cell surface, which leads to endostatin transport to the nuclei where its inhibiting effects on cell proliferation can take place (Shi et al. 2007). We have recently reported that nucleolin is responsive to acute exercise on the same time scale as that seen for endostatin and VEGF (Olenich et al. 2013), and thus the temporal expression of nucleolin and endostatin could be an important pathway regulating the capillary regression within skeletal muscle.
The purpose of this study was to characterize the temporal expression of several key angiogenic regulators in mice undergoing physiologic capillary regression during detraining. We hypothesize that detraining will preferentially increase the temporal expression of negative angiogenic regulators (such as TSP-1, endostatin) with little influence on the basal expression of pro-angiogenic regulators (such as VEGF, MMP-2, MMP-9, nucleolin), leading to losses in the skeletal muscle microvasculature and reduced exercise performance with detraining. To test this hypothesis, we provided mice with unrestricted access to running wheels for 21 days, which is a time frame known to significantly increase hindlimb skeletal muscle capillarity with voluntary wheel running (Waters et al. 2004; Olenich et al. 2013). Then muscle capillarity, basal protein expression and protein response to acute exercise were examined in mouse groups that detrained for 1, 7, 14 and 28 days.
Methods
Animals
Male C57BL/6 mice were purchased from Jackson Laboratories (stock no. 000664; Bar Harbor, ME, USA). Mice were singly housed in 12 h:12 h light/dark cycle in standard mouse cages with corn cob bedding (Harlan no. 7092a) and provided free access to food (Harlan Rodent Chow no. 2018; Harlan, Indianapolis, IN, USA) and tap water. All mice were housed in the same temperature and humidity controlled vivarium room at the West Virginia University Health Sciences Center. Experiments and animal care/handling were performed in accordance with the PHS Animal Welfare Act and received approval from the West Virginia University Institutional Animal Care and Use Committee.
Training and deconditioning
Sixty male C57BL/6 mice were randomly assigned into a control group (no training) or one of four train/detrain groups corresponding to 1, 7, 14 and 28 days detraining (D1, D7, D14 and D28, respectively; n = 12/group). For training, mice were given 24 h access to running wheels to exercise voluntarily for 21 days before detraining. Mice were individually housed in cages containing a running wheel (4.5″ Mouse Wheel; Respironics, Bend, OR, USA) connected to a bike computer (Cateye Strada CC-RD100N; CatEye North America, Boulder, CO, USA), which digitally measured and recorded running time, speed and distance. Throughout the training period, daily exercise activity was recorded and logged over 24 h intervals for each animal. Upon completion of training the wheels were removed from the cages and mice were detrained according to the respective group assignment (i.e. D1, D7, D14 and D28) (Fig. 1). Basal muscle expression for D1 mice (n = 6) was evaluated after 1 day without access to the running wheel, which serves as a trained group. It was important to have a full day without access to the running wheel to eliminate/minimize the potential of wheel running exercise on the basal expression levels. The remaining detraining groups were euthanized on the respective day of detraining for each group, i.e. D7, D14, D28; n = 6/per group. The timing of when training began, for the respective detraining groups, was carefully planned so that the end-point for each animal group would result in mice of similar age when euthanized. Untrained sedentary control mice were housed with detrained mouse groups and euthanized at the same age corresponding to the detraining groups.
Figure 1.
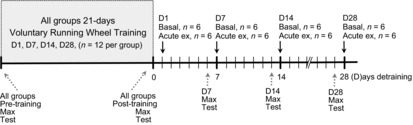
Time line depicting study design
Acute ex = 1 h acute exercise on rodent treadmill at 20 m min−1, 10° incline. Following the acute exercise bout, mice were killed 4 h later to assess expression of angioregulatory factors in response to an exercise stimulus. Control mice (not shown in figure) did not have access to running wheels and therefore served as untrained controls.
Acute exercise
To examine the angiogenic responses to acute exercise at each of the time points, half of the mice (n = 6 per group) performed a standardized single 1 h acute bout of exercise at 20 m min−1 with a 10° incline on a rodent treadmill (Exer-6M Treadmill; Columbus Instruments, Columbus, OH), and were then euthanized 4 h after the acute exercise bout. This level of acute exercise has previously been shown to stimulate an increased expression of angioregulatory factors (Olfert et al. 2001a, 2006), and the 4 h time point corresponds to the peak protein responses we have recently reported for VEGF, endostatin and nucleolin (Olenich et al. 2013). Similar to the basal muscle expression for D1 group, acute exercise was performed at least 24 h after removal of access to the running wheel to eliminate/minimize the potential of the confounding influence from wheel running exercise (Fig. 1). For all mice, the left triceps surae muscles, i.e. GA, PLT and SOL, were extracted for molecular analysis and the same muscles from the contralateral leg used for morphometric analysis of muscle capillarity.
Maximal run test
A maximal running speed test was used to assess aerobic performance before training, after training and after detraining. All mice had been previously familiarized to the rodent treadmill (Exer-6M Treadmill; Columbus Instruments). The test was performed at a 10° incline, and consisted of a warm-up phase for 5 min at 4 m min−1, after which running speed was increased by 2 m min−1 every 30 s until the animal was exhausted. Exhaustion was defined by the inability of the animal to continue running on the belt despite manual prodding with a brush or mild electrical stimulus (<0.2 mA) from the shock grid at the rear of the treadmill. All mice successfully completed the maximal run tests. To minimize the potential that the maximal run test would interfere with our assessments of protein expression, all mice had at least 24–30 h between maximal run test and the time of sacrifice (Fig. 1).
Tissue collection and processing
Mice were anaesthetized with xylazine/ketamine (Ketaject 100 mg kg−1, Xylazine 5 mg kg−1) via intraperitoneal injection. Once anaesthetized the triceps surae muscles from the left leg were carefully removed at its respective origin and insertion attachment, weighed and immediately flash frozen in liquid nitrogen for protein analyses. Triceps surae muscles from the right leg were removed in the same manner and carefully processed (i.e. resecting the mid-belly of the muscles and transversely positioning on a cork base with TBS Tissue Freezing Medium™) and flash-frozen in liquid N2-cooled isopentane (2-methylbutane, Fisher Chemical O3551–4; Fisher Scientific Waltham, MA, USA). All muscle samples were stored at −80°C until processed for molecular or morphometric analyses.
Protein analysis
Skeletal muscle was homogenized using a lysis buffer containing 50 mm Tris/HCl (pH 7.4), 150 mm NaCl, 0.5% Triton X-100 and protease inhibitors (Complete™ Tablet; Roche Applied Science, Indianapolis, IN, USA). Homogenates were centrifuged at 4°C, 14,000 g for 10 min, after which the supernatant was removed and placed in new tubes. Total protein was measured by the Bradford Assay (Coomassie Plus no. 23236 Assay; Pierce Biotechnology, Rockford, IL, USA).
Mouse VEGF, MMP-2 and MMP-9 protein levels were measured from 100 μg of total protein using commercially available ELISA kits (VEGF # MMV00, MMP-9 # MMPT90 from R&D Systems, Minneapolis, MN, USA and MMP-2 # ELM-MMP2–001 from RayBiotech, Norcross, GA, USA). All analyses were performed according to the manufacturers’ specifications and optical densities were measured using a microplate reader (BioRad Model 550, Global Medical Instrumentation Inc., Ramsey, MN, USA). For Western analysis, samples were denatured (18 μg SOL, 39 μg PLT, 39–65 μg GA) and separated on 26-well 8% Bis Tris Midi Gel (WG1003BX10; Novex, Carlsbad, CA, USA) and blotted on to a 0.45 μm nitrocellulose membrane (nitrocellulose membrane no. 88018; Thermo Scientific Waltham, MA, USA). Membrane was blocked with 5% fat-free milk in TBS and probed with antibodies for TSP-1 (1:2000, A6.1: sc-59887; Santa Cruz Biotechnology, Santa Cruz, CA, USA); nucleolin (1:1000, no. A300–711A; Bethyl Laboratories, Montgomery, TX, USA); GAPDH (1:500, mouse anti-GAPDH no. 39–8600; Invitrogen, Camarillo, CA, USA); and endostatin (1:1000, antimouse endostatin antibody # AF570; R&D Systems). Chemiluminescence detection allowed for visualization of proteins (ECL Western Blotting Substrate, no. 32209; Pierce, Rockford, IL, USA) and images of blots were taken using Genesnap software (version 7.01) from a digital imager (G-Box Chemi16; Syngene, Cambridge, UK). Protein expression was quantified by using NIH ImageJ Software (version 1.62) and expressed as densitometric arbitrary units (a.u.). Normalization to GAPDH was used to account for potential variations in total protein loaded within each gels. GAPDH was selected because it has been identified as a stable and appropriate housekeeping gene for endurance and acute exercise studies (Jemiolo & Trappe, 2004; Mahoney et al. 2004; McKenzie et al. 2011). In addition, we loaded the same three control samples on each gel (to serve as reference samples) to compare responses from groups run on different gels/blots. Thus, we are able to reliably compare responses across groups obtained from multiple blots.
Histochemistry
Corks containing frozen muscle embedded in tissue freezing medium were cut into serial 8–10 μm transverse sections using a cryomicrotome at −20°C (Leica CM1850; Leica Biosystems, Buffalo Grove, IL, USA) and mounted on glass slides (Colormark* Plus Adhesion Slides, no. CM-7951; Thermo Scientific) for histochemical analysis of muscle morphometry. Sections were obtained from the widest part of the muscle with muscles fibres in a transverse orientation. Muscle capillarity was determined by measuring capillary-to-fibre ratio (C/F) by using the alkaline phosphatase and dipeptidylpeptidase capillary staining method (Mrazkova et al. 1986). Stained muscle sections were viewed by light microscopy and digitally imaged at 20× magnification. Muscle capillarity was assessed from deep and superficial regions within the GA. Deep regions are defined as the inner half of the GA muscle (closest in proximity to the PLT and SOL muscles), while superficial regions are comprised of the outer half of the GA (closest in proximity to the skin). Up to 15 digital images were obtained from each quadrant in a pseudo-random selection process. Images were selected if they did not overlap with any previous image selected and did not violate the boundary used to demarcate the quadrant being imaged. The imaging technician was instructed not to ‘frame’ each image per se, but rather accept the random image position (after moving the microscope stage) within each quadrant, provided they do not violate the image selection criteria above.
Statistical analyses
All data shown are means ± s.e.m., unless otherwise indicated. Kolmogorov–Smirnov testing revealed no significant outcomes in our data sets indicating normality in the distribution of the data, and therefore appropriate for parametric testing. Changes in protein expression, exercise performance during training (i.e. daily distance run, time running, average speed and maximal speed) and muscle capillarity indices were analysed using one-way ANOVA. Repeated measure ANOVA was used for multiple measures of maximal exercise performance testing. The combined effects of training and the angiogenic factor response to acute exercise were determined using a 2 (condition: basal or acute exercise) × 5 (time: control, D1, D7, D14 or D28) factorial ANOVA. When a main effect was observed, we used Tukey post hoc testing to examine detraining group differences compared to controls. In some cases, using the Fisher LSD post hoc analysis would have resulted in a significant difference (P < 0.05) between groups, which we are not reporting (i.e. in Fig. 3, D1 vs. D28, and D14 vs. D28, and control vs. D14). We chose the more conservative Tukey analysis to reduce the probability of accepting a spurious finding and a type I statistical error.
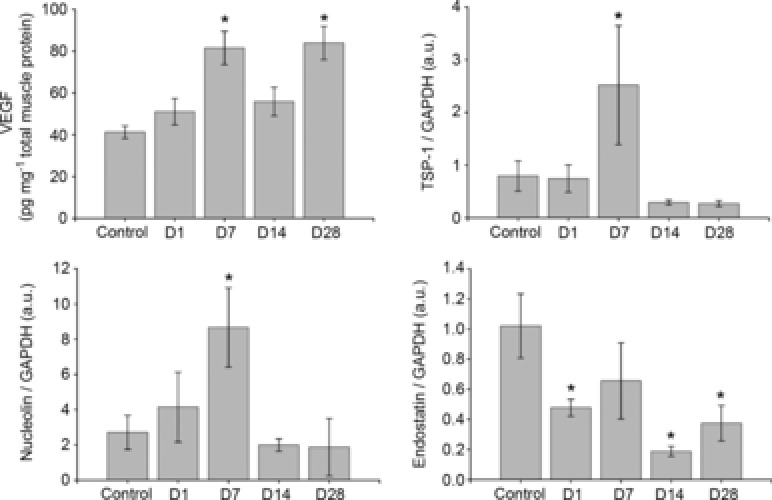
Figure 3.
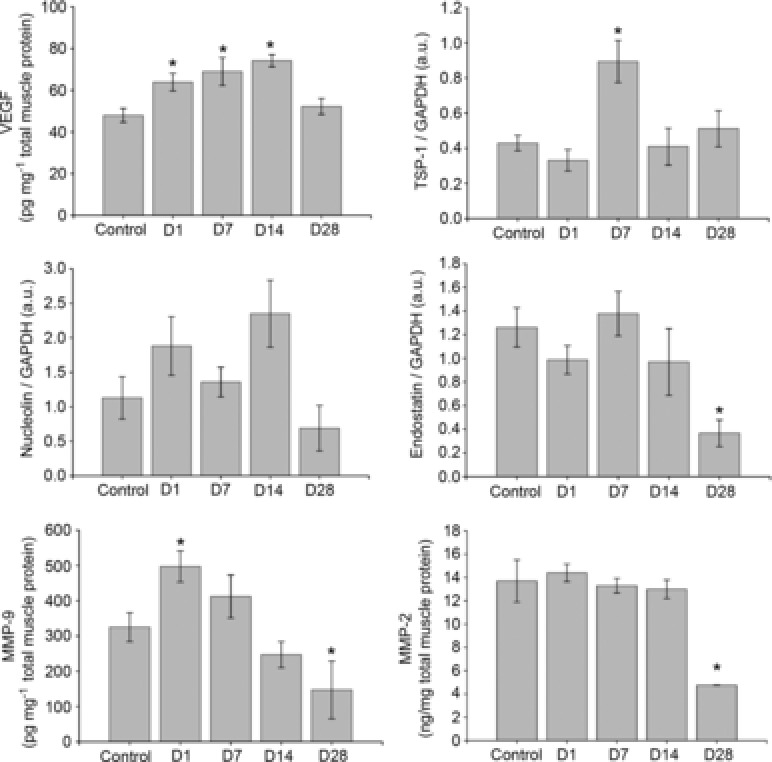
Basal gastrocnemius muscle protein expression of VEGF, TSP-1, MMP-2, MMP-9, endostatin and nucleolin
Control mice did not train, all other groups of mice voluntarily trained on running wheels for 21 days and subsequently detrained for 1, 7, 14 or 28 days. *P < 0.05 compared to control. All data are n = 6 male mice per group and are represented as mean ± s.e.m., arbitary densitometry units (au) from Western blot analysis; D, days detrained; MMP, matrix metalloproteinase; TSP, thrombospondin; VEGF, vascular endothelial growth factor.
All statistics were performed using Statview Statistical Software package (v5.0.01; SAS Institute Inc., Cary, NC, USA). Significance was set at α level of P ≤ 0.05.
Results
Training and aerobic performance in response 21 days of voluntary training
The time spent running during training was not significantly different between the respective mouse groups (Table 1). However, mice in the D14 and D28 groups did have slightly higher average running speeds compared to D7 and D1 mice, and therefore also displayed higher average distance run per day compared to D7, but not compared to D1 mice (Table 1). None the less, the groups displayed a similar increase in aerobic performance, i.e. 28% (±19% s.d.) increase in maximal running speed (Fig. 2), suggesting a similar degree of physiological adaptation. This increase in aerobic performance was lost and similar to pre-training levels in all groups with 7 or more days of detraining (Fig. 2).
Table 1.
Daily wheel running performance during training
| D1 Group | D7 Group | D14 Group | D28 Group | |
|---|---|---|---|---|
| Average running time per day (min) | 332 ± 24 | 306 ± 52 | 392 ± 52 | 358 ± 24 |
| Average distance run per day (km) | 6.0 ± 0.6 | 4.5 ± 0.4 | 7.5 ± 0.6† | 7.1 ± 0.8† |
| Average running speed (km h−1) | 1.03 ± 0.05 | 0.96 ± 0.04 | 1.22 ± 0.09*,† | 1.26 ± 0.05*,† |
Mean ± s.e.m. n = 12 per groups.
Different compared to D1.
Different compared to D7. In all cases P < 0.05.
Figure 2.
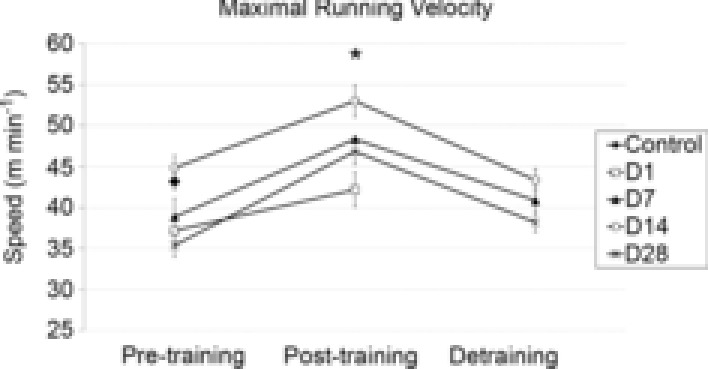
Maximal running test showing aerobic exercise capacity before training (pre-training), post-training and after detraining in male mice
The maximal run test is measured using a standardized incremental maximal exercise protocol on a rodent treadmill. *P < 0.05 compared to pre-training. All data are n = 12/group and are represented as mean ± s.e.m.
Animal body mass and muscle characteristics
There was no significant difference in age, body mass or hindlimb muscle mass compared to the control group (Table 2), indicating that our mice were well randomized into the various groups and that no inherent difference in their gross physical characteristics existed. When compared to control mice, trained mice (i.e. D1) showed elevated C/F in the GA (P < 0.05), PLT (P < 0.05) and SOL (P < 0.05) (Table 2). In all muscles, C/F was lower in mice that detrained for 7 or more days (i.e. D7, D14 and D28) compared to trained mice (i.e. D1). The C/F in D7, D14 or D28 group mice were also not significantly different compared to untrained controls.
Table 2.
Animal group charateristics
| All groups trained + detraining | |||||
|---|---|---|---|---|---|
| Untrained | Detrained 1 | Detrained 7 | Detrained 14 | Detrained 28 | |
| control | day (D1) | days (D7) | days (D14) | days (D28) | |
| Age, days | 106 ± 0.1 | 105 ± 0.0 | 104 ± 0.0 | 102 ± 0.0 | 110 ± 0.0 |
| Body mass, g | 27.2 ± 0.5 | 27.9 ± 0.4 | 27.2 ± 0.4 | 26.5 ± 0.4 | 27.4 ± 0.8 |
| GA muscle, mg | 148.5 ± 3.8 | 148.3 ± 3.3 | 146.0 ± 2.7 | 143.1 ± 2.4 | 145.4 ± 3.5 |
| PLT muscle, mg | 21.1 ± 0.7 | 22.0 ± 0.8 | 20.4 ± 0.5 | 20.0 ± 0.5 | 20.5 ± 0.6 |
| SOL muscle, mg | 8.8 ± 0.4 | 10.3 ± 0.4 | 8.8 ± 0.4 | 8.7 ± 0.2 | 8.7 ± 0.5 |
| GA/BM, % | 0.546 ± 0.012 | 0.531 ± 0.009 | 0.538 ± 0.009 | 0.539 ± 0.005 | 0.533 ± 0.008 |
| PLT/BM, % | 0.078 ± 0.003 | 0.079 ± 0.003 | 0.075 ± 0.002 | 0.075 ± 0.001 | 0.075 ± 0.002 |
| SOL/BM, % | 0.032 ± 0.002 | 0.037 ± 0.001 | 0.032 ± 0.001 | 0.033 ± 0.001 | 0.032 ± 0.001 |
| GA C/F | 1.37 ± 0.04 | 1.66 ± 0.16* | 1.20 ± 0.08† | 1.30 ± 0.07† | 1.35 ± 0.11† |
| PLT C/F | 1.26 ± 0.04 | 1.44 ± 0.05* | 1.17 ± 0.05† | 1.28 ± 0.08 | 1.10 ± 0.10† |
| SOL C/F | 1.61 ± 0.07 | 1.81 ± 0.01* | 1.62 ± 0.03† | 1.72 ± 0.07 | 1.53 ± 0.05† |
Mean ± s.e.m. n = 12 per groups, except for C/F data where n = 5–7 in each group. Abbreviations: BM, body mass; C/F, capillary-to-fibre ratio; GA, gastrocnemius; PLT, plantaris; SOL, soleus.
Different compared to control.
Different compared to D1. In all cases P < 0.05.
Basal protein expression
Gastrocnemius
As shown in Fig. 3, 1 day after cessation of training (D1) mice displayed an increase of basal VEGF (P < 0.05) and MMP-9 (P < 0.05), while all other factors measured remained unchanged when compared to untrained controls. At D7, VEGF (P < 0.01) was elevated and TSP-1 was significantly increased (P < 0.01) compared to control mice. At D14, basal VEGF (P < 0.01) remained higher compared to controls, while TSP-1 levels were not different compared to controls. At D28, basal VEGF and TSP-1 levels were similar to untrained controls, while endostatin (P < 0.01), MMP-2 (P < 0.01) and MMP-9 (P < 0.05) were all lower compared to controls.
Plantaris
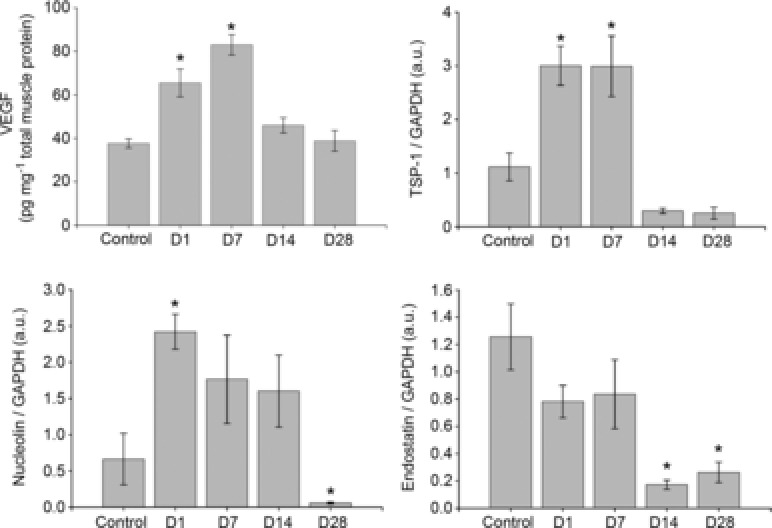
As shown in Fig. 4, training (D1) increased basal VEGF (P < 0.01), nucleolin (P < 0.05) and TSP-1 (P < 0.01). At D7, VEGF (P < 0.01) and TSP-1 (P < 0.01) were both elevated compared to controls. Nucleolin and endostatin were not different compared to controls. At D14, endostatin (P < 0.01) was lowered, while neither VEGF, nor TSP-1 nor nucleolin were significantly different from controls. At D28, endostatin (P < 0.01) was decreased, but neither VEGF, nor TSP-1 nor nucleolin were different from controls.
Figure 4.
Basal plantaris muscle protein expression of VEGF, TSP-1, MMP-2, MMP-9, endostatin and nucleolin
Control mice did not train, all other groups of mice voluntarily trained on running wheels for 21 days and subsequently detrained for 1, 7, 14 or 28 days. *P < 0.05 compared to control. All data are n = 6 male mice per group and are represented as mean ± s.e.m., arbitary densitometry units (au) from Western blot analysis; D, days detrained; MMP, matrix metalloproteinase; TSP, thrombospondin; VEGF, vascular endothelial growth factor.
Soleus
As shown in Fig. 5, trained (D1) mice exhibited a lowered endostatin level (P < 0.05) compared to the controls, with no significant effect on VEGF, TSP-1 or nucleolin. At D7, endostatin was not different from controls, but VEGF (P < 0.01), nucleolin (P < 0.01) and TSP-1 (P < 0.05) were all significantly increased. At D14, endostatin was decreased (P < 0.01), while VEGF, TSP-1 and nucleolin were not different compared to controls. At D28, VEGF was elevated (P < 0.01), endostatin was decreased (P < 0.01), and TSP-1 and nucleolin were not different from control levels.
Figure 5.
Basal soleus muscle protein expression of VEGF, TSP-1, MMP-2, MMP-9, endostatin and nucleolin
Control mice did not train, all other groups of mice voluntarily trained on running wheels for 21 days and subsequently detrained for 1, 7, 14 or 28 days. *P < 0.05 compared to control. All data are n = 6 male mice per group and are represented as mean ± s.e.m., arbitary densitometry units (au) from Western blot analysis; D, days detrained; MMP, matrix metalloproteinase; TSP, thrombospondin; VEGF, vascular endothelial growth factor.
Protein response to acute exercise
VEGF protein expression increased in response to acute exercise in the PLT (P < 0.05) and SOL (P < 0.01), and to a lesser extent in GA muscle, of the control mice (Fig. 6). This response was blunted with training (D1) and remained blunted after 7, 14 or 28 days of detraining in the PLT or SOL. Endostatin exhibited a time × acute exercise interaction in the SOL with (P < 0.05), with a similar trend seen in the PLT (P = 0.057), but this was not observed in the GA. In control mice, nucleolin tended to increase in response to acute exercise in all three muscles, but this did not prove statistically significant. However, a significant time × acute exercise interaction (P < 0.05) was observed for nucleolin in the GA and PLT (Fig. 6), suggesting that training blunted this response.
Figure 6.
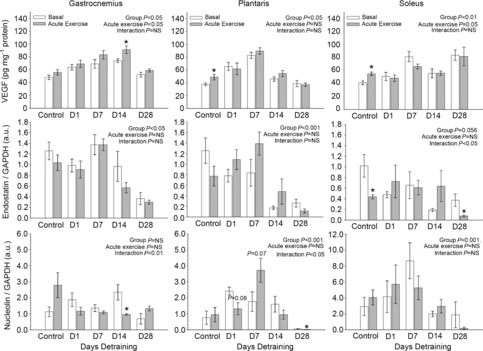
Protein expression in response to acute exercise for VEGF, endostatin and nucleolin in the gastrocnemius, plantaris and soleus compared to basal expression reported in Figs 3–5, respectively
Data reflect protein expression 4 h postacute exercise. *P < 0.05 compared to basal in same detrained. VEGF, vascular endothelial growth factor .
The acute responses for TSP-1, MMP-2 and MMP-9 to exercise are not reported because the protein expression for these factors have previously been shown to respond at a much later time postexercise (>12 h) than the 4 h time point used in this study (Olenich et al. 2013).
Discussion
The principal finding of this study is that losses in skeletal muscle capillarity occurring after 7 days detraining are associated with elevated basal expression of TSP-1, along with elevated basal VEGF protein levels. Endostatin was not elevated at 7 days post-training compared to controls, but rather demonstrated a tendency to decrease with greater time spent detraining. Based on the putative activities for TSP-1 and VEGF, these data suggest that losses in skeletal muscle capillarity due to physical deconditioning may be more dependent on the temporal expression of negative angiogenic regulators (such as TSP-1) rather than reductions in positive angiogenic regulators (such as VEGF).
Training response and muscle capillarization
As expected, the voluntary training paradigm we used increased skeletal muscle capillarity in all the muscles we analysed. Consistent with training-induced increases in muscle C/F, we observed an elevated basal expression of VEGF and MMP-9 in trained mice (D1 group), with one exception, where VEGF was not elevated in the SOL muscle in D1 mice. However, the lack of elevated basal VEGF in the SOL muscle is perhaps not surprising and is consistent with evidence that that VEGF mRNA is upregulated to a greater extent in type IIb myofibres than type I or IIa (Birot et al. 2003). The SOL is a highly oxidative muscle with a rich vascular supply and therefore is not expected to experience the same oxygen deficit created by exercise, which is thought to be one of the stimuli that triggers the induction of VEGF in response to exercise.
Basal expression of TSP-1, MMP-2, endostatin and nucleolin after 21 days of training (as shown in the GA of D1 mice) are consistent with our previous data reporting basal expression after 14 and 28 days of voluntary wheel run training) (Olenich et al. 2013). However, it should be noted, our current observation that basal MMP-9 expression is elevated after 21 days training contrasts with our previous finding of lower MMP-9 in 14 day trained mice (Olenich et al. 2013). None the less, the current observation is consistent with other studies in rodents (Haas et al. 2000; Carmeli et al. 2007) and humans (Rullman et al. 2009) showing elevated MMP-9 with training.
In this study we report the expression of angiogenic regulators in the three different muscles varying oxidative potential (i.e. GA, PLT and SOL). In this regard, we were surprised to observe that TSP-1 was increased with training in the PLT muscle, but not GA and SOL, as seen in D1 mice in Figs 5. The reason for this selective response to training in the PLT is not clear. However, it is possible that this finding could be due the greater glycolytic fibre type composition of the PLT muscle compared to the greater oxidative nature of the SOL and the mixed fibre-type composition in the GA. This is supported by evidence of the lower VEGF/TSP-1 ratio (suggesting higher TSP-1 relative to VEGF) reported in PLT muscle compared to the SOL muscle during hindlimb unloading (Roudier et al. 2010).
We also find that basal expression of nucleolin was increased in GA and PLT with training (Figs 2 and 3, respectively), and that training blunted the nucleolin response to acute exercise (in all the muscles analysed) when comparing D1 to control mice (Fig. 6). Although the exact role of nucleolin in the skeletal muscle response to exercise has yet to be elucidated, indirect evidence suggests that VEGF may help to translocate nucleolin from the nucleus to the cell surface of proliferating endothelial cells (Christian et al. 2003; Huang et al. 2006) where it is capable of binding and internalizing endostatin (Shi et al. 2007; Song et al. 2012). If true, the blunted muscle VEGF response to acute exercise following exercise training in mice might also explain the blunted nucleolin response observed here and in our previous training study (Olenich et al. 2013).
Detraining and basal protein expression in skeletal muscles
The temporal basal protein expression pattern of the angiogenic regulators we studied in response to detraining were generally similar across the different muscles studied, with only a few exceptions. This suggests, in contrast to that seen with training, the angioregulatory response to detraining may be more uniformed and perhaps minimally influenced by muscle fibre type composition. Most notably, in all the muscles examined, there was an elevated basal expression of VEGF and TSP-1 at D7, which temporally corresponded to the loss of training-induced increases in muscle microvessel density. The timing of this morphological response was somewhat surprising given the elevated expression of VEGF protein at this (D7) time point. However, it is also interesting to note that basal VEGF in the GA muscle was elevated after 14 days of detraining, perhaps suggesting the muscle is still primed for angiogenesis during the first several weeks following cessation of training but is unable to drive angiogenesis due to dependence on a cofactor not present or the elevated presence of angiogenic inhibitors (e.g. TSP-1). Only after 28 days of detraining did basal VEGF match that seen in controls in the GA. At this same 28 day time point, endostatin, MMP-2 and MMP-9 were all also significantly reduced compared to controls. Since endostatin is a fragment of collagen XVIII whose cleavage is dependent on the activity of MMPs, it is possible that the reduced endostatin seen in D28 mice is simply due to the lower MMPs also seen at this time point. It remains to be determined what benefit is derived in having a reduction in MMPs and/or endostatin for such a long period (i.e. 3 weeks) after muscle capillarization had returned to normal.
Taken together, the theme that emerges is that both TSP-1 and VEGF are elevated after capillary regression occurred with detraining. This is consistent with evidence that TSP-1 is involved in capillary regression seen during the female menstrual cycle (Iruela-Arispe et al. 1996; Slater & Murphy, 1999) and in response to wound healing (Streit et al. 2000; Agah et al. 2002). Indeed, in the uterus, TSP-1 has been associated with low capillary growth in the secretory phase (Iruela-Arispe et al. 1996), while VEGF is has been shown to be most strongly detected in the late proliferative and secretory menses phase (Bausero et al. 1998). Thus, perhaps it is not surprising to have elevated basal VEGF levels (at D7) at the same time that muscle microvessels have regressed. Unfortunately, the temporal resolution in response to detraining in current study design does not allow us to pinpoint when TSP-1 was first upregulated between D1 and D7 groups, or when the morphological reversal occurred in the muscle microvascular bed between D1 and D7. However, based on these data it seems clear that morphological changes in capillarity are fully affected in mice after 7 days when using the current training/detraining paradigm.
Response to acute exercise following detraining
In the current study, we also sought to evaluate the response of these angiogenic regulators following an acute exercise bout as a means to evaluate the effect of detraining on the exercise-inducing stimulus for angiogenesis. As it has been reported that responsiveness of muscle VEGF mRNA (Olfert et al. 2001b) and protein response to acute exercise is lost or blunted with training in rodents and humans (Olfert et al. 2001b; Malek et al. 2010; Hoier et al. 2012; Olenich et al. 2013), this study sought to answer a key question: When would the acute response to exercise return with detraining? Consistent with previous reports, our 21 day voluntary wheel training paradigm resulted in a blunted VEGF protein response to acute exercise in each muscle (Fig. 6). Unexpectedly, in the PLT and most notably in the SOL muscle, the acute VEGF response to exercise was not evident even after 28 days of detraining. This is surprising because an underlying theory for the blunted response of VEGF with training was thought to be linked to training-induced increases in muscle capillaries satisfying and/or relieving the metabolic stress in the working muscle by reducing local tissue hypoxia and/or increasing nutrient delivery (Olfert et al. 2001b, Egginton, 2009; Malek et al. 2010; Audet et al. 2011; Olfert & Birot, 2011). The present finding might argue against this idea and suggest that some other mechanism is attenuating the VEGF response to acute exercise. However, a caveat to this interpretation is that the response to exercise is influenced by exercise intensity and we saw both inter- and intra-group variability with pre- and post-training maximal running speeds in our mice (ranging from 36 to 45 m min−1 pre-training and 42 to 53 m min−1 post-training). Because post-training maximal running speed increased in all mice (Fig. 2), yet the response to acute exercise we tested was at the same absolute speed (20 m min−1) used before training, the relative exercise intensity during the acute exercise challenge was on average 8% lower after training compared to pre-training (i.e. average of all groups relative intensity pre-training was 51% vs. post-training at 43%). However, it seems unlikely that this explains the blunted response to acute exercise because the protein responses we report from our untrained control mice actually corresponds to an average relative exercise intensity of ∼45% to their maximal running speed. As we are comparing and interpreting the post-training responses (which were found to be on average at 43% of the relative exercise intensity across all trained groups) against the untrained controls (exercising at the aforementioned 45% relative intensity), it does not seem probable that the blunted protein responses are due to differences in relative exercise intensity. We would also note that the individual relatively intensities of the post-training groups were 48%, 43%, 38% and 43% for groups D1–D28, respectively. Thus, the strongest argument for differing relative exercise intensities on the blunted protein response would exist for the D14 group (which exhibited a 38% relative exercise intensity post-training vs. the 45% for controls), but in general this group was found to exhibit similar protein expression compared to control responses across the muscle groups (Fig. 6). Thus, we believe our data provide evidence questioning whether training or detraining-induced changes in muscle capillary can alter local tissue hypoxia in a manner that could explain the blunted response protein response we have observed.
In contrast to our data, Malek et al. (2010) report the acute VEGF response to exercise had returned after 7 days of detraining in the PLT and SOL of rats who treadmill trained 3 days a week for 10 weeks. A biological explanation for this discrepancy is not immediately apparent, but it should be noted that there are methodological differences that may hamper a direct comparison between these studies. Malek et al. (2010) used rats whereas we used mice, but more importantly the training regimen was longer in duration and used a lower frequency, but higher exercise intensity (50–80% of maximal work rate). In contrast, our mice voluntarily performed high daily frequency but low intensity exercise (at ∼34–40% of their maximal capacity). It could be that high-volume low-intensity exercise has a different effect on angiogenic regulators than low-volume high-intensity exercise. This idea is supported by recent evidence in humans, where intense, intermittent low-volume exercise has been reported to be a weaker stimulus for angiogenesis than constant moderate intensity exercise (Hoier et al. 2013).
We have previously found that endostatin and nucleolin protein levels were upregulated at 4 h after an exercise bout, but surprisingly this was not the case for endostatin in our untrained control mice in the present study. However, in both the GA and PLT, nucleolin demonstrated a significant time (i.e. group) × acute exercise interaction effect (P < 0.05) with a tendency of elevated response in untrained control mice in all three muscles (Fig. 6). The reason for the difference in endostatin responses between our current data and that previously reported (Olenich et al. 2013) remains unclear. However, given our small study sample size it could be that we have falsely accepted the null hypothesis (i.e. type II statistical error) in cases where there was greater variability in the data (discussed further in the subsequent section on ‘Interpretation and statistical considerations’). On the other hand, it could also question whether endostatin exhibits a significant biological response to acute exercise. As previously noted, endostatin is not a transcriptionally regulated peptide but rather a fragment from collagen XVIII. Thus, the inconsistent endostatin response we observed could be associated with the responses of other factors, such as MMPs, which influence proteolytic activity within the extracellular matrix. Indeed, basal protein expression of MMP-2 and MMP-9 were lowered in D28 mice in concert with decreases in endostatin (Fig. 2), but how this translates to endostatin expression following acute exercise is complicated by the fact that the time course of muscle MMP-2 and MMP-9 in response to acute exercise occurs much later than that for endostatin (Olenich et al. 2013). Therefore, a clear interpretation of the endostatin response to exercise remains limited at this point.
Interpretation and statistical considerations
A potential caveat in the interpretation of TSP-1 and MMP-2 data is that we have previously shown that the peak protein response to acute exercise occurs temporally at 12 h postexercise, and is still evident even up to 24 h after the exercise bout (Olenich et al. 2013). Unfortunately, as those data did not examine the response beyond 24 h, we cannot be certain when TSP-1 or MMP-2 protein levels have returned to baseline. Without knowing when the TSP-1 and MMP-2 protein response to acute exercise returns to baseline after exercise, we unfortunately cannot rule out the possibility that our maximal exercise assessment may have had some residual influence to the basal expression levels of TSP-1 and MMP-2 we report in Figs 5. However, it is tempting to speculate that, as (1) basal levels of TSP-1 and MMP-2 were not different in D1 compared controls, and (2) that there were other observable differences in the responses between the detraining groups (most notably at D7 for TSP-1), whatever effect previous maximal exercise test may have had would have been minimal, if any. Moreover, any effect should have been equally present in all groups and therefore it is unlikely that this would obfuscate or prevent our ability to interpret the respective responses between the detrained groups.
Given that there are several negative findings/responses in this study and that we selected the more conservative Tukey post hoc analyses, this raises the issue of statistical power and the possibility of type II statistical errors. While there is always a trade off in setting α values (to minimize type I errors) and β values (to minimize type II errors), we would simply note that we obtained an average statistical power of 0.88 ± 0.14 (s.d.) associated with the ANOVAs we performed in evaluating basal and acute exercise responses of these angioregulatory factors.
In conclusion, this study demonstrates that physiologic regression of muscle capillaries may be influenced to a greater degree by negative angiogenic regulators (such as TSP-1) rather than positive angiogenic regulators (such as VEGF). We provide additional evidence towards the novel finding the nucleolin is responsive to acute exercise, but that its temporal response is poorly associated with detraining induced capillary regression. Likewise, basal expression of MMP-2, MMP-9 and endostatin are also poorly associated with detraining-related changes in the muscle capillary bed. We also show that the VEGF and nucleolin protein response to acute exercise is blunted – even when muscle capillaries are similar to control levels – suggesting that the number of capillaries in the muscle vascular bed is not the primary determinant blunting the VEGF response to exercise in following training. Future studies will be needed to determine when the acute VEGF response to exercise returns following detraining, while shorter-term detraining studies are needed to identify how soon, with detraining, TSP-1 protein expression starts to increase.
Acknowledgments
None declared.
Glossary
- C/F
capillary-to-fibre ratio
- D
detraining
- GA
gastrocnemius muscle
- GAPDH
glyceraldehyde 3-phosphate dehydrogenase
- MMP (-2, -9)
matrix metalloproteinases
- PLT
plantaris muscle
- SOL
soleus muscle
- TSP-1
thrombospondin-1
- VEGF
vascular endothelial growth factor
Additional information
Competing interests
None declared.
Author contributions
I.M.O. conceived the project and S.A.O. and G.N.A. helped to design and execute the project. S.A.O., G.N.A. and K.A.R. collected the data and conducted the experiments in this study. S.A.O. and I.M.O. participated in writing the manuscript, and all authors contributed in editing and approving the manuscript.
Funding
Funding support was provided, in part by, American Heart Association 10BGIA3630002 (I.M.O.), West Virginia University Research Funding and Development Grant (I.M.O.), West Virginia University Cardiovascular and Respiratory Training Grant NIH 5T32HL090610 (G.N.A.) and WVU-INBRE grant supported by NIH 5P20RR016477 (K.A.R.).
References
- Agah A, Kyriakides TR, Lawler J, Bornstein P. The lack of thrombospondin-1 (TSP1) dictates the course of wound healing in double-TSP1/TSP2-null mice. Am J Pathol. 2002;161:831–839. doi: 10.1016/S0002-9440(10)64243-5. [DOI] [PMC free article] [PubMed] [Google Scholar]
- Audet GN, Meek TH, Garland T, Jr, Olfert IM. Expression of angiogenic regulators and skeletal muscle capillarity in selectively bred high aerobic capacity mice. Exp Physiol. 2011;96:1138–1150. doi: 10.1113/expphysiol.2011.057711. [DOI] [PubMed] [Google Scholar]
- Bausero P, Cavaille F, Meduri G, Freitas S, Perrot-Applanat M. Paracrine action of vascular endothelial growth factor in the human endometrium: production and target sites, and hormonal regulation. Angiogenesis. 1998;2:167–182. doi: 10.1023/a:1009292506879. [DOI] [PubMed] [Google Scholar]
- Birot OJ, Koulmann N, Peinnequin A, Bigard XA. Exercise-induced expression of vascular endothelial growth factor mRNA in rat skeletal muscle is dependent on fibre type. J Physiol. 2003;552:213–221. doi: 10.1113/jphysiol.2003.043026. [DOI] [PMC free article] [PubMed] [Google Scholar]
- Breen EC, Johnson EC, Wagner H, Tseng HM, Sung LA, Wagner PD. Angiogenic growth factor mRNA responses in muscle to a single bout of exercise. J Appl Physiol. 1996;81:355–361. doi: 10.1152/jappl.1996.81.1.355. [DOI] [PubMed] [Google Scholar]
- Carmeli E, Haimovitz T, Nemcovsky EC. Cathepsin D and MMP-9 activity increase following a high intensity exercise in hind limb muscles of young rats. J Basic Clin Physiol Pharmacol. 2007;18:79–86. doi: 10.1515/jbcpp.2007.18.1.79. [DOI] [PubMed] [Google Scholar]
- Christian S, Pilch J, Akerman ME, Porkka K, Laakkonen P, Ruoslahti E. Nucleolin expressed at the cell surface is a marker of endothelial cells in angiogenic blood vessels. J Cell Biol. 2003;163:871–878. doi: 10.1083/jcb.200304132. [DOI] [PMC free article] [PubMed] [Google Scholar]
- Egginton S. Invited review: activity-induced angiogenesis. Pflugers Arch. 2009;457:963–977. doi: 10.1007/s00424-008-0563-9. [DOI] [PubMed] [Google Scholar]
- Gavin TP, Wagner PD. Effect of short-term exercise training on angiogenic growth factor gene responses in rat. J Appl Physiol. 2001;90:1219–1226. doi: 10.1152/jappl.2001.90.4.1219. [DOI] [PubMed] [Google Scholar]
- Gorman JL, Liu S, Slopack D, Shariati K, Olfert IM, Haas TL. Angiotensin II evokes angiogenic signals within skeletal muscle through co-ordinated effects of skeletal myocytes and endothelial cells. PLoS ONE. 2014;9:e85537. doi: 10.1371/journal.pone.0085537. [DOI] [PMC free article] [PubMed] [Google Scholar]
- Gustafsson T, Puntschart A, Kaijser L, Jansson E, Sundberg CJ. Exercise-induced expression of angiogenesis-related transcription and growth factors in human skeletal muscle. Am J Physiol Heart Circ Physiol. 1999;276:H679–H685. doi: 10.1152/ajpheart.1999.276.2.H679. [DOI] [PubMed] [Google Scholar]
- Haas TL, Milkiewicz M, Davis SJ, Zhou AL, Egginton S, Brown MD, Madri JA, Hudlicka O. Matrix metalloproteinase activity is required for activity-induced angiogenesis in rat skeletal muscle. Am J Physiol Heart Circ Physiol. 2000;279:H1540–H1547. doi: 10.1152/ajpheart.2000.279.4.H1540. [DOI] [PubMed] [Google Scholar]
- Hoier B, Nordsborg N, Andersen S, Jensen L, Nybo L, Bangsbo J, Hellsten Y. Pro- and anti-angiogenic factors in human skeletal muscle in response to acute exercise and training. J Physiol. 2012;590:595–606. doi: 10.1113/jphysiol.2011.216135. [DOI] [PMC free article] [PubMed] [Google Scholar]
- Hoier B, Passos M, Bangsbo J, Hellsten Y. Intense intermittent exercise provides weak stimulus for vascular endothelial growth factor secretion and capillary growth in skeletal muscle. Exp Physiol. 2013;98:585–597. doi: 10.1113/expphysiol.2012.067967. [DOI] [PubMed] [Google Scholar]
- Hu W, Xia LJ, Chen FH, Wu FR, Tang J, Chen CZ, Jiang S, Chen HH. Recombinant human endostatin inhibits adjuvant arthritis by down-regulating VEGF expression and suppression of TNF-alpha, IL-1beta production. Inflamm Res. 2012;61:827–835. doi: 10.1007/s00011-012-0477-z. [DOI] [PubMed] [Google Scholar]
- Huang Y, Shi H, Zhou H, Song X, Yuan S, Luo Y. The angiogenic function of nucleolin is mediated by vascular endothelial growth factor and nonmuscle myosin. Blood. 2006;107:3564–3571. doi: 10.1182/blood-2005-07-2961. [DOI] [PubMed] [Google Scholar]
- Hüttemann M, Lee I, Malek MH. (-)Epicatechin Maintains Endurance Training Adaptation in Mice After 14 Days of Detraining. FASEB Journal. 2012;26:1413–1422. doi: 10.1096/fj.11-196154. [DOI] [PMC free article] [PubMed] [Google Scholar]
- Iruela-Arispe ML, Porter P, Bornstein P, Sage EH. Thrombospondin-1, an inhibitor of angiogenesis, is regulated by progesterone in the human endometrium. J Clin Invest. 1996;97:403–412. doi: 10.1172/JCI118429. [DOI] [PMC free article] [PubMed] [Google Scholar]
- Jemiolo B, Trappe S. Single muscle fiber gene expression in human skeletal muscle: validation of internal control with exercise. Biochem Biophys Res Commun. 2004;320:1043–1050. doi: 10.1016/j.bbrc.2004.05.223. [DOI] [PubMed] [Google Scholar]
- Kim YM, Jang JW, Lee OH, Yeon J, Choi EY, Kim KW, Lee ST, Kwon YG. Endostatin inhibits endothelial and tumor cellular invasion by blocking the activation and catalytic activity of matrix metalloproteinase. Cancer Res. 2000;60:5410–5413. [PubMed] [Google Scholar]
- Kim YM, Hwang S, Pyun BJ, Kim TY, Lee ST, Gho YS, Kwon YG. Endostatin blocks vascular endothelial growth factor-mediated signaling via direct interaction with KDR/Flk-1. J Biol Chem. 2002;277:27872–27879. doi: 10.1074/jbc.M202771200. [DOI] [PubMed] [Google Scholar]
- Lapeyre B, Bourbon H, Amalric F. Nucleolin, the major nucleolar protein of growing eukaryotic cells: an unusual protein structure revealed by the nucleotide sequence. Proc Natl Acad Sci U S A. 1987;84:1472–1476. doi: 10.1073/pnas.84.6.1472. [DOI] [PMC free article] [PubMed] [Google Scholar]
- Mahoney DJ, Carey K, Fu MH, Snow R, Cameron-Smith D, Parise G, Tarnopolsky MA. Real-time RT-PCR analysis of housekeeping genes in human skeletal muscle following acute exercise. Physiol Genomics. 2004;18:226–231. doi: 10.1152/physiolgenomics.00067.2004. [DOI] [PubMed] [Google Scholar]
- Malek MH, Olfert IM. Global deletion of thrombospondin-1 increases cardiac and skeletal muscle capillarity and exercise capacity. Exp Physiol. 2009;94:749–760. doi: 10.1113/expphysiol.2008.045989. [DOI] [PubMed] [Google Scholar]
- Malek MH, Olfert IM, Esposito F. Detraining losses of skeletal muscle capillarization are associated with vascular endothelial growth factor protein expression in rats. Exp Physiol. 2010;95:359–368. doi: 10.1113/expphysiol.2009.050369. [DOI] [PubMed] [Google Scholar]
- McKenzie MJ, Goldfarb AH, Kump DS. Gene response of the gastrocnemius and soleus muscles to an acute aerobic run in rats. J Sports Sci Med. 2011;10:385–392. [PMC free article] [PubMed] [Google Scholar]
- Mrazkova O, Grim M, Carlson BM. Enzymatic heterogeneity of the capillary bed of rat skeletal muscles. Am J Anat. 1986;177:141–148. doi: 10.1002/aja.1001770203. [DOI] [PubMed] [Google Scholar]
- Nagase H, Woessner JF., Jr Matrix metalloproteinases. J Biol Chem. 1999;274:21491–21494. doi: 10.1074/jbc.274.31.21491. [DOI] [PubMed] [Google Scholar]
- Olenich SA, Gutierrez-Reed N, Audet GN, Olfert IM. Temporal response of positive and negative angiogenic regulators in response to acute and chronic exercise training in mice. J Physiol. 2013;591:5157–5169. doi: 10.1113/jphysiol.2013.254979. [DOI] [PMC free article] [PubMed] [Google Scholar]
- Olfert IM, Birot O. Importance of anti-angiogenic factors in the regulation of skeletal muscle angiogenesis. Microcirculation. 2011;18:316–330. doi: 10.1111/j.1549-8719.2011.00092.x. [DOI] [PubMed] [Google Scholar]
- Olfert IM, Breen EC, Mathieu-Costello O, Wagner PD. Chronic hypoxia attenuates resting and exercise-induced VEGF, flt-1, and flk-1, mRNA levels in skeletal muscle. J Appl Physiol. 2001a;90:1532–1538. doi: 10.1152/jappl.2001.90.4.1532. [DOI] [PubMed] [Google Scholar]
- Olfert IM, Breen EC, Mathieu-Costello O, Wagner PD. Skeletal muscle capillarity and angiogenic mRNA levels after exercise training in normoxia and chronic hypoxia. J Appl Physiol. 2001b;91:1176–1184. doi: 10.1152/jappl.2001.91.3.1176. [DOI] [PubMed] [Google Scholar]
- Olfert IM, Breen EC, Gavin TP, Wagner PD. Temporal thrombospondin-1 mRNA response in skeletal muscle exposed to acute and chronic exercise. Growth Factors. 2006;24:253–259. doi: 10.1080/08977190601000111. [DOI] [PubMed] [Google Scholar]
- Olfert IM, Howlett RA, Tang K, Dalton ND, Gu Y, Peterson KL, Wagner PD, Breen EC. Muscle-specific VEGF deficiency greatly reduces exercise endurance in mice. J Physiol. 2009;578:1755–1767. doi: 10.1113/jphysiol.2008.164384. [DOI] [PMC free article] [PubMed] [Google Scholar]
- Olfert IM, Howlett RA, Wagner PD, Breen EC. Myocyte vascular endothelial growth factor is required for exercise-induced skeletal muscle angiogenesis. Am J Physiol Regul Integr Comp Physiol. 2010;299:R1059–R1067. doi: 10.1152/ajpregu.00347.2010. [DOI] [PMC free article] [PubMed] [Google Scholar]
- Prior BM, Yang HT, Terjung RL. What makes vessels grow with exercise training. J Appl Physiol. 2004;97:1119–1128. doi: 10.1152/japplphysiol.00035.2004. [DOI] [PubMed] [Google Scholar]
- Richardson RS, Wagner H, Mudaliar SR, Henry R, Noyszewski EA, Wagner PD. Human VEGF gene expression in skeletal muscle: effect of acute normoxic and hypoxic exercise. Am J Physiol Heart Circ Physiol. 1999;277:H2247–H2252. doi: 10.1152/ajpheart.1999.277.6.H2247. [DOI] [PubMed] [Google Scholar]
- Roudier E, Gineste C, Wazna A, Dehghan K, Desplanches D, Birot O. Angio-adaptation in unloaded skeletal muscle: new insights into an early and muscle type-specific dynamic process. J Physiol. 2010;588:4579–4591. doi: 10.1113/jphysiol.2010.193243. [DOI] [PMC free article] [PubMed] [Google Scholar]
- Rullman E, Norrbom J, Stromberg A, Wagsater D, Rundqvist H, Haas T, Gustafsson T. Endurance exercise activates matrix metalloproteinases in human skeletal muscle. J Appl Physiol. 2009;106:804–812. doi: 10.1152/japplphysiol.90872.2008. [DOI] [PubMed] [Google Scholar]
- Shi H, Huang Y, Zhou H, Song X, Yuan S, Fu Y, Luo Y. Nucleolin is a receptor that mediates antiangiogenic and antitumor activity of endostatin. Blood. 2007;110:2899–2906. doi: 10.1182/blood-2007-01-064428. [DOI] [PubMed] [Google Scholar]
- Slater M, Murphy CR. Thrombospondin is sequentially expressed and then de-expressed during early pregnancy in the rat uterus. Histochem J. 1999;31:471–475. doi: 10.1023/a:1003760026681. [DOI] [PubMed] [Google Scholar]
- Song N, Ding Y, Zhuo W, He T, Fu Z, Chen Y, Song X, Fu Y, Luo Y. The nuclear translocation of endostatin is mediated by its receptor nucleolin in endothelial cells. Angiogenesis. 2012;15:697–711. doi: 10.1007/s10456-012-9284-y. [DOI] [PubMed] [Google Scholar]
- Srivastava M, Pollard HB. Molecular dissection of nucleolin's role in growth and cell proliferation: new insights. FASEB J. 1999;13:1911–1922. [PubMed] [Google Scholar]
- Streit M, Velasco P, Riccardi L, Spencer L, Brown LF, Janes L, Lange-Asschenfeldt B, Yano K, Hawighorst T, Iruela-Arispe L, Detmar M. Thrombospondin-1 suppresses wound healing and granulation tissue formation in the skin of transgenic mice. EMBO J. 2000;19:3272–3282. doi: 10.1093/emboj/19.13.3272. [DOI] [PMC free article] [PubMed] [Google Scholar]
- Tang K, Breen EC, Gerber HP, Ferrara NM, Wagner PD. Capillary regression in vascular endothelial growth factor-deficient skeletal muscle. Physiol Genomics. 2004;18:63–69. doi: 10.1152/physiolgenomics.00023.2004. [DOI] [PubMed] [Google Scholar]
- Volpert OV, Pili R, Sikder HA, Nelius T, Zaichuk T, Morris C, Shiflett CB, Devlin MK, Conant K, Alani RM. Id1 regulates angiogenesis through transcriptional repression of thrombospondin-1. Cancer Cell. 2002;2:473–483. doi: 10.1016/s1535-6108(02)00209-x. [DOI] [PubMed] [Google Scholar]
- Waters RE, Rotevatn S, Li P, Annex BH, Yan Z. Voluntary running induces fiber type-specific angiogenesis in mouse skeletal muscle. Am J Physiol Cell Physiol. 2004;287:C1342–C1348. doi: 10.1152/ajpcell.00247.2004. [DOI] [PubMed] [Google Scholar]
- Yamaguchi N, Anand-Apte B, Lee M, Sasaki T, Fukai N, Shapiro R, Que I, Lowik C, Timpl R, Olsen BR. Endostatin inhibits VEGF-induced endothelial cell migration and tumor growth independently of zinc binding. EMBO J. 1999;18:4414–4423. doi: 10.1093/emboj/18.16.4414. [DOI] [PMC free article] [PubMed] [Google Scholar]