

Abstract
The somatosensory functional magnetic resonance imaging (fMRI) response to electrical stimulation of the middle phalange of the second digit of four rats at a spatial resolution of 200 μm cubic at 9.4 T is reported. At high threshold (p<0.002), activated voxels encompass a penetrating vein that passes across the gray matter. These voxels lie mostly in three contiguous slices perpendicular to the pial surface. This activation is assigned to the representation in the forepaw barrel subfield (FBS) of a single cortical column of this phalange. In addition, the activation of the indusium griseum (IG) is visualized robustly. Voxels revealed by fMRI were used to observe functional connectivity to other voxels of the sensorimotor cortex using fcMRI. Results of this experiment were analyzed as a function of decreasing threshold, which exhibited spreading connectivity that revealed S2, M1/M2, and contralateral S1. Noting that every cubic millimeter of tissue contains 125 voxels, connectivity patterns are complex. It is hypothesized that they reflect connections within gray matter by association fibers. S2 and IG revealed connectivities with many voxels across the sensorimotor cortex. These regions also showed subregional variation of connectivity. A 1-cm-diameter surface coil with a local low-noise RF amplifier was used in these studies. The usual region of sensitivity (ROS) of such a coil is 1 cm diameter by 0.5 cm depth. Significant connectivity was observed between time courses of voxels that were within the ROS and voxels that were outside, which extends the volume of tissue that can be observed by the methods of this article.
Key words: : functional connectivity MRI (fcMRI), functional magnetic resonance imaging (fMRI), rat brain anatomy, whisker barrel
Introduction
The vibrissae of the rat are represented in the brain by the whisker barrel cortex. This representation consists of a rectangular array of barrel-shaped neuronal structures that correspond to the arrays of vibrissae. Each barrel contains not only a neuronal apparatus but also a central venule and a central arteriole. The fact that the microcirculation and the neuronal architecture of the whisker barrel have a defined anatomical relationship has made this system a favorite for mechanistic functional magnetic resonance imaging (fMRI) studies (Lu et al., 2005). In rat brain, the representation of the digits is adjacent to that of the vibrissae and is called the forepaw barrel subfield (FBS). This field is organized as a rectilinear array of cortical columns that correspond to the digits and to the phalanges of each digit (Waters et al., 1995).
Duvernoy introduced the concept of a venous unit. In human cortical gray matter, a penetrating vein from the pial surface and perpendicular to it forms a central anatomical feature of the venous unit (Duvernoy et al., 1981). Each penetrating vein is surrounded by lateral veins parallel to the pial surface that feed the penetrating vein with draining blood. These laterals are short near the pial surface and long at depths that correspond to the thickness of the gray matter. This venous array is conical in shape.
It is the working hypothesis that the blood supply for the FBS of the rat is of similar structure to that found by Duvernoy in human brain. Surrounding each penetrating vein is a ring of numerous penetrating arterioles that supply blood to the laterals. The authors now term the combination of veins and arteries that result from the arteriole ring and the corresponding laterals and penetrating vein, the “hemodynamic” unit. It is approximately cylindrical in shape, with the axis of the cylinder matching the penetrating vein and oriented perpendicular to the pial surface.
Moreover, the authors have become convinced that each cortical column of neuronal structure corresponds to a hemodynamic unit. The reading of the whisker barrel literature suggests that this correspondence has long been assumed, but proof was difficult to obtain (Berwick et al., 2002, 2008; Devor et al., 2005). The field of fMRI-driven functional connectivity magnetic resonance imaging (fcMRI) is based on the neuronal–hemodynamic architecture in combination. The authors have imaging tools that permit visualization of neuronal as well as hemodynamic architecture. Electrical stimulation of a single phalange of a single digit reveals an fMRI response in rat brain that matches the cortical columnar structure found by electrophysiological means (Waters et al., 1995). One can see in high-resolution MR images exhibiting venous blood contrast that the fMRI response is centered on a penetrating vein. One can use these activated voxels as seeds to study connectivity with voxels that contain venous laterals. The neuronal–hemodynamic linkage in the microcirculation can be probed in a direct manner in rat brain using voxels that are of the order of 1/10 of the thickness of gray matter. Studies reported here provide new information about the linkage.
To reach the superior resolution in this fMRI study with the current 9.4 Tesla (T) magnet, the authors made several improvements to both hardware and software. Single-shot half k-space gradient-recalled-echo-planar imaging (GR-EPI) BOLD fMRI at 3 T has been applied (Jesmanowicz et al., 1998). These authors obtained good quality fMRI data sets with a matrix of 192×192 over 16×16 cm field of view (FOV). BOLD fMRI in rat brain at a resolution of 156×156×2000 μm (0.049 μL) was achieved at 3 T (Lu et al., 2003). By applying these techniques to rat brain at 9.4 T, the authors have succeeded in acquiring high-quality fMRI and fcMRI data at a resolution of 0.2×0.2×0.2 mm. In addition to improving the signal-to-noise ratio (SNR) by use of 9.4 T, the authors have developed a 1-cm-diameter surface coil with a local low-noise amplifier (LNA), which provides an additional increase of the SNR. A high-order B0 shim coil has further improved the ability to achieve high-resolution images. These technological advances are believed to be critical to acquisition of the data presented here.
The article describes a high-resolution network of brain regions associated with processing the input and the output of a single cortical column of the somatosensory cortex. The authors expect that such a network can be identified for each of the 23 cortical columns of the FBS for each brain hemisphere.
Materials and Methods
Four male Sprague-Dawley rats (SD rats; Charles River Laboratories, Wilmington, MA), weighing 350–400 g, were used in this study. All rats were given free access to food and water and kept in a home cage with 12 h of day–night light alternation for at least 1 week before the experiment.
General surgical protocol
All protocols and procedures were carried out under the guidance of MCW Institutional Animal Care and Use Committee. Dexmedetomidine hydrochloride (DexDomitor, Zoetis, Kalamazoo, MI) used successfully in fMRI studies was used here (Li et al., 2014a, 2014b; Pawela et al., 2009; Weber et al., 2006). The rat was placed supine, and anesthesia was provided by 1% isoflurane vaporized into 30:70% to O2:N2 during the surgery. Isoflurane was tapered off during the fMRI portion of the study, and a continuous subcutaneous infusion of DexDomitor (0.1 mg/kg/h) was used for the maintenance of sedation. The rat was placed on a heated bench and supplied 30:70% to O2:N2.
During fMRI acquisition, pulse oximetry (8600V; Nonin Medical, Plymouth, MN), temperature, respiration rate, and inspired/expired O2 and CO2 (POET IQ2; Criticare Systems, Waukesha, WI) were monitored (WinDaq Pro; DataQ Instruments, Akron, OH) and maintained within normal physiological ranges.
Electrode placement
Figure 1 illustrates an electrode placed on the middle phalange of the second digit of the right forepaw of the rat (which corresponds to the middle finger of the right human hand). A cortical column has been identified by electrophysiological studies as the somatosensory representation of this phalange (Waters et al., 1995).
FIG. 1.

Microelectrode attached to the middle phalange of the second digit of a rat. Electrical stimulation was delivered through this electrode resulting in cortical column functional magnetic resonance imaging (fMRI) activation at 200 μm scale resolution.
Bipolar stainless steel electrodes (150 μm diameter) (Plastics One, Roanoke, VA) were used in this study, modified for improved precision and contact area as shown in Figure 1. Each electrode was tested on the bench before and after placement to ensure that it was in a proper working state. Mild electrical stimulation at 10 Hz frequency, 1 mA current, and 1 ms duration was applied to the finger electrode using a square-pulse electrical stimulator (S88 Square Pulse Stimulator, Grass Telefactor, West Warwick, RI) (Cho et al., 2007). This stimulation intensity is non-noxious (Weber et al., 2006). The authors confirmed the non-noxious stimulation state by physiological monitoring. Throughout the stimulation session, there were no significant changes in respiration rate, core temperature, or heart rate. Each stimulation sequence began with an OFF period of 40 s followed by 10 repetitions of ON for 10 s and OFF for 20 s (total scan time=340 s).
MRI image acquisition
Each rat was placed on a custom-designed cradle fabricated with G-10 fiberglass material, which has a magnetic susceptibility similar to air.
A 9.4 T MRI scanner with a 31-cm horizontal bore (Biospec Avance 94/31; Bruker, Karlsruhe, Germany) was used. The rat was placed in the Bruker linear transmit-coil (T10325) centered 3 mm anterior to the external ear canal. Signal acquisition was performed using the self-designed receiver coil with a local LNA. The coil is a machined copper loop with ID of 10 mm, OD of 10.5 mm, and a height of 2 mm. An American Technical Ceramics (Huntington Station, NY) 800R series, high-Q, nonmagnetic capacitor is soldered directly into a gap cut in the loop. The loop is attached to a Rogers RT/duroid® 5880 low-loss circuit board with 1 ounce copper trace on both sides. A WanTCom (Chanhassen, MN) WMA9RA LNA with an input impedance of 1.5 Ω and an overall gain of 28 dB is silver-epoxied to the circuit board at a distance of 2.5 cm from the coil. This small coil was mounted eccentrically with the coil centered over the left S1FL. A Bruker RT-shim and gradient system (B-GA 12S RT) was used.
High-order shimming was performed before high-resolution functional scans. The surface coil was centered on slice 15. Representative acquisition parameters for the gradient EPI sequence were TE=10.78 ms, TR=2 s, FOV=25.6 mm, slice thickness=0.2 mm, matrix size=128×128. Voxels are cubic 200 μm in each dimension (Hyde et al., 2001).
Susceptibility weighted imaging (SWI) was applied in this study to probe the role of penetrating veins in the neurovascular coupling in the FBS. The resolution of SWI was 100 μm in-plane with a slice thickness of 200 μm. Two sets of SWIs with TE of 16 and 17 ms were acquired from each animal. With 1 ms difference in TE, the authors acquired a B0 field map for every animal and performed further distortion correction.
A half k-space gradient-recalled EPI sequence was used with a bandwidth of 400 kHz (Jesmanowicz et al., 1998). The classic SNR model of BOLD contrast was given by Eq. [1] (Hyde and Biswal, 1999):
where NB, No, NT, and NSC stand, respectively, for physiological noise of BOLD origin, other physiological noise, thermal noise (presumed to be white), and scanner noise arising from system instabilities. Among noise sources, NB, No and possibly NSC are pixel-wise dependent. S0 is different for every pixel. It can be determined by cross-correlation of a pixel time course with a boxcar waveform.
Reconstruction issues associated with partial k-space acquisition were summarized by Margosian (1985) and further modified by Jesmanowicz et al. (1998). The same reconstruction method was used in this study. Although 34 overscan lines were acquired adjacent to line 64, real acquisition begins with line 31 and proceeds to line 128. The information in line 1–30 is calculated through complex conjugate formation of Eq. [2]. Finally, the complex data
 |
are transformed to image space.
Data analysis
Due to the highly refined stimulation, the extremely small voxel size, and intersubject variability, the data cannot be averaged for regular group analysis. EPI scans were registered to an SWI template and displayed on an individual basis. Activation was determined at a p value threshold of 0.002. Voxels were classified as active if the statistic was above threshold and counted as task-activated. Voxel color-coding was determined by the amplitude of the cross-correlation (CC) coefficient. With this method, the degree of brain activation in different functional areas can be quantified by the area (or number) of activated voxels. In this study, there was no global signal regression or smoothing process involved.
The authors define the so-called high threshold as a threshold that approaches a correlation coefficient of 1 in such a manner that the only voxels revealed in response to electrical stimulation are, in fact, those voxels that contain a penetrating vein. Images at high thresholds define laterals that increase in extent with increasing depth, as expected from the Duvernoy model of the venous unit. Resulting fMRI activation extends to a few adjacent slices. Typically, the high threshold is set to reveal between 10 and 20 voxels across two, or perhaps three, slices. These voxels define the penetrating vein.
Using each of these voxels, one-by-one, as a seed voxel for fcMRI and a lower—but still somewhat high—threshold, the authors show a subset of the resulting 10 to 30 possible images for each animal. The amount of data resulting from this single seed-based fcMRI analysis is far too great to display. Based on the fact that the cortex has been well defined into cortical layers and that neurons within the same cortical layer have similar projections and function, the authors performed the high-resolution fcMRI analysis based on cortical layers. Cortical layers are defined as follows: counting from the surface of the cortex, layer I: 0–200 μm; layer II–III: 200–600 μm; layer IV: 600–800 μm; layer V 800–1400 μm; and layer VI: 1400–2000 μm (Defelipe, 2011). Data from layer I were removed from the study because they are on the surface of the cortex close to the air–tissue interface, and EPI results were severely affected. The time courses of seeds within the same layer were averaged to obtain a representative time course that is unique to each cortical layer. To obtain fcMRI information at single voxel level, individual voxels from S1FL, M1/M2, indusium griseum (IG), and S2 areas across all 20 slices that are revealed as connected in fcMRI analysis were numbered for matrix analysis.
Results
Figure 2 shows fMRI results from electrical stimulation of the middle phalange of the second digit of the rat forepaw. The pattern of fMRI activation has been overlaid on an anatomical image. The threshold is high, and only the most strongly activated regions of brain tissue are revealed in this figure. Three regions are identified, one of which is almost certainly the S1FL representation of the stimulated phalange.
FIG. 2.
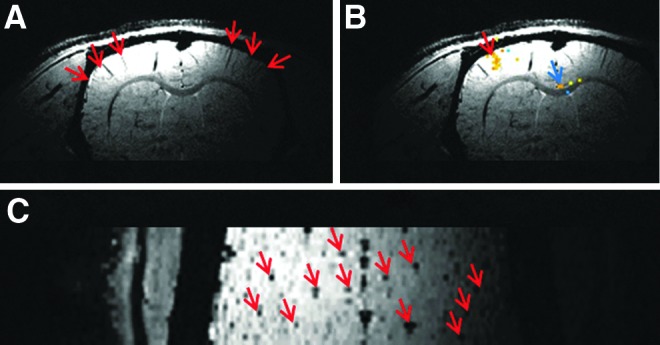
(A) Susceptibility weighted image (SWI) at 200 μm cubic resolution demonstrating penetrating veins (red arrows) in the sensorimotor cortex. (B) Example of BOLD fMRI activation of a single cortical column overlapping with a penetrating vein. The blue arrow points to the activation of the IG nucleus when a single phalange was stimulated. (C) SWI showing penetrating veins (red arrows) passing through the pial surface. These veins mark the centers of venous units in fMRI studies.
Figure 2A is an SWI image with red arrows pointing to penetrating veins, which can be clearly observed in the sensorimotor cortex. In Figure 2B, the response to fMRI activation of the middle phalange at a p value of 0.002 is superimposed on the SWI image without further manipulation of the fMRI data. It is clear that the fMRI activation overlaps with the penetrating vein, which is the anatomical basis of neurovascular coupling in a cortical column. Please also note the small activation area at the center of supracallosal gyrus, deeper toward the cingulate cortex (blue arrow). This structure is assigned to the IG nucleus. Activation of this structure is generally observed when the FBS is activated by rat phalange stimulation under high resolution. Figure 2C is the SWI image viewed from the top of the rat brain. Numerous penetrating veins can be observed (red arrows).
Figure 3 shows fMRI results following single phalange stimulation across all four animals. At 200 μm resolution, BOLD fMRI activation lies in three consecutive slices along the same venous vasculature. A penetrating vein is more or less centered in these voxels. The string of activated voxels seen in the S1FL area is perpendicular to the layers of gray matter. Each of these voxels will serve as a seed for the fcMRI studies described below. This “string” presents an opportunity to investigate layer-specific functional connectivity. As indicated by the red arrows, columnar cortical activation is seen in S1FL area of all animals. Results shown in Figure 3 require both a high threshold and high spatial resolution.
FIG. 3.

fMRI activation from stimulation of a single phalange. For each animal, over 95% of BOLD fMRI-activated voxels are located in three consecutive slices. The columnar fMRI activation in S1FL (red arrows) coincides with penetrating veins and travels across all layers of cortex. IG activation (green arrows) can be seen in all animals, although it occurs in more slices than S1FL activation (p<0.002).
Activation under the conditions of Figure 3 results in displays that are well localized and in accordance with electrophysiological results (Kandel et al., 2000). Green arrows in Figure 3 point to the IG nucleus. The activation of this structure is extremely localized, with 0–3 activated voxels in each slice.
Activated voxels from the fMRI results of Figure 3 were used as seeds for fcMRI analysis as shown in Figure 4. As described previously, the rat primary sensory cortex was divided into six layers, and the first layer was removed. Figure 4A–D shows fcMRI results in representative slices across all animals. An average layer-specific seed was generated for each image. The correlation coefficient value used in this figure is 0.4. The slices may not be identical across animals due to intersubject variation in the fMRI response from which the seeds are created. In addition, the slices may not correspond precisely to the established neuronal-layer numbering system, which is based on histology.
FIG. 4.

Layer-specific fcMRI across four animals. Layer I was not included in the analysis. (A–D) Layer-specific average time courses were formed for each animal from fMRI-activated voxels across all slices. These average time courses were used as seeds for functional connectivity magnetic resonance imaging (fcMRI) analysis. Red, green, and white arrows point to the fcMRI network in S1FL, M1/M2, and S2 areas, respectively. CC=0.4.
Several points can be made from Figure 4. When using seeds from layers II–III of the cortex, the fcMRI network remains local and generally follows the underlying vasculature. Among all cortical layers, layers V and VI are more connected both locally and globally. The widespread fcMRI interhemispheric network is revealed only when seeds from these two layers are used for analysis. The primary sensory network of these two layers (red arrows) forms a columnar pattern and remains overlapping with the underlying penetrating veins in both hemispheres. This phenomenon was observed in all animals in the study. Green arrows point to voxels in the primary/secondary motor cortex. These motor networks emerge when seeds from deep cortical layers are used for analysis (layers IV–VI). White arrows point to the secondary sensory (S2) network, which is observed only when seeds from layer V or VI are used. Although the same threshold (0.4) was used for all images in Figure 4, the extent of the fcMRI networks varied across animals.
The fcMRI images shown in Figure 4 were constructed using averages of waveforms from seed voxels that were layer-specific and exhibited fMRI activation above a selected threshold. Most of the selected waveforms were from voxels that were in three contiguous slices, but waveforms from activated voxels in other slices were also included in the average. It is interesting to study interactions between pairs of voxels since averaging of waveforms suppresses voxel-wise connectivity. The complete pairwise cross-correlation matrix of resting state time courses from voxels defined by fMRI activation with time courses from all voxels in regions S1, S2, M1/M2, and IG, as defined manually, was formed. A representative pairwise cross-correlation matrix is shown in Figure 5, where data have been grouped both by neuronal region and by layer. The authors further filtered out all CC values between −0.4 and 0.4 in this matrix analysis, leaving only the more significant values. A rich pattern of connectivity between voxels of 200 μm cubic dimensions is observed.
FIG. 5.

Single seed-based fcMRI matrix from a single animal organized by layers, lying in neuronally defined regional groups. Voxels were selected in two ways: by fMRI at a p value<0.002 or by the fcMRI method of Figure 4 at a CC value above 0.4. In this individualized analysis, results with CC values between −0.4 and 0.4 are deleted (assigned the color green).
Figure 5 shows that within every region, there are a few voxels that play a dominant role in functional connectivity and there are a few voxels that are weakly connected. The figure shows a few voxels with negative correlation; these are rare. Similar displays have been made for all four animals. Obvious differences among individual voxels within the same region of interest (ROI) can be found in all four animals. The correlation between voxels in one cortical layer and voxels in other cortical layers of the same ROI is not always above the threshold, which results in many blank (green) areas in the matrix. At the high resolution used in this study, the tight correlations between sensory and motor cortex become refined. Sensorimotor network connections become obvious when seeds from deep cortical layers are used for analysis. At the same time, even within the same cortical layer of sensory cortex, only a few voxel time courses are correlated to the motor network.
On the other hand, voxels from the IG nucleus in each animal demonstrate significant connections with voxels from sensory cortex. Overall, the matrix analysis shows a significant amount of variation among voxels in the same ROI (e.g., S1FL).
Although fcMRI network analysis from both layer V and layer VI reveals S2 connectivity, this connectivity appears to involve different voxels in S2. Similarly, neurons in different layers of the primary sensory cortex correlated with different parts of the motor cortex as well. Another interesting finding is that in three out of the four animals, negative correlations between voxels were found. Voxels from the S2 area are commonly involved in this anticorrelated small fcMRI network, which might be related to the complex physiological characteristics of the secondary sensory cortex.
Figure 6 demonstrates the relationship between the degree of connectivity and fcMRI networks. Data from animal 3 were used as an example. fcMRI networks from the same slice are presented at multiple CC threshold values. When seeds from layers II to III are used for analysis, the result is a single ipsilateral S1FL network. This network is not found to be related to other cortical regions even when the CC threshold is lowered to 0.2. Only a few scattered voxels were detected on the contralateral S1FL area. Voxels in this region are fed by the entire venous unit. Tentatively, the authors conclude that the resulting waveform is no longer correlated with discrete neuronal activity.
FIG. 6.
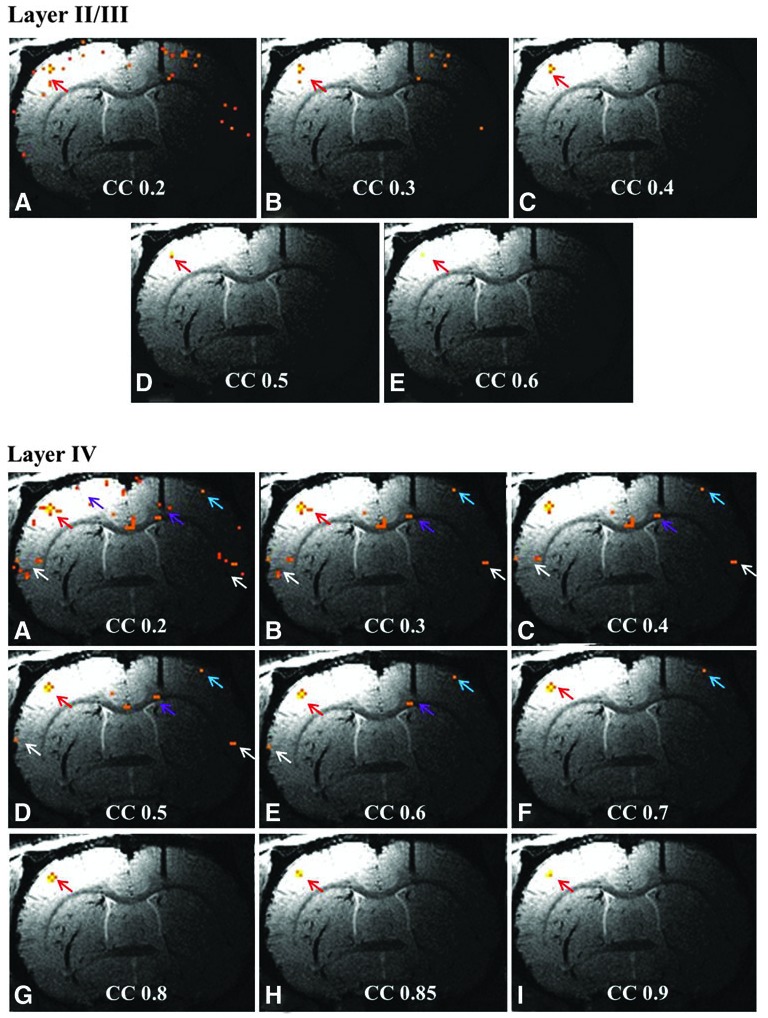

Effect of the CC value on fcMRI networks. Data were obtained from the same slice of rat 3. Letters refer to progressively increasing CC values from 0.2 to 0.9 in 0.05 or 0.1 steps. Red and blue arrows point to the ipsilateral and contralateral S1FL, respectively. Purple arrows point to M1/M2 of both sides and white arrows to the S2 area. The 200 μm scale fcMRI network generally follows the underlying penetrating veins, with each network best seen at a selected CC value. Even at low CC values, information on underlying vasculature can be inferred. It is also apparent that layers V and VI are best connected to other ROIs.
Slightly different observations can be made when fcMRI in cortical layer IV is studied. At a CC value of 0.4, bilateral S1FL, S2, and contralateral motor cortex can be clearly detected. Within these networks, the S1FL network is quite localized. When the CC value is dropped below 0.3, new components inside the S1FL area become visible and branch out from the major fcMRI network. These branches become more obvious as the CC value drops lower. These lateral branches might be related to the vascular structure around the central penetrating vein of the venous unit (Duvernoy et al., 1981). The correlation between sensory and motor cortex remains significant even when the CC value is increased to 0.6 in this animal. However, when the CC value is further increased to 0.7, only an isolated sensory network remains visible in the cortex. From the layer IV seed results, it is clear that the best threshold to study the sensorimotor cortex fcMRI interaction is between CC value of 0.4 and 0.6. If the purpose of the study is to observe the sensory network precisely, the CC value should be raised to 0.7.
Data from layers V to VI are also shown in Figure 6. Results from these two layers are similar to the results from layer IV. Lateral branches of the venous unit start to appear when the CC value is below 0.3. Sensorimotor network interaction remains visible when the CC value is set to the middle range (0.4–0.8 for layer V seed and 0.4–0.7 for layer VI seed). When the CC value is set high, a refined sensory network becomes visible in the cortex. From Figure 6, the authors draw a conclusion that the degree of connectivity is related to the extent of cortical networks. For each network, there exists an optimal CC threshold. However, when the CC value is set low, valuable information on the venous unit and lateral branches can be acquired. The fcMRI sensory network acquired from seeds in the deep brain layer generally follows the penetrating vein structure.
Discussion
In anatomical imaging using a single-turn surface coil, a conventional estimate of the region of sensitivity (ROS) is a cylinder of one coil diameter to a depth of one coil radius, which is called the “near ROS.” It is apparent that the authors have reported data which were obtained with a 1-cm-diameter single-turn loop, which are considerably outside the near ROS. They call this the “far ROS” and have considered the observed far ROS phenomena and enumerate several aspects below.
(1) For block-trial fMRI, cross-correlation of a noiseless block waveform with a somewhat noisy voxel time course obtained from the far ROS can nevertheless lead to a significant value. It is overly restrictive to consider only voxels that lie in the near ROS.
(2) Similarly, for fcMRI using seed analysis, if one member of the pairwise cross-correlation coefficient is obtained in the near ROS where the thermal noise level is low compared with the functional fluctuations, and the other member is obtained from the far ROS where the functional fluctuations are lower, nevertheless, the CC coefficient can be significant.
(3) In both fMRI and fcMRI, data in the far ROS are best observed by systematic variation of the threshold. Data from the far ROS may be less significant because of reduced SNR rather than reduced neuronal activity.
(4) A connectivity matrix has been introduced where each axis contains both single voxels determined by fMRI and single voxels determined by functional connectivity with averaged voxel time courses. The voxels that were determined by fMRI lie in the near ROS. The other voxels were in the far ROS as determined by an fcMRI. See the discussion of Figure 5. Connectivity between single voxels from the near ROS and single voxels that lie in the far ROI is natural to consider when using a surface coil.
(5) It can be hypothesized that connectivity between single voxels in the near ROS of a small coil and regions of voxels that lie in the near ROS of a second large and distant coil would be a useful avenue of research.
The FBS of the rat is adjacent to the whisker barrel field, with each digit represented by a row of cortical columns, and each phalange of each digit represented by a cortical column in the corresponding row, which results in a 4×4 rectangular array of cortical columns for each paw. The representation of the nascent thumb is less regular and the dorsal and volar areas have additional representations (Waters et al., 1995). The FBS extends about 1.5 mm in the anterior–posterior direction and about 1 mm in the lateral direction as determined by electrophysiological and histological means (Chapin and Lin, 1984; Waters et al., 1995; Welker and Woolsey, 1974).
The relationship of the anatomy of the microcirculation in the FBS to the neuronal architecture is less clear than in the whisker barrel cortex. In a series of pioneering studies, Mountcastle (1979, 1997) discovered that the cortex is organized into vertical columns or slabs, 300–600 μm wide, spanning all six layers from the cortical surface to the white matter. Waters and colleagues (1995) described the relationship between the FBS in the SD rat and the representation of the forepaw in layer IV of the rat somatosensory cortex. With ongoing refinement of methodology, many of the columns can be excited one at a time during fMRI scans. In this study, the authors define voxels associated with a single column by high-resolution fMRI scans, and fcMRI is used to probe connectivity of the seed voxel with other single column-defined voxels. Data presented here support the hypothesis that this relationship is well defined.
One can divide fcMRI experiments into two categories: local area functional connectivity and connectivity between regions. Local area functional connectivity can arise from the following mechanisms: (1) interaction through space because of the bulk susceptibility of blood in veins, (2) diffusion of vasomodulators of flow from nearby cortical columns, (3) overlap of lateral veins associated with two or more penetrating veins, and (4) closely spaced regions connected by association fibers. Studies presented here at 200 μm cubic resolution provide some information on mechanisms of local connectivity, although it appears to us that somewhat higher resolution is desirable.
The first mechanism can be probed by the addition of Gd3+ or MION to the blood. There ought to exist, the authors surmise, a concentration of paramagnetic material in blood that provides the best contrast and best resolution. It would follow that lower concentrations would be required for voxels of smaller size. Use of an optimum concentration of paramagnetic material in blood would be an appropriate first step in designing experiments to study local area functional connectivity in greater detail.
A number of fcMRI experiments are described here that involve regions S1, IG, and S2. Task activation—that is, electrical stimulation—establishes that these three regions are part of a brain network. fcMRI studies described here define other regions that belong to the network, although not activated by the particular excitation. One might term this methodology as “fMRI-guided fcMRI.”
The authors report the functional connection between S1FL and IG areas. In human brain, IG is found in the supracallosal gyrus and is made of a thin layer of gray matter. As a continuation of the hippocampus, it receives laminar-specific afferent inputs from the entorhinal cortex, the anterior and posterior piriform cortices, and the supramammillary region (Kunzle, 2004). This region was previously believed to be related to the olfactory system, but few studies have been reported. In this fMRI study, the IG nucleus is observed together with S1FL activation. And in this fcMRI analysis, some of the voxels in the IG area are significantly correlated with primary sensory cortex. With the high spatial resolution employed in this study, not only have the authors detected this small structure but also have probed the pattern of connectivity. IG occupies 0–5 voxels in each slice of this fMRI study. They demonstrated the complexity of the connectivity of voxels of this nucleus with the voxels lying in the sensory network.
A selected seed shows lateral symmetry about the penetrating vein, indicating that the laterals are centered on the penetrating vein. Moreover, no functional connectivity signal is seen between a voxel near the pial surface that is centered on a penetrating vein and a voxel remote from this voxel but still centered on the same vein. This is a remarkable finding. The authors hypothesize that physiological fluctuations observed in a voxel centered on a penetrating vein are determined both by input from upstream blood and by input from lateral vessels of the microcirculation. These dual inputs affect the resultant resting-state waveform of that voxel. This hypothesis provides a model for layer-specific functional connectivity. Study of fcMRI images as a function of threshold allows us to probe layer-specific connectivity.
Figure 4 shows that the degree of connectivity is variable between cortical layers. Cortical layers II–III have a higher connectivity with layers V and VI but are less connected with layer IV. Interhemispheric connectivity in the sensory–motor network is observed when seeds from deep cortical layers are used. There have been several previous fMRI studies in the whisker barrel cortex that contribute to the understanding of the present work in the FBS (Lu et al., 2004; Pelled and Goelman, 2004; Yu et al., 2012).
Figure 5 is the first effort to demonstrate fcMRI between single voxels at the 200 μm scale level. In conventional fcMRI studies at, for example, 3 mm cubic, there are in each voxel, 3375 voxels of 200 μm cubic dimensions. The 3 mm cubic voxels are treated as single, uniform functional volumes that make contributions to specific fcMRI network. In the present work, the authors found that there are significant differences between individual voxels even when these voxels are in the same region of a layer-specific fcMRI network. Moreover, the resting-state time courses of only a subset of these 200 μm cubic voxels are correlated with each other. Averaging of time courses that occurs in 3 mm cubic voxels can be expected to decrease the CC values.
The methodology of Figure 6 where resting-state images are formed as a function of the CC value is recommended. As the CC threshold was lowered, layer-specific connectivity was observed to spread first to nearby voxels, then into motor areas, and finally into the contralateral representation of the matching phalange and digit of the opposite forepaw. The authors presume that the experiment of Figure 6 is probing connectivity that arises from association fibers. Although not emphasized here, the concept of “Degree of Connectivity” can be used to discuss the results of Figure 6. An alternative approach would be to study images formed by CC values that lie between a preset upper limit and a preset lower limit.
The small surface coil used in this work is a key to achieve 200 μm cubic voxels. A consequence of using this coil is that the sensitivity varies across the ROI. There seems to be no alternative to the analysis of functional connectivity results by systematic variation of the threshold as illustrated in Figure 6.
Resting-state fluctuations across the sensorimotor representation of the digits that were probed here were found to have greater synchrony between pairs of voxels that were within layers rather than between layers. Connectivity was particularly strong in layers V–VI, consistent with known physiology studies (Feldmeyer et al., 2013; Petreanu et al., 2007). It also leads to the conclusion that resting-state fluctuations in BOLD contrast from lateral vessels of the microcirculation that feed a given penetrating vein, and are in different layers, are not highly synchronous.
Experiments across animals reveal similar patterns, but there are differences. Pooling of data across animals does not seem possible thus far. The authors are able to distinguish patterns from adjacent phalanges of the same digit and from adjacent digits. Digit 2 presents a particular problem that seems to arise from the fact that it is fed by both ulnar and median nerves. The representation of this digit always contains more voxels, and venography seems to reveal a divided or split penetrating vein.
Conclusion
Major conclusions of this study are as follows. (1) These results indicate that S2 is a special region in the sensory pathway. Three out of the four animals in this study exhibited a few voxels with waveforms that were anticorrelated with other voxel waveforms in this matrix study (Figure 5). (2) These results also indicate that IG is functionally correlated with a widespread sensorimotor network. Moreover, the degree of connectivity with the somatosensory network seems to vary across the voxels of this nucleus. (3) The authors found that fcMRI networks are customized to each individual animal at 200 μm cubic resolution. Location, size, and the CC values of the networks can be quite different from animal to animal. Conventional group analysis does not seem to be appropriate. The method of fMRI-guided fcMRI used in this article can provide a certain level of control of fcMRI studies across animals. (4) Within the cortical layers, voxel time courses obtained at high resolution can have high CC values, as shown in Figure 5. Electrical stimulation of the individual phalanges of the individual digits of the rat in combination with BOLD contrast fMRI and fcMRI of the representation of these digits, in the part of the somatosensory cortex known as the FBS, at 200 μm cubic resolution has been introduced in this article. A general hypothesis of the work is that the model can be used in a wide variety of future studies.
Acknowledgment
This work was supported by grant EB000215 from the National Institutes of Health.
Author Disclosure Statement
No competing financial interests exist.
References
- Berwick J, Johnston D, Jones M, Martindale J, Martin C, Kennerley AJ, et al. 2008. Fine detail of neurovascular coupling revealed by spatiotemporal analysis of the hemodynamic response to single whisker stimulation in rat barrel cortex. J Neurophysiol 99:787–798 [DOI] [PMC free article] [PubMed] [Google Scholar]
- Berwick J, Martin C, Martindale J, Jones M, Johnston D, Zheng Y, et al. 2002. Hemodynamic response in the unanesthetized rat: intrinsic optical imaging and spectroscopy of the barrel cortex. J Cereb Blood Flow Metab 22:670–679 [DOI] [PubMed] [Google Scholar]
- Chapin JK, Lin CS. 1984. Mapping the body representation in the SI cortex of anesthetized and awake rats. J Comp Neurol 229:199–213 [DOI] [PubMed] [Google Scholar]
- Cho YR, Pawela CP, Li R, Kao D. 2007. Schulte ML, Runquist ML, Yan JG, Matloub HS, Jaradeh SS, Hudetz AG, Hyde JS. Refining the sensory and motor ratunculus of the rat upper extremity using fMRI and direct nerve stimulation. Magn Reson Med 58:901–909 [DOI] [PMC free article] [PubMed] [Google Scholar]
- Defelipe J. 2011. The evolution of the brain, the human nature of cortical circuits, and intellectual creativity. Front Neuroanat 5:1–17 [DOI] [PMC free article] [PubMed] [Google Scholar]
- Devor A, Ulbert I, Dunn AK, Narayanan SN, Jones SR, Andermann ML, et al. 2005. Coupling of the cortical hemodynamic response to cortical and thalamic neuronal activity. Proc Natl Acad Sci USA 102:3822–3827 [DOI] [PMC free article] [PubMed] [Google Scholar]
- Duvernoy HM, Delon S, Vannson JL. 1981. Cortical blood vessels of the human brain. Brain Res Bull 7:519–579 [DOI] [PubMed] [Google Scholar]
- Feldmeyer D, Brecht M, Helmchen F, Petersen CC, Poulet JF, Staiger JF, et al. 2013. Barrel cortex function. Prog Neurobiol 103:3–27 [DOI] [PubMed] [Google Scholar]
- Hyde JS, Biswal BB. 1999. Functionally related correlation in the noise. In: Moonen CTW, Bandettini PA. (eds.), Medical Radiology, Diagnostic Imaging and Radiation Oncology: Functional MRI. Berlin: Springer-Verlag, pp. 263–275 [Google Scholar]
- Hyde JS, Biswal BB, Jesmanowicz A. 2001. High-resolution fMRI using multislice partial k-space GR-EPI with cubic voxels. Magn Reson Med 46:114–125 [DOI] [PubMed] [Google Scholar]
- Jesmanowicz A, Bandettini PA, Hyde JS. 1998. Single-shot half k-space high-resolution gradient-recalled EPI for fMRI at 3 Tesla. Magn Reson Med 40:754–762 [DOI] [PubMed] [Google Scholar]
- Kandel ER, Schwartz JH, Jessell TM. 2000. Principles of Neural Science. Fourth Ed. New York, NY: McGraw-Hill, pp. 452–468 [Google Scholar]
- Kunzle H. 2004. The hippocampal continuation (indusium griseum): its connectivity in the hedgehog tenrec and its status within the hippocampal formation of higher vertebrates. Anat Embryol 208:183–213 [DOI] [PubMed] [Google Scholar]
- Li R, Hettinger PC, Liu X, Machol JA, Yan JG, Matloub HS, et al. 2014a. Early evaluation of nerve regeneration after nerve injury and repair using functional connectivity MRI. Neurorehabil Neural Repair 28:707–715 [DOI] [PMC free article] [PubMed] [Google Scholar]
- Li R, Machol JA, Liu X, Hettinger PC, Flugstad NA, Yan JG, et al. 2014b. C7 nerve root sensory distribution in peripheral nerves: a bold functional magnetic resonance imaging investigation at 9.4 T. Muscle Nerve 49:40–46 [DOI] [PMC free article] [PubMed] [Google Scholar]
- Lu H, Mazaheri Y, Zhang R, Jesmanowicz A, Hyde JS. 2003. Multishot partial-k-space EPI for high-resolution fMRI demonstrated in a rat whisker barrel stimulation model at 3T. Magn Reson Med 50:1215–1222 [DOI] [PubMed] [Google Scholar]
- Lu H, Patel S, Luo F, Li SJ, Hillard CJ, Ward BD, et al. 2004. Spatial correlations of laminar BOLD and CBV responses to rat whisker stimulation with neuronal activity localized by FOS expression. Magn Reson Med 52:1060–1068 [DOI] [PubMed] [Google Scholar]
- Lu H, Soltysik DA, Ward BD, Hyde JS. 2005. Temporal evolution of the CBV-fMRI signal to rat whisker stimulation of variable duration and intensity: a linearity analysis. Neuroimage 26:432–440 [DOI] [PubMed] [Google Scholar]
- Margosian P. Faster MR Imaging: Imaging with Half the Data. In Proceedings of 4th Annual Meeting of SMRM, London, UK, 1985, pp. 1024–1025 [Google Scholar]
- Mountcastle VB. 1979. An organizing principle for cerebral function: the unit module and the distributed system. In: Schmitt FO, Worden F. (eds.) Neuroscience, Fourth Study Program. Cambridge, MA: MIT Press, pp. 15–30 [Google Scholar]
- Mountcastle VB. 1997. The columnar organization of the neocortex. Brain 120:701–722 [DOI] [PubMed] [Google Scholar]
- Pawela CP, Biswal BB, Hudetz AG, Schulte ML, Li R, Jones SR, et al. 2009. A protocol for use of medetomidine anesthesia in rats for extended studies using task-induced BOLD contrast and resting-state functional connectivity. Neuroimage 46:1137–1147 [DOI] [PMC free article] [PubMed] [Google Scholar]
- Pelled G, Goelman G. 2004. Different physiological MRI noise between cortical layers. Magn Reson Med 52:913–916 [DOI] [PubMed] [Google Scholar]
- Petreanu L, Huber D, Sobczyk A, Svoboda K. 2007. Channelrhodopsin-2-assisted circuit mapping of long-range callosal projections. Nat Neurosci 10:663–668 [DOI] [PubMed] [Google Scholar]
- Waters RS, Li CX, McCandlish CA. 1995. Relationship between the organization of the forepaw barrel subfield and the representation of the forepaw in layer IV of rat somatosensory cortex. Exp Brain Res 103:183–197 [DOI] [PubMed] [Google Scholar]
- Weber R, Ramos-Cabrer P, Wiedermann D, van Camp N, Hoehn M. 2006. A fully noninvasive and robust experimental protocol for longitudinal fMRI studies in the rat. Neuroimage 29:1303–1310 [DOI] [PubMed] [Google Scholar]
- Welker C, Woolsey TA. 1974. Structure of layer IV in the somatosensory neocortex of the rat: description and comparison with the mouse. J Comp Neurol 158:437–453 [DOI] [PubMed] [Google Scholar]
- Yu X, Glen D, Wang S, Dodd S, Hirano Y, Saad Z, et al. 2012. Direct imaging of macrovascular and microvascular contributions to BOLD fMRI in layers IV-V of the rat whisker-barrel cortex. Neuroimage 59:1451–1460 [DOI] [PMC free article] [PubMed] [Google Scholar]