

Abstract
Subtle changes in motor function have been observed in individuals with prodromal Huntington disease (prHD), but the underlying neural mechanisms are not well understood nor is the cumulative effect of the disease (disease burden) on functional connectivity. The present study examined the resting-state functional magnetic resonance imaging (rs-fMRI) connectivity of the primary motor cortex (M1) in 16 gene-negative (NEG) controls and 48 gene-positive prHD participants with various levels of disease burden. The results showed that the strength of the left M1 connectivity with the ipsilateral M1 and somatosensory areas decreased as disease burden increased and correlated with motor symptoms. Weakened M1 connectivity within the motor areas was also associated with abnormalities in long-range connections that evolved with disease burden. In this study, M1 connectivity was decreased with visual centers (bilateral cuneus), but increased with a hub of the default mode network (DMN; posterior cingulate cortex). Changes in connectivity measures were associated with worse performance on measures of cognitive–motor functioning. Short- and long-range functional connectivity disturbances were also associated with volume loss in the basal ganglia, suggesting that weakened M1 connectivity is partly a manifestation of striatal atrophy. Altogether, the results indicate that the prodromal phase of HD is associated with abnormal interhemispheric interactions among motor areas and disturbances in the connectivity of M1 with visual centers and the DMN. These changes may, respectively, contribute to increased motor symptoms, visuomotor integration problems, and deficits in the executive control of movement as individuals approach a manifest diagnosis.
Key words: : functional connectivity, Huntington disease, motor cortex, motor system, seed voxel analysis
Introduction
Huntington disease (HD) is an inherited neurodegenerative disorder caused by a cytosine-adenine-guanine (CAG) trinucleotide expansion on chromosome 4. Larger CAG expansions are associated with earlier disease onset, as diagnosed by the presence of motor symptoms that are unequivocal signs of HD (Duyao et al., 1993). Individuals who meet the genetic criteria for HD, but do not yet show unequivocal motor signs (HSG, 1996), are in the prodromal phase (prHD). Multiple studies have reported subtle motor, cognitive, and psychiatric symptoms, corticostriatal atrophy, and altered activation of various brain regions, which often progress as individuals approach a diagnosis (Aylward et al., 2004; Harrington et al., 2012; Nopoulos et al., 2010; Paulsen et al., 2004, 2008, 2010; Rao et al., 2014; Rosas et al., 2005; Stout et al., 2011; Wolf et al., 2007).
Subtle motor symptoms during the prodromal stage (ocular motor, chorea, bradykinesia, dystonia, and rigidity) are of considerable interest as the total motor symptom score on the Unified Huntington's Disease Rating Scale (UHDRS) is the most sensitive marker of disease progression, following striatal atrophy (Long et al., 2014; Paulsen et al., 2014). The performance on cognitive tasks that contain a significant motor component (e.g., movement sequencing, motor timing, circle tracing, antisaccades) also declines as proximity to diagnosis nears (Antoniades et al., 2010; Georgiou-Karistianis et al., 2014; Hinton et al., 2007; Kirkwood et al., 1999; Paulsen et al., 2004; Rowe et al., 2010; Say et al., 2011; Scahill et al., 2013). A key component of the motor network, the precentral gyrus, has emerged as a region of interest (ROI), owing to the structural and functional changes in prHD that are often associated with motor dysfunction. In manifest HD, cell loss in the precentral gyrus is related to measures of motor dysfunction (Thu et al., 2010). Early HD and prHD participants show a loss in precentral gyrus gray matter, which is related to tongue force variability (Scahill et al., 2013), and greater disturbances in white matter tracks underlying the precentral gyrus are associated with an earlier estimated time-to-onset (Dumas et al., 2012). Functional changes in the precentral gyrus during the performance of timed movements have also been reported in individuals far from a manifest diagnosis, despite an absence of deficits in task performance (Zimbelman et al., 2007).
Given the propensity for structural and functional changes in the motor system during the prodromal disease stage, it is desirable to obtain more precise measures of the intrinsic organization of motor areas as a function of genetic burden. Blood oxygen level-dependent resting-state functional magnetic resonance imaging (rs-fMRI) has been used to examine functional connectivity patterns in healthy adults and in various diseases. Network-based approaches using independent component analysis have measured the spatiotemporal dynamics of synchronization within sensorimotor resting-state networks in HD. In manifest HD, resting-state connectivity within the motor network increased as motor symptoms increased (Werner et al., 2014). In prHD, decreased synchronization within the sensorimotor system, localized to the primary motor area (M1), was found in one study (Poudel et al., 2014), but not another (Dumas et al., 2013). Other studies have reported weakened connectivity of M1 and/or premotor areas with classic motor areas (caudate) (Unschuld et al., 2012b) and the medial visual network (Dumas et al., 2013).
Discrepant findings among studies may relate to the use of different analytic techniques. However, even when studies use similar methods, considerable heterogeneity may be introduced when including prHD individuals with different degrees of genetic burden. Previous studies using task-activated and rs-fMRI have demonstrated that functional abnormalities partly depend on genetic burden (Paulsen et al., 2004; Rao et al., 2014; Wolf et al., 2008; Zimbelman et al., 2007). The current study used a seed-based approach to investigate whole-brain resting-state connectivity of the left M1 in 48 prHD participants, stratified into three groups based on genetic burden, and 16 gene-negative controls. The seed for the left M1 was derived from a task-activated fMRI study of paced tapping with the right index finger. The authors examined the relationship between M1 connectivity and genetic burden, motor and cognitive symptoms, and striatal atrophy. They hypothesized that the patterns of rs-fMRI connectivity would evolve with increasing genetic burden.
Materials and Methods
Sample
Data were collected at two PREDICT-HD sites, the Cleveland Clinic and the University of Iowa. The ethics committees at both sites approved the study procedures, which were performed in accordance with ethical guidelines in the 1964 Declaration of Helsinki. Participants provided written informed consent and completed genetic testing for the CAG expansion before and independent from entry into PREDICT-HD. Confirmatory DNA testing was conducted on all participants by PREDICT-HD. A certified examiner performed the UHDRS (HSG, 1996), which contains 31 items that assess chorea, bradykinesia, rigidity, dystonia, and oculomotor function on a five-point scale (0=normal; 4=greatest impairment). The total motor score (TMS) is the sum of these items. Examiners rated their confidence level that participant's signs were an indication of HD, and participants were excluded if they had a diagnostic confidence level=4 (≥99% confidence of unequivocal signs of HD) at the time of entry into the study. Additional exclusion criteria included clinical evidence of unstable medical or psychiatric illness, use of prescription antipsychotic medications within the past 6 months, use of phenothiazine-derivative antiemetic medications more than three times per month, alcohol or drug abuse within the past year, learning or developmental disability, history of another neurological condition, or an inability to undergo MRI scanning.
Participants were selected from a larger dataset that had been screened for motion using visual inspection of the rs-fMRI time series and subsequent correlation maps. Inspection included assessment of head movements during the time series and potential motion-related artifacts such as rings of correlation around the outside of the head, correlation in the ventricles, and rapid correlation pattern changes from slice to slice. Thirty-two healthy gene-negative controls (NEG group) and 52 prHD participants with useable rs-fMRI scans were identified. Control participants had a parent with HD, but did not have the expanded CAG gene. The CAG-age product (CAP) score was used to stratify prHD participants based on their 5-year probability of a diagnosis. The CAP score is a proxy for time to diagnosis (Zhang et al., 2011) and is computed as follows:
CAP=(age at time of scanning)×(CAG repeat length − 33.66)
Cutoffs for the three CAP groups were based on an optimization algorithm using the PREDICT-HD participants in the larger cohort (n>1,000). The 5-year probability of diagnosis was <0.67 in the low group (LOW), 0.67–0.85 in the medium group (MED), and >0.85 in the high group (HIGH). Of the 52 prHD participants, 16 were included in the LOW group, 17 in the MED group, and 19 in the HIGH group.
The final sample was selected to minimize group differences in age while keeping the sample size equal. All 16 participants were included in the LOW group. An analysis of variance (ANOVA) showed that the 32 gene-negative controls and the participants in the HIGH group were significantly older than both the LOW and MED groups (p<3×10⁻⁷). To minimize age differences, the youngest participant was excluded from the MED group, the 3 oldest subjects were excluded from the HIGH group, and the 16 oldest subjects were excluded from the NEG group.
Cognitive measures
Participants were administered tests of cognitive-motor functioning, including the Trail Making Test (Parts A and B; time to completion), a measure of cognitive flexibility (Reitan, 1958), the Stroop Color-Word Interference task (Golden and Freshwater, 2002), the Symbol Digit Modalities Task (SDMT) (Smith, 1991), and the time reproduction task (TRT), a measure of temporal processing (Rao et al., 1997). For the TRT, the subject tapped with his or her right index finger in synchrony to a tone at fixed pace of 600 msec for 24 sec, after which tapping continued at the same pace without the tone for another 24 sec. The reciprocal of SD of the intertrial interval was the measure of timing precision.
MR imaging
At both sites, participants were scanned using a 12-channel receive-only head coil on a Siemens TIM Trio 3T MRI scanner. Site comparability was ensured through comparison of phantom data acquired throughout the duration of the study. The protocol included the following scans: (1) A whole-brain T1 MPRAGE: 240 coronal slices; thickness 1 mm; FOV 256×240 mm; TI/TE/TR/flip angle, 900/3.04/2530 msec/10°; matrix 256×128; BW 220 kHz, voxel size=1×1×1 mm. (2) A TRT: two runs of 145 repetitions, thirty-one 4.5-mm-thick axial slices (no gap); matrix 128×128; in-plane resolution 2×2 mm; TE/TR/flip angle, 29/2800 msec/80°; FOV 256×256 mm; BW 1954 Hz/pixel. (3) A whole-brain rs-fMRI study, with eyes closed: 132 repetitions, thirty-one 4.5-mm-thick axial slices (no gap); matrix 128×128; in-plane resolution 2×2 mm; TE/TR/flip angle, 29/2800 msec/80°; FOV 256×256 mm; BW 1954 Hz/pixel.
Image postprocessing
Postprocessing of the rs-fMRI data included the removal of the first four volumes of the time series. Physiologic noise was estimated using PESTICA (Beall and Lowe, 2007) and was regressed out at the voxel level using RETROICOR (Glover et al., 2000). The AFNI program 3dvolreg was used to retrospectively correct volumetric-level motion (Cox, 1996). Signal fluctuations corresponding to voxel-level displacement were identified using the output from 3dvolreg and regressed (Bullmore et al., 1999). The data were spatially filtered using a Hamming filter (Lowe and Sorenson, 1997), fluctuations above 0.08 Hz were removed, and the data were smoothed using a 6 mm kernel (Cox, 1996). Postprocessing of the TRT fMRI data included the removal of the first 4 volumes of the time series. The remaining volumes were time shifted, motion corrected, and spatially filtered. The two runs were combined, and the AFNI program 3dDeconvolve was used to perform a deconvolution analysis (Cox, 1996). The TRT task has two conditions, synchronization and continuation, set up in a block design. Student's t maps were calculated for each condition and converted to z-scores. Both functional scans were aligned to the anatomical volume using the AFNI program align_epi_anat.py (Saad et al., 2009).
Volumetric analysis
To assess the impact of structural brain changes, the total white matter volume, total cortical and subcortical gray matter volume, and the volumes of the bilateral caudate, thalamus, globus pallidus, and putamen were estimated using the MPRAGE in Freesurfer (Freesurfer, 2011). Freesurfer was also used to estimate cortical thickness at each of the regions included in the rs-fMRI analysis described below. To correct for variations in head size, volumetric measures were divided by the intracranial volume and then multiplied by 100. Group differences in measures of volume and cortical thickness were tested using an analysis of covariance (ANCOVA), with age as a covariate. The false discovery rate (FDR) was used to adjust for multiple comparisons. Post hoc pairwise comparisons between the NEG group and each prHD group used Tukey's honestly significant difference criterion.
Seed selection and rs-fMRI analysis
The synchronization condition of the TRT was used to guide selection of the seed for the rs-fMRI analysis. Individual activation maps were transferred to common space using an affine transformation to the Talairach template (Cox, 1996). Average activation during the synchronization condition was calculated for all gene-negative participants and thresholded at p=1×10⁻⁴ with a cluster size of 230. A manually drawn ROI was placed at the region of peak activation in left M1 (centered at [−35 −24 51]) and transferred from common space to the original rs-fMRI space for each participant (Fig. 1).
FIG. 1.

Group-averaged rs-fMRI maps of left M1. Regions mapped in color show significant functional connectivity to left M1 (z-score*100, p<1×10⁻⁴, cluster size 230). The TRT-activated left M1 ROI is represented on each group map in blue.
A large seed ROI transferred from common space will often capture voxels unrelated to the ROI. To ensure the resulting ROIs would reflect motor connectivity, each dataset was individually checked using the AFNI tool InstaCorr (Cox and Saad, 2010). This tool can be used to instantaneously create individual rs-fMRI maps based on a given seed voxel. For each participant, InstaCorr was used to manually select the left M1 voxel within the TRT-activated ROI that had the highest correlation with traditional motor regions, including the supplementary motor area (SMA) and the right M1. A nine-voxel in-plane ROI was centered at that voxel and served as the seed voxel for the rs-fMRI analysis. For each dataset, a resting-state reference time series was produced by taking the linearly detrended average time series of the nine-voxel left M1 ROI. For the whole brain, a cross correlation was calculated between the linearly detrended resting-state time series of each voxel and the reference time series (MATLAB, 2012). The correlation was converted to a Student's t, and the distribution was normalized to unit variance and zero mean (Lowe et al., 1998). The result is a whole-brain z-scored connectivity map that indicates the strength of left M1 connectivity with other brain regions.
To investigate differences in rs-fMRI within the primary motor network, regions that were significantly related to the left M1 were compared across the LOW, MED, HIGH, and NEG groups. Within each group, individual connectivity maps were transferred to Talairach space and averaged (Fig. 1). The four resulting group maps were thresholded at p=1×10⁻⁴ with a cluster size of 230 and added to create a disjunction mask, so that a region showing significant connectivity to the left M1 in any one of the groups was included in the mask. Spheres of 6 mm were placed in each region at the point of peak connectivity to the left M1 (Fig. 2). This disjunction mask represented all regions that showed significant connectivity to left M1.
FIG. 2.

Upper panel: Red and purple regions demonstrate significant connectivity with the left M1 (shown in blue). Significant group differences were found in the strength of connectivity with regions shown in purple, namely the right cuneus, precentral gyrus, and postcentral gyrus. Lower panel: Bar graphs display the mean (standard error) age-adjusted z-scores in the three regions for which a significant main effect of group was found. Horizontal brackets indicate significant post-hoc pairwise group differences.
To assess group differences, the disjunction mask was transferred to rs-fMRI space for each subject. For a given ROI, mean connectivity within the ROI was calculated. Group differences in mean connectivity were tested using an ANCOVA, with age as a covariate. Age-adjusted partial correlations were used to examine the relationship between mean connectivity within each ROI and disease burden (measured by CAP score) and motor symptoms (TMS from the UHDRS) in the 48 gene-positive participants. To assess the relationship between measures of connectivity and behavioral measures, correlations tested for associations between age-adjusted mean connectivity in ROIs that showed significant group differences or significantly correlated with the CAP score and age- and education-adjusted residual scores on the Trail Making Test (Trails B, Trails B-A), the TRT task (timing precision), the Stroop test (Stroop Color, Stroop Interference), and the SDMT (total number correct). The FDR was used as a control for multiple comparisons.
An additional analysis was conducted to more fully investigate the relationship between M1 connectivity and disease burden, focusing on the 48 gene-positive participants and used CAP score as a continuous measure of disease burden. For this voxelwise analysis, the left M1 whole-brain connectivity maps of the 48 gene-positive participants were transferred to common space. The strength of connectivity at a given voxel for the 48 prHD participants was entered into a partial correlation with CAP, using age as a covariate. The result was a whole-brain voxelwise map showing the relationship between the CAP score and the strength of regional connectivity with left M1.
Results
Demographics and behavioral data
Table 1 details group comparisons of demographic, disease characteristics, and behavioral variables. Group comparisons for continuous variables were conducted using an ANOVA, followed by post hoc comparisons using Tukey's honestly significant difference criterion. Categorical variables were evaluated using a chi-square test. The LOW group was significantly younger than both the NEG and HIGH groups (p<0.002). Differences in age among the gene-positive groups were expected, as the groups were created using the CAP score, a variable partially determined by age. The HIGH group was slightly less educated than the NEG group (p=0.047) and showed significantly more motor symptoms on the UHDRS than all other groups (p<0.001). Sex and scanning location did not show group differences.
Table 1.
Mean (Standard Deviation) of Demographics, Disease Characteristics, and Behavioral Measures for the Negative, Low, Medium, and High Groups
| NEG n=16 | LOW n=16 | MED n=16 | HIGH n=16 | p | Post hocs | |
|---|---|---|---|---|---|---|
| Demographics | ||||||
| Age (years) | 42.9 (9.2) | 32.9 (9.2) | 39.9 (9.7) | 47.6 (12.6) | 0.002 | Low<Neg, High |
| Education (years) | 16.0 (1.9) | 14.4 (2.2) | 15.3 (2.5) | 13.9 (2.4) | 0.047 | High<Neg |
| Sex (% male) | 4 (25) | 1 (6.3) | 5 (31.3) | 2 (12.5) | 0.251 | |
| Location scanned (CC/UI) | 4/12 | 7/9 | 10/6 | 7/9 | 0.206 | |
| Disease characteristics | ||||||
| CAG | — | 41.8 (1.9) | 42.6 (2.6) | 43.6 (3.2) | 0.138 | |
| CAP score | — | 251.9 (30.2) | 332.3 (18.5) | 439.0 (45.5) | <0.001 | Low<Med<High |
| UHDRS motor score | 5.1 (4.5) | 3.5 (3.8) | 4.9 (4.4) | 13.4 (7.8) | <0.001 | Neg, Low, Med<High |
| Behavioral measures | ||||||
| SDMT | 61.0 (9.8) | 56.4 (10.4) | 56.8 (9.7) | 47.8 (10.6) | 0.002 | High<Neg, Med |
| Stroop color | 88.2 (15.10) | 84.4 (10.6) | 83.1 (10.6) | 68.9 (14.2) | <0.001 | High<Neg, Low, Med |
| Stroop word | 110.3 (19.8) | 107.1 (12.4) | 105.8 (16.1) | 84.4 (19.7) | <0.001 | High<Neg, Low, Med |
| Stroop interference | 51.4 (9.8) | 51.4 (12.8) | 52.4 (11.2) | 40.2 (10.6) | 0.006 | High<Neg, Low, Med |
| Trails A | 19.6 (4.3) | 23.7 (7.9) | 21.4 (8.7) | 30.3 (13.1) | 0.008 | Neg, Med<High |
| Trails B | 51.3 (19.0) | 50.8 (18.9) | 44.3 (8.7) | 83.7 (42.5) | <0.001 | Neg, Low, Med<High |
| Trails B-A | 31.3 (17.8) | 27.1 (15.8) | 22.8 (9.2) | 53.4 (38.3) | <0.001 | Neg, Low, Med<High |
| TRT: precision | 0.024 (0.005) | 0.020 (0.004) | 0.020 (0.006) | 0.019 (0.006) | 0.011 | High<Neg |
CAG, cytosine-adenine-guanine; CAP, CAG-age product; CC/UI, Cleveland Clinic/University of Iowa; SDMT, Symbol Digit Modalities Task; TRT, time reproduction task; UHDRS; Unified Huntington's Disease Rating Scale.
The neuropsychological performance was tested using ANCOVAs with age and education as covariates. The HIGH group performed more poorly on Trails and Stroop measures (p<0.006), showed greater variability in timing precision (p=0.011), and a score lower on the SDMT (p=0.002).
Volumetric analysis
Table 2 shows the results of the volumetric analysis. An age-corrected ANCOVA showed decreased bilateral putamen volumes in the HIGH and MED groups as compared with the LOW and NEG groups (p<2×10⁻⁷). The HIGH group also had smaller volumes of the caudate and globus pallidus (p<0.0005). No regions showed significant group differences in cortical thickness, and there were no group differences in the volume of cortical or subcortical gray matter or white matter. As a result, cortical thickness and overall tissue volumes were not included as covariates in subsequent analyses.
Table 2.
Mean (Standard Deviation) of Bilateral Cortical and Subcortical Volumes
| Region | NEG n=16 | LOW n=16 | MED n=16 | HIGH n=16 | pa | Post hocs |
|---|---|---|---|---|---|---|
| White matter | 31.7 (2.6) | 30.4 (2.0) | 30.9 (0.88) | 30.7 (2.7) | 0.293 | — |
| Cortical gray matter | 44.7 (2.7) | 46.1 (2.3) | 45.0 (3.2) | 44.3 (3.1) | 0.976 | — |
| Subcortical gray matter | 12.8 (1.0) | 13.1 (1.0) | 12.7 (0.9) | 12.8 (1.0) | 0.863 | — |
| Caudate | 0.50 (0.05) | 0.53 (0.06) | 0.48 (0.06) | 0.43 (0.07) | 0.0005 | High<Neg, Low |
| Thalamus | 1.12 (0.09) | 1.17 (0.13) | 1.09 (0.10) | 1.11 (0.13) | 0.059 | — |
| Putamen | 0.73 (0.07) | 0.75 (0.08) | 0.65 (0.06) | 0.59 (0.10) | 2×10⁻⁷ | High, Med<Neg, Low |
| Globus pallidus | 0.21 (0.02) | 0.21 (0.03) | 0.19 (0.03) | 0.16 (0.03) | 4×10⁻⁷ | High<Neg, Low, Med |
Results of a one-way ANCOVA for group effects with age as a covariate. Significance values in bold survived FDR. Volumes reported as % of intracranial volume.
ANCOVA, analysis of covariance.
Motion
An ANOVA showed no group differences in mean or maximum peak-to-peak displacement (Jiang et al., 1995) during the rs-fMRI scan (p>0.163).
Functional connectivity
Thirteen regions showed significant connectivity with left M1 in one or more of the four group-averaged maps (Table 3). Significant group differences were found for M1 connectivity with the right precentral gyrus, right postcentral gyrus, and right cuneus (Fig. 2 and Table 3). In gene-positive participants, an age-adjusted partial correlation showed that higher CAP scores were associated with weaker M1 connectivity strength with the right precentral gyrus (r=−0.448, p=0.0015), right postcentral gyrus (r=−0.452, p=0.0014), right cuneus (r =−0.381, p=0.0083), and left cuneus (r=−0.414, p=0.0038). Figure 3 shows the relationship between left M1 connectivity and CAP score for these regions.
Table 3.
Regions Showing Significant Connectivity to Left M1 in Any of the Four Group-Averaged Maps
| Talairach coordinates | CAPb | ||||||||
|---|---|---|---|---|---|---|---|---|---|
| Side | Region | BA | x | y | z | pa | Post hocs | r | p |
| R | Precentral gyrus | 4 | 39 | −21 | 49 | 0.019 | High<Low | −0.448 | 0.0015 |
| L | Supplementary motor area | 6 | −3 | −17 | 50 | 0.052 | −0.256 | 0.0829 | |
| L | Insula | 13 | −47 | −19 | 18 | 0.277 | −0.301 | 0.04 | |
| R | Postcentral gyrus | 43 | 55 | −11 | 18 | 0.006 | High<Neg | −0.452 | 0.0014 |
| L | Middle temporal gyrus | 37 | −41 | −64 | 7 | 0.169 | −0.265 | 0.0724 | |
| R | Lingual gyrus | 19 | 18 | −46 | −1 | 0.375 | −0.254 | 0.0856 | |
| L | Insula, middle | 13 | −32 | −16 | 17 | 0.878 | −0.04 | 0.7922 | |
| R | Insula, middle | 13 | 34 | −16 | 17 | 0.784 | −0.165 | 0.2679 | |
| L | Thalamus | −13 | −22 | 5 | 0.437 | −0.173 | 0.2462 | ||
| R | Thalamus | 13 | −21 | 5 | 0.257 | −0.209 | 0.159 | ||
| L | Cuneus | 7 | −18 | −76 | 32 | 0.083 | −0.414 | 0.0038 | |
| R | Cuneus | 7 | 17 | −77 | 32 | 0.015 | Neg<Low | −0.381 | 0.0083 |
| R | Middle temporal gyrus | 37 | 44 | −60 | 7 | 0.088 | −0.173 | 0.2437 | |
Bold values survived FDR correction.
Results of a one-way ANCOVA for group effects with age as a covariate.
Results of a partial correlation (age adjusted) with CAP score.
FDR, false discovery rate.
FIG. 3.

Relationship between CAP score and the strength of connectivity from left M1 to the right precentral gyrus (r=−0.448, p=0.0015), right postcentral gyrus (r=−0.452, p=0.0014), left cuneus (r=−0.414, p=0.0038) and right cuneus (r=−0.381, p=0.0083) (FDR corrected).
To further investigate the relationship between strength of connectivity and disease burden as measured by the CAP score, we performed a whole-brain voxelwise partial correlation on the 48 gene-positive participants. In this analysis and in the behavioral and volumetric analyses described below, prHD participants were treated as a single sample and were not grouped by the CAP score. The bilateral posterior cingulate cortex (PCC) was the only region to survive at the p=0.01 level, cluster size 1500 (Fig. 4). Although the regions that showed group differences in the above analysis were present at lower significance thresholds, the statistical penalty for a voxelwise analysis resulted in only one surviving ROI. A partial correlation demonstrated that a stronger M1 connectivity with the PCC was significantly associated with higher CAP scores (r=0.595, p=1×10⁻⁵; Fig. 4).
FIG. 4.
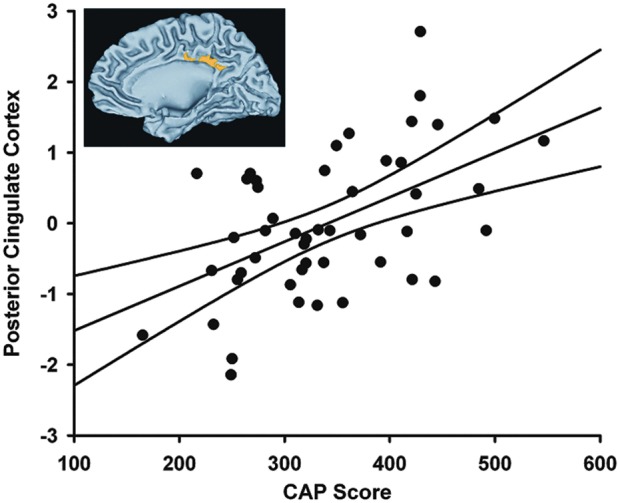
Left M1 connectivity with the PCC was significantly related to CAP score in a whole brain voxel-wise analysis (r=0.595, p=1×10⁻⁵). Inset shows results of the whole brain analysis, thresholded at p<0.01, cluster size 1500.
The relationship of connectivity to behavioral measures in the 48 prHD participants was examined in the right precentral gyrus, right postcentral gyrus, right and left cuneus, and posterior cingulate. An age-adjusted partial correlation showed a negative relationship between a lower score on the UHDRS TMS, associated with fewer motor symptoms, and the strength of connectivity from the left M1 to the right postcentral gyrus (r=−0.352, p=0.015) and the right precentral gyrus, although this was not significant after FDR correction (r=−0.314, p=0.032). Neuropsychological performance measures were transformed to age- and education-adjusted residuals and correlated with age-adjusted mean connectivity. Connectivity to the right precentral gyrus was related to performance on Stroop Color (r=0.363, p=0.011), Trails B (r=−0.408, p=0.004), and Trails B-A (r=−0.441, p=0.002); correlations with SDMT (r=0.296, p=0.041) and Stroop Interference (r=0.332, p=0.021) did not survive FDR correction. In all cases, increased connectivity between left M1 and the right precentral gyrus was associated with better task performance. Likewise, connectivity to the right postcentral gyrus was associated with increased performance on the SDMT (r=0.363, p=0.011). Conversely, connectivity from left M1 to the PCC was associated with worse performance on Stroop Color (r=−0.382, p=0.007), Trails B (r=0.327, p=0.023), and Trails B-A (r=0.336, p=0.020), although correlations with Trails measures did not survive FDR correction. Figure 5 shows the relationships between connectivity and behavioral measures that survived the FDR correction.
FIG. 5.

Relationship of behavioral measures and connectivity to the left M1 (p<0.018, FDR corrected, see text for details).
Lastly, the authors conducted exploratory analyses to assess relationships between connectivity and volume loss in the basal ganglia of prHD participants. Bilateral volumes from the three basal ganglia regions that showed group differences (caudate, putamen, and globus pallidus) were correlated (age adjusted) with connectivity measures that showed abnormalities in prHD and/or correlated with the CAP score. As this was an exploratory analysis, the FDR correction was not used. Larger bilateral putamen and bilateral globus pallidus volumes were significantly related to a stronger M1 connectivity with the right precentral gyrus (r=0.412, p=0.0040; r=0.402, p=0.0051; respectively), the right cuneus (r=0.372, p=0.0099; r=0.325, p=0.0256), and the left cuneus (r=0.406, p=0.0046; r=0.377, p=0.0091). In contrast, a stronger M1 connectivity with the PCC was related to the smaller bilateral caudate (r=−0.343, p=0.0184), putamen (r=−0.414, p=0.0038), and globus pallidus (r=−0.505, p=0.0003) volumes. Figure 6 shows the relationship of bilateral putamen and global pallidus volumes to left M1 connectivity.
FIG. 6.

Relationship between bilateral putamen and globus pallidus volumes and the strength of connectivity between left M1 and the right precentral gyrus (r=0.412, p=0.0040; r=0.402, p=0.0051, respectively), right cuneus (r=0.372, p=0.0099; r=0.325, p=0.0256), left cuneus (r=0.406, p=0.0046; r=0.377, p=0.0091), and posterior cingulate (r=−0.414, p=0.0038; r=−0.505, p=0.0003).
Discussion
To our knowledge, this is the first study to report that functional connectivity of the primary motor cortex with motor and nonmotor areas is related to genetic burden in prHD. Within the motor network, the authors found that the strength of left M1 connectivity with the ipsilateral (right) primary motor (precentral gyrus) and somatosensory (postcentral gyrus) areas decreased as genetic burden increased. Outside of the motor network, M1 connectivity with the bilateral cuneus decreased with increasing genetic burden, but increased with the PCC, a key element of the default mode network (DMN) (Gusnard and Raichle, 2001). Functional connectivity disturbances were associated with performances on measures of cognitive-motor functioning that are sensitive to disease progression in prHD. The authors also found that volume loss in the putamen, globus pallidus, and caudate was related to M1 connectivity within and outside the motor system, suggesting that structural changes in the basal ganglia may partly underlie functional connectivity disturbances of the primary motor cortex.
This finding of reduced connectivity of contralateral M1 with ipsilateral M1 and somatosensory cortex indicated that in prHD there are early changes in interhemispheric interactions that are known to occur between the motor areas. Although the role of ipsilateral M1 in motor control is not fully understood, it has been proposed that unilateral movements produce temporary inhibition of ipsilateral M1, which is thought to restrict motor output to the hemisphere contralateral to the intended movement (Beaule et al., 2012; Buetefisch et al., 2014; Chiou et al., 2013; Kobayashi et al., 2003). Unilateral tactile stimulation also produces facilitation and inhibition in contralateral and ipsilateral somatosensory areas (Stringer et al., 2014). Interestingly, a poorer motor performance in healthy adults during unimanual tasks is associated with less suppression of ipsilateral sensorimotor activation (McGregor et al., 2013). Thus, contralateral and ipsilateral motor areas appear to work in an opposing manner, much as the direct and the indirect pathways work in the classic model of basal ganglia circuitry (DeLong, 1990). Recent animal models, however, suggest that the direct and indirect pathways work in a coordinated manner to facilitate intended actions and inhibit competing ones (Cui et al., 2013; Jin et al., 2014), which may also apply to interhemispheric interactions among the cortical motor areas (Horenstein et al., 2009). One speculation is that an optimal balance in the synchrony between interhemispheric motor areas may change as individuals approach a manifest diagnosis, and possibly contribute to early motor symptoms such as hyperkinesias. Indeed, prHD participants with more motor symptoms on the UHDRS showed weaker M1 connectivity with the ipsilateral ventral somatosensory cortex, a multisensory area, and a trend for weaker connectivity with ipsilateral M1. Moreover, weaker connectivity between contralateral and ipsilateral M1 correlated with poorer performance on neuropsychological measures that contained a strong motor component (Trail Making test, Stroop Task, SDMT).
The finding of weakened M1 connectivity with motor areas is consistent with a report of reduced M1 synchronization within the sensorimotor cortex in prHD (Poudel et al., 2014), but contrary to the finding of normal sensorimotor network connectivity in prHD (Dumas et al., 2013). This study builds upon these findings, demonstrating that weakened M1 connectivity is specifically with interhemispheric sensorimotor areas and depends upon genetic burden. These results are compatible with a task-related (i.e., alertness task) fMRI study reporting weakened M1 connectivity with the SMA, but only in individuals far from diagnosis (Wolf et al., 2012). Surprisingly, it is controversial as to whether manifest HD is associated with changes in sensorimotor network connectivity in the resting state (Poudel et al., 2014; Werner et al., 2014) despite the striking motor symptoms, which correlate white matter deterioration in the fiber pathway from the basal ganglia to the primary motor cortex (Bohanna et al., 2011). When intrinsic functional connectivity disturbances were found (Werner et al., 2014), connectivity was increased throughout the entire sensorimotor network in manifest HD. This result contrasts with the finding of a circumscribed weakening of left M1 connectivity with interhemispheric motor areas as individuals approached a diagnosis. Although longitudinal studies are needed to elucidate mechanisms of progressive changes in neuromodulation in HD, one speculation is that with more widespread dysfunction in areas of the sensorimotor network, dedifferentiation increases (Li et al., 2001; Werner et al., 2014).
This finding of abnormal M1 connectivity with areas outside the motor network may be an early sign in prHD of decreasing functional specialization and/or compensatory interactions with other networks that can result in reorganization of function. M1 connectivity with the bilateral cuneus was weakened as genetic burden increased. Weakened connectivity between motor and visual networks may underlie disturbances in visuomotor integration (e.g., circle tracing task), which has been reported in prHD (Say et al., 2011). In addition, M1 connectivity with the right cuneus was significantly increased in the LOW group and tended to be elevated in the MED group, which was not seen in the NEG or HIGH groups. Enhanced connectivity early in the prodromal stage could be an intermediate phenotype of cell dysfunction that begins long before cell death (Tobin and Signer, 2000) and may result in compensation.
As proximity to a diagnosis neared, the authors also found that M1 connectivity increased with the PCC, a key region of the DMN, which is associated with internal thought processes. Less suppression of the DMN is associated with worse performance on attention-demanding tasks. Thus, strengthened M1-PCC connectivity may be a source for disruptions in executive components of motor control in prHD, such as sequencing (Georgiou-Karistianis et al., 2014). This is compatible with the finding that a stronger M1-PCC connectivity was associated with worse performance on a measure of executive functioning (Trails B-A) and color naming (Stroop), but not motor symptoms on the UHDRS. Metabolic alterations of the PCC in prHD suggest that this region may be involved in early functional brain changes (Unschuld et al., 2012a), yet rs-fMRI studies have reported normal PCC connectivity (Seibert et al., 2012) and normal DMN synchronization in prHD (Dumas et al., 2013; Poudel et al., 2014). Still, these findings require further scrutiny as the effect of genetic burden on connectivity was not studied. Altogether, these results suggest that abnormal M1 connectivity with motor areas results in the formation of long-range connections outside the motor network.
Consistent with others (Unschuld et al., 2012b), the authors did not find abnormal M1 connectivity with the striatum, despite significant basal ganglia atrophy not only in participants in the HIGH group but also in the MED group (putamen only). Yet, smaller putamen and globus pallidus volumes were associated with weaker connectivity between contralateral and ipsilateral M1 areas. Smaller basal ganglia volumes were also associated with weaker M1 connectivity with the bilateral cuneus and stronger M1 connectivity with the PCC. However, basal ganglia volume accounted for only 10% and 25% of the variance in M1 connectivity measures. Thus, abnormal short-range and long-range intrinsic functional connectivity of the primary motor cortex in prHD appears to be partly a manifestation of structural changes in the striatum and functional changes.
This study has several limitations. First, the gene-positive participants were stratified by the CAP score, leading to only 16 subjects in each group. While this may have rendered pairwise group comparisons somewhat underpowered, analyses in which CAP scores were correlated with various measures were likely sufficiently powered to test the effects of disease burden on functional connectivity. Second, although the groups were not matched on education, the statistical analyses adjusted for potential effects of this variable. Third, groups were not matched on age since disease burden is determined by the CAG repeat length and age. However, the CAP score is the product of age and CAG repeat length. As such, correlations of CAP with the functional connectivity measures consider potential age–gene interactions. Finally, longitudinal studies are needed to directly assess the effect of disease burden on functional connectivity disturbances in prHD and to chart the temporal course of the changes and their relationship to structural changes in the brain.
Conclusion
The present study found that intrinsic functional connectivity disturbances of the primary motor area depended upon the proximity to a manifest diagnosis, suggesting that rs-fMRI may have potential to track progressive changes in brain functioning during the prodromal period. The authors found that prHD altered both short-range intrinsic functional connectivity within the motor system and long-range connectivity between the primary motor area and the cuneus and PCC. The finding that motor symptoms on the UHDRS correlated with abnormal M1 connectivity within, but not outside the motor network, suggested that disruptions in interhemispheric interactions between sensorimotor areas may contribute to motor symptoms in HD. Although changes in intrinsic connectivity of M1 with posterior cortical regions may be a reflection of a dedifferentiation and/or compensation that results in reorganization of function longitudinal studies that characterize the temporal course of connectivity changes, coincident with structural changes in the brain, will be needed.
Contributor Information
Collaborators: the PREDICT-HD Investigators of the Huntington Study Group
Acknowledgments
This work was supported by grants from the National Institutes of Health, National Institute of Neurological Disorders and Stroke (5RO1NS040068, 1U01NS082083, 5R01NS054893), and the CHDI Foundation. The authors thank the University of Iowa and Cleveland Clinic PREDICT-HD sites, the study participants, the National Research Roster for Huntington Disease Patients and Families, the Huntington's Disease Society of America, and the Huntington Study Group. They acknowledge the assistance of Jeffrey D. Long, Hans J. Johnson, Vincent A, Magnotta, and Jeremy H. Bockholt. The content is solely the responsibility of the authors and does not necessarily represent the official views of the NIH.
Author Disclosure Statement
No competing financial interests exist.
References
- Antoniades CA, Xu Z, Mason SL, Carpenter RH, Barker RA. 2010. Huntington's disease: changes in saccades and hand-tapping over 3 years. J Neurol 257:1890–1898 [DOI] [PubMed] [Google Scholar]
- Aylward EH, Sparks BF, Field KM, Yallapragada V, Shpritz BD, Rosenblatt A, et al. 2004. Onset and rate of striatal atrophy in preclinical Huntington disease. Neurology 63:66–72 [DOI] [PubMed] [Google Scholar]
- Beall EB, Lowe MJ. 2007. Isolating physiologic noise sources with independently determined spatial measures. Neuroimage 37:1286–1300 [DOI] [PubMed] [Google Scholar]
- Beaule V, Tremblay S, Theoret H. 2012. Interhemispheric control of unilateral movement. Neural Plast 2012:1–11 [DOI] [PMC free article] [PubMed] [Google Scholar]
- Bohanna I, Georgiou-Karistianis N, Egan GF. 2011. Connectivity-based segmentation of the striatum in Huntington's disease: vulnerability of motor pathways. Neurobiol Dis 42:475–481 [DOI] [PubMed] [Google Scholar]
- Buetefisch CM, Pirog RK, Shuster L, Hines B, Parsons M. 2014. Motor demand dependent activation of ipsilateral motor cortex. J Neurophysiol [Epub ahead of Print]; DOI: 10.1152/jn.00110.02014 [DOI] [PMC free article] [PubMed] [Google Scholar]
- Bullmore ET, Brammer MJ, Rabe-Hesketh S, Curtis VA, Morris RG, Williams SC, et al. 1999. Methods for diagnosis and treatment of stimulus-correlated motion in generic brain activation studies using fMRI. Hum Brain Mapp 7:38–48 [DOI] [PMC free article] [PubMed] [Google Scholar]
- Chiou SY, Wang RY, Liao KK, Wu YT, Lu CF, Yang YR. 2013. Co-activation of primary motor cortex ipsilateral to muscles contracting in a unilateral motor task. Clin Neurophysiol 124:1353–1363 [DOI] [PubMed] [Google Scholar]
- Cox R, Saad Z. 2010. Surfing the Connectome: InstaCorr in AFNI and SUMA. Presented at Second Biennial International Conference on Resting-State Functional Brain Connectivity, Milwaukee, WI [Google Scholar]
- Cox RW. 1996. AFNI: Software for analysis and visualization of functional magnetic resonance neuroimages. Comput Biomed Res 29:162–173 [DOI] [PubMed] [Google Scholar]
- Cui G, Jun SB, Jin X, Pham MD, Vogel SS, Lovinger DM, et al. 2013. Concurrent activation of striatal direct and indirect pathways during action initiation. Nature 494:238–242 [DOI] [PMC free article] [PubMed] [Google Scholar]
- DeLong MR. 1990. Primate models of movement disorders of basal ganglia origin. Trends Neurosci 13:281–285 [DOI] [PubMed] [Google Scholar]
- Dumas EM, van den Bogaard SJ, Hart EP, Soeter RP, van Buchem MA, van der Grond J, et al. 2013. Reduced functional brain connectivity prior to and after disease onset in Huntington's disease. Neuroimage Clin 14:377–384 [DOI] [PMC free article] [PubMed] [Google Scholar]
- Dumas EM, van den Bogaard SJ, Ruber ME, Reilman RR, Stout JC, Craufurd D, et al. 2012. Early changes in white matter pathways of the sensorimotor cortex in premanifest Huntington's disease. Hum Brain Mapp 33:203–212 [DOI] [PMC free article] [PubMed] [Google Scholar]
- Duyao M, Ambrose C, Myers R, Novelletto A, Persichetti F, Frontali M, et al. 1993. Trinucleotide repeat length instability and age of onset in Huntington's disease. Nat Genet 4:387–392 [DOI] [PubMed] [Google Scholar]
- Freesurfer. 2011. Version 5.1.0: http://surfer.nmr.mgh.harvard.edu/ Last accessed April18, 2014
- Georgiou-Karistianis N, Long JD, Lourens SG, Stout JC, Mills JA, Paulsen JS, et al. 2014. Movement sequencing in Huntington disease. World J Biol Psychiatry 15:459–471 [DOI] [PMC free article] [PubMed] [Google Scholar]
- Glover GH, Li T, Ress D. 2000. Image-based method for retrospective correction of physiological motion effects in fMRI: RETROICOR. Magn Reson Med 44:162–167 [DOI] [PubMed] [Google Scholar]
- Golden CJ, Freshwater SM. 2002. Stroop Color and Word Test: Revised Examiner's Manual. Wood Dale, IL: Stoelting Co [Google Scholar]
- Gusnard DA, Raichle ME. 2001. Searching for a baseline: functional imaging and the resting human brain. Nat Rev Neurosci 2:685–694 [DOI] [PubMed] [Google Scholar]
- Harrington DL, Smith MM, Zhang Y, Carlozzi NE, Paulsen JS, et al. 2012. Cognitive domains that predict time to diagnosis in prodromal Huntington disease. J Neurol Neurosurg Psychiatry 83:1–19 [DOI] [PMC free article] [PubMed] [Google Scholar]
- Hinton SC, Paulsen JS, Hoffmann RG, Reynolds NC, Zimbelman JL, Rao SM. 2007. Motor timing variability increases in preclinical Huntington's disease patients as estimated onset of motor symptoms approaches. J Int Neuropsychol Soc 13:539–543 [DOI] [PubMed] [Google Scholar]
- Horenstein C, Lowe MJ, Koenig KA, Phillips MD. 2009. Comparison of unilateral and bilateral complex finger tapping-related activation in premotor and primary motor cortex. Hum Brain Mapp 30:1397–1412 [DOI] [PMC free article] [PubMed] [Google Scholar]
- HSG. 1996. Unified Huntington's disease rating scale: reliability and consistency. Huntington Study Group. Mov Disord 11:136–142 [DOI] [PubMed] [Google Scholar]
- Jiang A, Kennedy DN, Baker JR, Weisskoff RM, Tootell RBH, Woods RP, et al. 1995. Motion detection and correction in functional MR imaging. Hum Brain Mapp 3:224–235 [Google Scholar]
- Jin X, Tecuapetla F, Costa RM. 2014. Basal ganglia subcircuits distinctively encode the parsing and concatenation of action sequences. Nat Neurosci 17:423–430 [DOI] [PMC free article] [PubMed] [Google Scholar]
- Kirkwood SC, Siemers E, Stout JC, Hodes ME, Conneally PM, Christian JC, et al. 1999. Longitudinal cognitive and motor changes among presymptomatic Huntington disease gene carriers. Arch Neurol 56:563–568 [DOI] [PubMed] [Google Scholar]
- Kobayashi M, Hutchinson S, Schlaug G, Pascual-Leone A. 2003. Ipsilateral motor cortex activation on functional magnetic resonance imaging during unilateral hand movements is related to interhemispheric interactions. NeuroImage 20:2259–2270 [DOI] [PubMed] [Google Scholar]
- Li S-C, Lindenberger U, Sikström S. 2001. Aging cognition: from neuromodulation to representation. Trends Cogn Sci 5:479–486 [DOI] [PubMed] [Google Scholar]
- Long JD, Paulsen JS, Marder K, Zhang Y, Kim J, Mills JA, et al. 2014. Tracking motor impairments in the progression of Huntington's disease. Mov Disord 29:311–319 [DOI] [PMC free article] [PubMed] [Google Scholar]
- Lowe MJ, Mock BJ, Sorenson JA. 1998. Functional connectivity in single and multislice echoplanar imaging using resting-state fluctuations. Neuroimage 7:119–132 [DOI] [PubMed] [Google Scholar]
- Lowe MJ, Sorenson JA. 1997. Spatially filtering functional magnetic resonance imaging data. Magn Reson Med 37:723–729 [DOI] [PubMed] [Google Scholar]
- MATLAB. 2012. version 7.14.0.739 (R2012a). Natick, MA: The MathWorks, Inc [Google Scholar]
- McGregor KM, Nocera JR, Sudhyadhom A, Patten C, Manini TM, Kleim JA, et al. 2013. Effects of aerobic fitness on aging-related changes of interhemispheric inhibition and motor performance. Front Aging Neurosci 5:1–14 [DOI] [PMC free article] [PubMed] [Google Scholar]
- Nopoulos PC, Aylward EH, Ross CA, Johnson HJ, Magnotta VA, Juhl AR, et al. 2010. Cerebral cortex structure in prodromal Huntington disease. Neurobiol Dis 40:544–554 [DOI] [PMC free article] [PubMed] [Google Scholar]
- Paulsen JS, Langbehn DR, Stout JC, Aylward E, Ross CA, Nance M, et al. 2008. Detection of Huntington's disease decades before diagnosis: the Predict-HD study. J Neurol Neurosurg Psychiatry 79:874–880 [DOI] [PMC free article] [PubMed] [Google Scholar]
- Paulsen JS, Long JD, Johnson HJ, Aylward EH, Ross CA, Williams JK, et al. 2014. Clinical and biomarker changes in premanifest huntington disease show trial feasibility: a decade of the PREDICT-HD study. Front Aging Neurosci 6:1–11 [DOI] [PMC free article] [PubMed] [Google Scholar]
- Paulsen JS, Nopoulos PC, Aylward E, Ross CA, Johnson H, Magnotta VA, et al. 2010. Striatal and white matter predictors of estimated diagnosis for Huntington disease. Brain Res Bull 82:201–207 [DOI] [PMC free article] [PubMed] [Google Scholar]
- Paulsen JS, Zimbelman JL, Hinton SC, Langbehn DR, Leveroni CL, Benjamin ML, et al. 2004. fMRI biomarker of early neuronal dysfunction in presymptomatic Huntington's disease. AJNR Am J Neuroradiol 25:1715–1721 [PMC free article] [PubMed] [Google Scholar]
- Poudel GR, Egan GF, Churchyard A, Chua P, Stout JC, Georgiou-Karistianis N. 2014. Abnormal synchrony of resting state networks in premanifest and symptomatic Huntington disease: the IMAGE-HD study. J Psychiatry Neurosci 39:87–96 [DOI] [PMC free article] [PubMed] [Google Scholar]
- Rao JA, Harrington DL, Durgerian S, Reece C, Mourany L, Koenig KA, et al. 2014. Disruption of response inhibition circuits in prodromal Huntington disease. Cortex 58C:72–85 [DOI] [PMC free article] [PubMed] [Google Scholar]
- Rao SM, Harrington DL, Haaland KY, Bobholz JA, Cox RW, Binder JR. 1997. Distributed neural systems underlying the timing of movements. J Neurosci 17:5528–5535 [DOI] [PMC free article] [PubMed] [Google Scholar]
- Reitan RM. 1958. Validity of the trail making test as an indicator of organic brain damage. Percept Motor Skills 8:271–276 [Google Scholar]
- Rosas HD, Hevelone ND, Zaleta AK, Greve DN, Salat DH, Fischl B. 2005. Regional cortical thinning in preclinical Huntington disease and its relationship to cognition. Neurology 65:745–747 [DOI] [PubMed] [Google Scholar]
- Rowe KC, Paulsen JS, Langbehn DR, Duff K, Beglinger LJ, Wang C, et al. 2010. Self-paced timing detects and tracks change in prodromal huntington disease. Neuropsychology 24:435–442 [DOI] [PMC free article] [PubMed] [Google Scholar]
- Saad ZS, Glen DR, Chen G, Beauchamp MS, Desai R, Cox RW. 2009. A new method for improving functional-to-structural alignment using local Pearson correlation. Neuroimage 44:839–848 [DOI] [PMC free article] [PubMed] [Google Scholar]
- Say MJ, Jones R, Scahill RI, Dumas EM, Coleman A, Santos RC, et al. 2011. Visuomotor integration deficits precede clinical onset in Huntington's disease. Neuropsychologia 49:264–270 [DOI] [PubMed] [Google Scholar]
- Scahill RI, Hobbs NZ, Say MJ, Bechtel N, Henley SM, Hyare H, et al. 2013. Clinical impairment in premanifest and early Huntington's disease is associated with regionally specific atrophy. Hum Brain Mapp 34:519–529 [DOI] [PMC free article] [PubMed] [Google Scholar]
- Seibert TM, Majid DS, Aron AR, Corey-Bloom J, Brewer JB. 2012. Stability of resting fMRI interregional correlations analyzed in subject-native space: a one-year longitudinal study in healthy adults and premanifest Huntington's disease. NeuroImage 59:2452–2463 [DOI] [PMC free article] [PubMed] [Google Scholar]
- Smith A. 1991. Symbol Digit Modalities Test. Los Angeles, CA: Western Psychological Services [Google Scholar]
- Stout JC, Paulsen JS, Queller S, Solomon AC, Whitlock KB, Campbell JC, et al. 2011. Neurocognitive signs in prodromal Huntington disease. Neuropsychology 25:1–14 [DOI] [PMC free article] [PubMed] [Google Scholar]
- Stringer EA, Qiao PG, Friedman RM, Holroyd L, Newton AT, Gore JC, et al. 2014. Distinct fine-scale fMRI activation patterns of contra- and ipsilateral somatosensory areas 3b and I in humans. Hum Brain Mapp 35:4841–4857 [DOI] [PMC free article] [PubMed] [Google Scholar]
- Thu DC, Oorschot DE, Tippett LJ, Nana AL, Hogg VM, Synek BJ, et al. 2010. Cell loss in the motor and cingulate cortex correlates with symptomatology in Huntington's disease. Brain 133:1094–1110 [DOI] [PubMed] [Google Scholar]
- Tobin AJ, Signer ER. 2000. Huntington's disease: the challenge for cell biologists. Trends Cell Biol 10:531–536 [DOI] [PubMed] [Google Scholar]
- Unschuld PG, Edden RA, Carass A, Liu X, Shanahan M, Wang X, et al. 2012a. Brain metabolite alterations and cognitive dysfunction in early Huntington's disease. Mov Disord 27:895–902 [DOI] [PMC free article] [PubMed] [Google Scholar]
- Unschuld PG, Joel SE, Liu X, Shanahan M, Margolis RL, Biglan KM, et al. 2012b. Impaired cortico-striatal functional connectivity in prodromal Huntington's disease. Neurosci Lett 514:204–209 [DOI] [PMC free article] [PubMed] [Google Scholar]
- Werner CJ, Dogan I, Saß C, Mirzazade S, Schiefer J, Shah NJ, et al. 2014. Altered resting-state connectivity in Huntington's disease. Hum Brain Mapp 35:2582–2593 [DOI] [PMC free article] [PubMed] [Google Scholar]
- Wolf RC, Grön G, Sambataro F, Vasic N, Wolf ND, Thomann PA, et al. 2012. Brain activation and functional connectivity in premanifest Huntington's disease during states of intrinsic and phasic alertness. Hum Brain Mapp 33:2161–2173 [DOI] [PMC free article] [PubMed] [Google Scholar]
- Wolf RC, Sambataro F, Vasic N, Schönfeldt-Lecuona C, Ecker D, Landwehrmeyer B. 2008. Altered frontostriatal coupling in pre-manifest Huntington's disease: effects of increasing cognitive load. Eur J Neurol 15:180–190 [DOI] [PubMed] [Google Scholar]
- Wolf RC, Vasic N, Schonfeldt-Lecuona C, Landwehrmeyer GB, Ecker D. 2007. Dorsolateral prefrontal cortex dysfunction in presymptomatic Huntington's disease: evidence from event-related fMRI. Brain 130:2845–2857 [DOI] [PubMed] [Google Scholar]
- Zhang Y, Long JD, Mills JA, Warner JH, Lu W, Paulsen JS. 2011. Indexing disease progression at study entry with individuals at-risk for Huntington disease. Am J Med Genet B Neuropsychiatr Genet 156B:751–763 [DOI] [PMC free article] [PubMed] [Google Scholar]
- Zimbelman JL, Paulsen JS, Mikos A, Reynolds NC, Hoffmann RG, Rao SM. 2007. fMRI detection of early neural dysfunction in preclinical Huntington's disease. J Int Neuropsychol Soc 13:758–769 [DOI] [PubMed] [Google Scholar]