Abstract
BACKGROUND AND PURPOSE:
Restriction spectrum imaging is a sensitive DWI technique for probing separable water diffusion compartments in tissues. Here, we evaluate RSI-CMs derived from the spherically-restricted water compartment for improved tumor conspicuity and delineation from nontumor tissue and reduced sensitivity to edema compared with high-b-value DWI and ADC.
MATERIALS AND METHODS:
RSI was performed in 10 presurgical patients: 4 with glioblastoma, 3 with primary CNS lymphoma, and 3 with metastatic brain tumors. Multidirectional DWI data were collected at b = 500, 1500, and 4000 s/mm2. Quantification of tumor conspicuity, edema conspicuity, and relative sensitivity to edema for RSI-CMs; DWI at b = 4000 (DWI-4000); and ADC were compared in manually drawn VOIs. Receiver operating characteristic curves were used to evaluate the sensitivity and specificity of each method for delineating tumor from normal-appearing WM.
RESULTS:
Significant TC was seen with both RSI-CMs and DWI-4000, but not ADC. Significant EC was seen with ADC, but not RSI-CMs or DWI-4000. Significantly greater TC was seen with RSI-CMs compared with DWI-4000. Significantly reduced RSE was seen with RSI-CMs compared with both DWI-4000 and ADC. Greater sensitivity and specificity for delineating tumor from normal-appearing WM were seen with RSI-CMs (AUC = 0.91) compared with both DWI-4000 (AUC = 0.77) and ADC (AUC = 0.66).
CONCLUSIONS:
RSI-CMs offer improved conspicuity and delineation of high-grade primary and metastatic brain tumors and reduced sensitivity to edema compared with high-b-value DWI and ADC.
DWI is a powerful technique that measures the microscopic diffusion of water at a cellular level,1 and it is routinely used for early detection of acute cerebral ischemia.2 More recently, the clinical utility of DWI has gained increased recognition within neuro-oncology for identifying regions of malignant tumor on the basis of reduced ADC.3–5 Moreover, numerous investigators have shown a negative correlation between the tumor ADC values and cellularity,6–8 which is commonly attributed to increased restricted diffusion imposed by tumor cells. However, despite increased restricted diffusion, tumor ADC values rarely fall below that of normal-appearing WM. This is true even in highly cellular tumors that originate in WM, such as glioblastoma and primary CNS lymphoma.9 One explanation for the higher than expected ADC values in these tumors is the presence of edema and focal necrosis within the tumor itself, which increases the ADC through reduced hindrance imposed on the extracellular water.10,11 Thus, increased ADC due to edema and necrosis will offset reduced ADC imposed by tumor cells, resulting in lesions that are difficult to discern from normal-appearing WM on the basis of the ADC alone. This effect becomes more pronounced as the b-value is reduced due to increasing sensitivity to the fast hindered water fraction.
We have recently introduced a DWI technique for multi-b-value multidiffusion time acquisitions called “restriction spectrum imaging”, which aims to separate the hindered and restricted diffusion compartments in tissues over a range or “spectrum” of length (size) scales with spherical and cylindrical geometries.12 RSI represents a cross between the high-angular-resolution diffusion imaging techniques such as,13 diffusion spectrum MRI,14 and Q-ball15 and the multiscale (multicompartment) methods to probe non-Gaussian diffusion such as biexponential,16 stretched exponential,17 and kurtosis models.18 As such, RSI requires data to be collected over an extended b-value range (b > 3000 s/mm2) to sample the non-Gaussian diffusion signal attenuation.19,20
The purpose of this study was to evaluate the clinical utility of the RSI method for improved delineation of tumor from normal-appearing WM as well as reduced sensitivity to edema and necrosis compared with DWI and ADC image contrast measured at equivalent high b-values. We hypothesize that by isolating signal from the spherically-restricted water fraction with RSI, one may achieve greater sensitivity and specificity to tumor cellularity in the presence of edema and necrosis, which may allow improved delineation of tumor from normal-appearing WM compared with DWI and ADC.
Materials and Methods
Patients
This prospective study was approved by our institutional review board, and written informed consent was obtained from all patients. Between 2010 and 2012, all patients seen at the Neuro-Oncology Department at the University of California, San Diego, Moores Cancer Center underwent a standardized MR imaging protocol that included the RSI sequence. To limit the potential confound of surgical effects, we included patients in this study only if they had undergone an RSI scan prior to surgical resection. This resulted in 10 patients, including 4 with GBMs, 3 with primary CNS lymphomas, and 3 with metastatic tumors (Table 1). All patients with primary brain tumors were histologically diagnosed on the basis of either preimaging biopsy or postimaging biopsy or resection. Patients with metastatic tumors had known primary malignancies.
Table 1:
Histologic diagnosis and patient demographics
| Patient | Sex | Age (yr) | Pathology | Status |
|---|---|---|---|---|
| 1 | Male | 51 | Glioblastoma, astrocytic, gemistocytic | Postbiopsy, postradiation (6 mo)a |
| 2 | Male | 53 | Glioblastoma, astrocytic, small cell | Postbiopsy, postradiation (8 mo)a |
| 3 | Male | 84 | Glioblastoma, astrocytic, small cell | Prebiopsy, preradiation |
| 4 | Male | 66 | Glioblastoma, astrocytic, gemistocytic | Prebiopsy, preradiation |
| 5 | Male | 55 | Primary CNS lymphoma, large B-cell | Postbiopsy, preradiation |
| 6 | Female | 74 | Primary CNS lymphoma, large B-cell | Prebiopsy, preradiation |
| 7 | Male | 67 | Primary CNS lymphoma, large B-cell | Prebiopsy, preradiation |
| 8 | Female | 72 | Metastatic adenocarcinoma, primary colon | Prebiopsy, postradiosurgery (14 mo)a |
| 9 | Male | 58 | Metastatic renal cell carcinoma | Prebiopsy, postradiosurgery (10 mo)a |
| 10 | Female | 73 | Metastatic non-small cell lung | Prebiopsy, postradiosurgery (6 mo)a |
Interval in months between radiation treatment and MRI.
MR Imaging Examination
MR imaging was performed on a 3T Signa Excite HDx scanner (GE Healthcare, Milwaukee, Wisconsin) equipped with an 8-channel head coil. Our imaging protocol included pre- and postgadolinium 3D volumetric T1-weighted inversion recovery spoiled gradient-recalled sequences (TE/TR = 2.8/6.5 ms; TI = 450 ms; flip angle = 8°; FOV = 24 cm; 0.93 × 0.93 × 1.2 mm) and a 3D T2-weighted FLAIR sequence (TE/TR = 126/6000 ms; TI = 1863 ms; FOV = 24 cm; 0.93 × .093 × 1.2 mm). For RSI, a single-shot pulsed-field gradient spin-echo EPI sequence was used (TE/TR = 96 ms/17 seconds; FOV = 24 cm, matrix = 96 × 96 × 48) with 4 b-values (b = 0, 500, 1500, and 4000 s/mm2), and 6, 6, and 15 unique diffusion directions for each nonzero b-value, respectively (28 total volumes, ∼8 minutes scanning time).
Preprocessing: ADC and DWI Calculations
Before analysis, the raw RSI data were corrected for geometric distortions due to susceptibility,21 gradient nonlinearities, and eddy currents. This was followed by correction of patient motion by using in-house software. The ADC was calculated from a tensor fit to the full dataset (all b-values and diffusion directions). DWI images were formed separately for each b-value by averaging the b = 500 (DWI-500), b = 1500 (DWI-1500), and b = 4000 (DWI-4000) data.
RSI Analysis
For fixed diffusion time acquisitions, the RSI model reduces to a spectrum of ADCs at each voxel of the form12:
 |
where ADC‖ and ADC⊥ are the apparent parallel and perpendicular diffusivities of a cylindric tissue element, α is the angle between the cylinder (long) axis and the diffusion gradient direction, and S0 is the signal measured at b = 0. To define the spectrum, we set ADC‖ = 1 × 10⁻³ mm2/s and varied ADC⊥ from 0 mm2/s to ADC‖ in 6 equally spaced steps (On-line Fig 1A, scales 1–6). We included 2 additional isotropic terms: 1 modeling restricted diffusion (ADC‖ = ADC⊥ = 0 mm2/s; On-line Fig 1A, scale 0) and 1 “free” water (ADC‖ = ADC⊥ = 3 × 10⁻³ mm2/s; On-line Fig 1B, scale 7). To account for the unknown orientation of the cylindric components (scales 1–6, in which ADC⊥ < ADC‖), we used a spheric harmonic expansion for their orientation distribution functions as detailed in White et al12 (not shown in the equation for simplicity). Parameter maps were then fit to the unnormalized signal, which included the ADC spectrum components (T2-weighted volume fractions; On-line Fig 1B) and the geometric components (spheric harmonic coefficients, not shown), by using least-squares estimation with Tikhonov regularization.12 A constrained minimum variance beamformer was used to combine all the parameter maps (diffusion spectra) post hoc into a single image (herein termed the “RSI cellularity map,” On-line Fig 1E) with maximum specificity to spheric restricted diffusion (scale 0) through attenuation of the signal from all other scales (scales 1–7).
Volumes of Interest
Manual VOIs were drawn for tumor, peritumoral edema, and normal-appearing WM by using coregistered 3D volumetric T1 postcontrast, 3D volumetric FLAIR, and ADC sequences by a board-certified neuroradiologist using the Amira software package (Visage Imaging, Richmond, Victoria, Australia). Tumor was identified as areas of low ADC within the primary enhancing tumor site identified on the T1 postcontrast sequence. Peritumoral edema was identified as regions of hyperintensity on FLAIR surrounding the primary tumor. Normal-appearing WM was drawn in white matter contralateral to the tumor.
Conspicuity and Relative Sensitivity to Edema
To objectively quantify tumor conspicuity and edema conspicuity on imaging, we computed intensity ratios for each patient by dividing the mean signal in tumor and edema, respectively, by the mean signal in normal-appearing WM (TC = Tumor/Normal-Appearing WM; EC = Edema/Normal-Appearing WM). To quantify the relative sensitivity to edema versus sensitivity to tumor, we again computed intensity ratios—dividing the mean signal in edema by the mean signal in tumor (RSE = Edema/Tumor). RSE values >1 indicate greater relative sensitivity to edema versus tumor, and RSE values <1 indicate greater relative sensitivity to tumor versus edema. The RSE as a measure is not reliant on the assumption that the peritumoral edema is not infiltrated (as one would expect for GBM), only that the relative proportion of tumor cells be greater in our tumor VOI compared with our edema VOI. As an exploratory analysis, we also calculated a predicted infiltration baseline, defined here as the fractional difference between the mean signal in normal-appearing WM and the mean signal in edema divided by the mean signal in tumor (Predictive Infiltration Baseline = 100 × [Normal-Appearing WM − Edema]/Tumor for RSI-CMs and DWI, and 100 × [Edema − Normal-Appearing WM]/Tumor for ADC). The predictive infiltration baseline was deemed significant because it provides a theoretic measure of the minimal amount of tumor infiltration (signal) that would be needed within edema for it to be distinguished from normal-appearing WM. For ADC, a sign change is applied to the predictive infiltration baseline to reflect the contrast reversal between tumor and edema. A negative predictive infiltration baseline as defined above would suggest infiltrating tumor.
Receiver Operating Characteristic Analysis
To quantify the overall sensitivity and specificity of each method in distinguishing tumor from normal-appearing WM, we computed receiver operating characteristic curves by plotting the cumulative distribution of the normalized tumor signal-intensity histograms compiled across all patients (sensitivity), against the normalized normal-appearing WM signal intensity histograms compiled across all patients (1-specificity).
Results
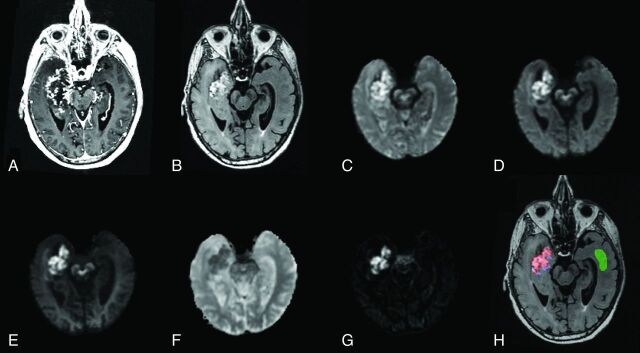
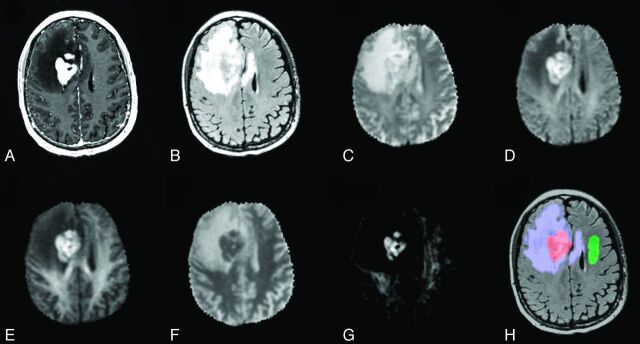
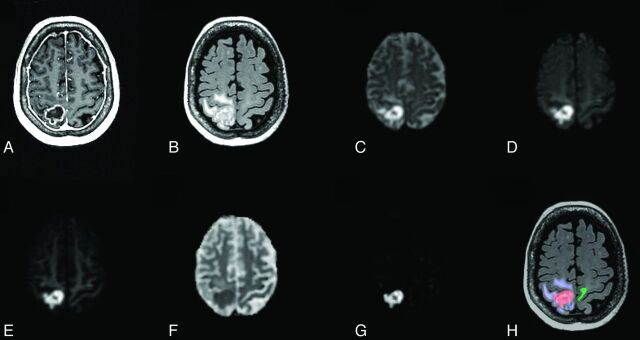
Qualitative improvements in tumor conspicuity and visualization of tumor margins were observed in all patients with RSI-CMs compared with DWI-4000 and ADC. Three representative patients are shown in Figs 1–3 for glioblastoma, lymphoma, and metastatic disease, respectively.
Fig 1.
Anatomic T1-weighted postcontrast (A) and T2-weighted FLAIR (B) in an 84-year-old man with glioblastoma (patient 3). DWI images at b = 500 (C), b = 1500 (D), and b = 4000 (E); ADC (F); and an RSI-CM are shown (G). VOIs for tumor (red), peritumoral edema (blue), and normal-appearing WM (green) used for quantitative analysis are shown in H.
Fig 2.
Anatomic T1-weighted postcontrast (A) and T2-weighted FLAIR (B) in a 67-year-old man with lymphoma (patient 7). Shown also are DWI images at b = 500 (C), b = 1500 (D), and b = 4000 (E); ADC (F); and an RSI-CM (G). VOIs for tumor (red), peritumoral edema (blue), and normal-appearing WM (green) used for quantitative analysis are shown in H.
Fig 3.
Anatomic T1-weighted postcontrast (A) and T2-weighted FLAIR (B) for a 73-year-old woman with metastatic non-small cell lung cancer (patient 10). Shown also are DWI images at b = 500 (C), b = 1500 (D), and b = 4000 (E); ADC (F); and an RSI-CM (G). VOIs for tumor (red), peritumoral edema (blue), and normal-appearing WM (green) used for quantitative analysis are shown in H.
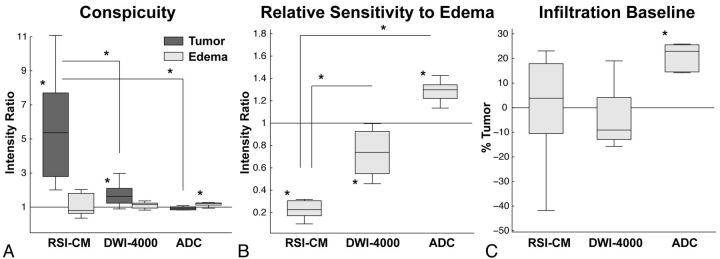
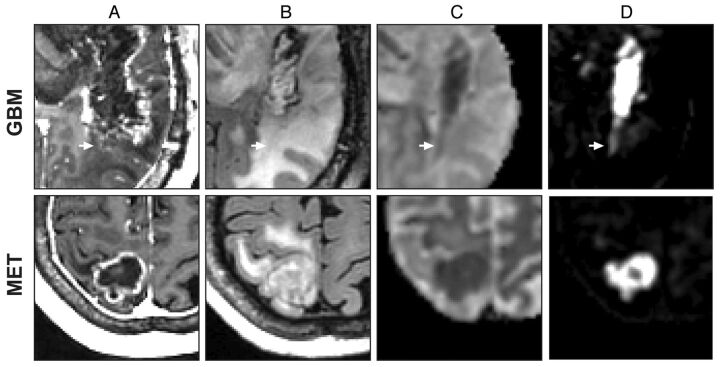
Quantitative comparisons of TC, RSE, and predictive infiltration baseline are shown in Fig 4 and Table 2. Significant TC was noted on the RSI-CM [t(9) = 4.67, P = .001] and DWI-4000 [t(9) = 3.68, P = .005], but not on ADC [t(9) = −1.75, P = .11]. Furthermore, RSI-CMs demonstrated significantly greater TC compared with DWI-4000 [t(9) = 4.48, P = .002] and ADC [t(9) = 6.73, P < .001]. Significant EC was noted on ADC [t(9) = 5.76, P < .001], but not on RSI-CMs [t(9) = 1.02, P = .34] or DWI-4000 [t(9) = 1.78, P = .11]. Significantly reduced RSE was noted for RSI-CMs compared with DWI-4000 [t(9) = −11.69, P < .001] and ADC [t(9) = −17.83, P < .001]. ADC demonstrated significantly greater predictive infiltration baseline compared with RSI-CMs [t(9) = 3.34, P < .01] and DWI-4000 [t(9) = 3.99, P < .01]. Consistent with the theoretical prediction of improved visualization of infiltrating tumor with RSI, Fig 5 demonstrates a close-up comparison of the tumor margins of presumed infiltrating and non-infiltrating GBM and metastasis, respectively.
Fig 4.
Box-and-whisker plots of intensity ratios quantifying tumor and edema conspicuity (A) and relative sensitivity to edema (B). On each box, the central mark is the median, the edges of the box are the 25th and 75th percentiles, the whiskers represent data ranges, and the red dots indicate potential outliers. A, TC is significant on the RSI-CM (P = .001) and DWI-4000 (P = .005), but not on ADC (P = .11). TC is significantly greater on the RSI-CM compared with DWI-4000 (P = .002) and ADC (P < .001). B, RSE is significantly less in the RSI-CM versus DWI-4000 (P < .001) and ADC (P < .001). C, Box-and-whisker plots of the predicted infiltrative baseline, defined as the percentage of tumor signal required within edema to equalize the signal to normal-appearing WM. The predicted infiltrative baseline of ADC is significantly greater than that of the RSI-CM (P < .001) and DWI-4000 (P < .001). Note that negative data points may reflect tumor infiltrated edema.
Table 2:
Quantitative image contrast measures
| RSI-CM | DWI-4000 | ADC | |
|---|---|---|---|
| TC (A/C) | 5.78 (3.23) | 1.71 (0.61) | 0.91 (0.16) |
| EC (B/C) | 1.50 (1.57) | 1.17 (0.31) | 1.19 (0.10) |
| RSEa (B/A) | 0.24 (0.12) | 0.73 (0.20) | 1.33 (0.17) |
| Predicted infiltration baseline (%) 100* (C-B)/A for RSI-CM and DWI-4000b 100* (B-C)/A for ADC | 0.01 (19.68) | −7.57 (17.78) | 18.69 (11.34) |
Note:—A indicates mean intensity in tumor; B, mean intensity in edema; C, mean intensity in normal-appearing WM.
Values <1 indicate greater relative sensitivity to tumor versus edema, and values >1 indicate greater relative sensitivity to edema versus tumor.
Negative values may reflect tumor infiltrated edema.
Fig 5.
Close-up comparison of GBM (patient 2) and non-small cell lung metastasis (patient 10). Anatomic T1-weighted postcontrast (A), T2-weighted FLAIR (B), ADC (C), and an RSI-CM (D). Arrows indicate a region of possible GBM tumor infiltration in nonenhancing peritumoral edema.
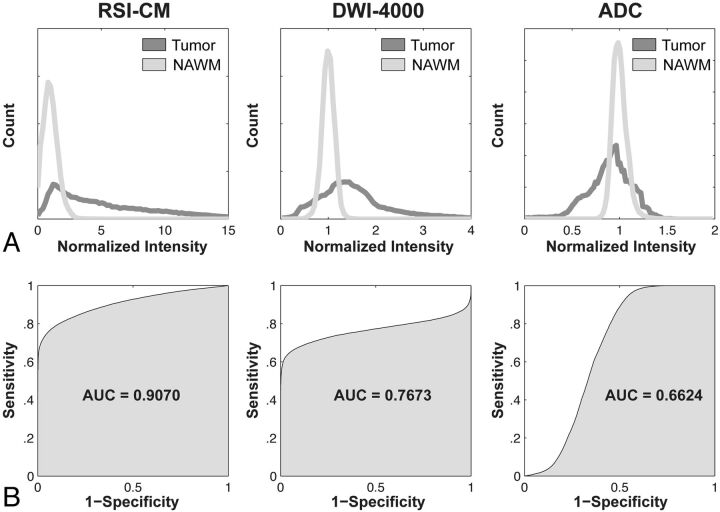
Receiver operating characteristic curves are presented in Fig 6, showing the greater sensitivity and specificity for distinguishing tumor from normal-appearing WM with RSI-CMs (AUC = 0.91) compared with both DWI-4000 (AUC = 0.77) and ADC (AUC = 0.66).
Fig 6.
Shown are normalized intensity histograms (A) and corresponding receiver operating characteristic curves (B) quantifying the increased sensitivity and specificity and overall accuracy (AUC) of the RSI-CM for distinguishing tumor from normal-appearing WM compared with DWI-4000 and ADC.
Discussion
Restriction spectrum imaging is a sensitive DWI technique that allows probing separable hindered and restricted water compartments in tissues across a spectrum of length scales and geometries. Here, we evaluate the utility of RSI-CMs in a clinical setting to improve tumor conspicuity and delineation from normal-appearing WM compared with high-b-value DWI and ADC.
Early detection of brain tumors on MR imaging requires images with high contrast between tumor and nontumor tissue. In all patients, we noted qualitative improvements in tumor conspicuity with RSI-CMs compared with both high-b-value DWI and ADC. These findings were supported by quantitative analyses demonstrating significantly improved tumor conspicuity on RSI-CMs compared with DWI-4000 and ADC (Fig 4A). Conspicuity on ADC was only significant for edema, but not tumor (Fig 4A). Partial voluming of edema and necrosis within the tumor may contribute to reduced conspicuity of tumor on ADC; conversely, removal of the fast hindered water component due to intratumoral edema and necrosis may explain, in part, the enhanced conspicuity of tumor on RSI-CMs.
Imaging sequences that are highly sensitive in detecting treatment-related changes in tumor versus edema are critical in the longitudinal evaluation of brain tumors, especially when the treatment is known to significantly alter the level of vasogenic edema, as seen with agents that inhibit the vascular endothelial growth factor pathways.22 The results in Fig 4B demonstrate significantly reduced relative sensitivity to edema versus tumor with RSI-CMs compared with DWI-4000 and ADC. The significantly higher RSE on ADC implies reduced ability to assess treatment-related changes in tumor cellularity in the setting of concurrent changes in edema, compared with RSI-CMs and DWI-4000 (Fig 4B).
Detecting the extent of infiltrating tumor within peritumoral edema also requires high sensitivity to tumor relative to edema, which corresponds to low RSE. Many authors have examined the role of the ADC to differentiate tumor-infiltrated edema from purely vasogenic edema, but the consensus remains mixed. While some have found higher ADC values in the presumably infiltrated peritumoral edema of high-grade gliomas compared with meningiomas,23,24 others have found the opposite relation (higher ADC values in the peritumoral edema of meningiomas compared with high-grade gliomas).4,25–27 Such conflicting results are consistent with the high sensitivity of the ADC to variations in the level of edema.
While the current study was not designed to systematically test the ability of RSI-CMs to differentiate infiltrated edema from purely vasogenic edema, we did note significant improvement in the predicted infiltration baseline with RSI-CMs and DWI-4000 compared with ADC (Fig 4C). This measure simply reflects the percentage of tumor signal that is required to reduce (in the case of ADC) or increase (in the case of RSI-CMs and DWI-4000) the existing edema signal to that of normal-appearing WM. Only the ADC demonstrated significantly elevated predictive infiltration baseline (Fig 4C), suggesting a reduced ability to distinguish infiltrating tumor in peritumoral regions. Consistent with the theoretic prediction of the predictive infiltration baseline, we did note qualitative differences in the glioblastoma multiforme tumor margins compared with the metastatic (presumably noninfiltrating) tumor margins on RSI-CMs compared with the ADC; an example is demonstrated in Fig 5. However, to systematically test whether RSI-CMs provide a more reliable biomarker of tumor infiltration compared with the ADC will require further validation on a larger sample size in conjunction with histologic evidence of infiltration.
We observed greater sensitivity and specificity for delineating tumor from normal-appearing WM with RSI-CMs compared with DWI-4000 and ADC (Fig 6), consistent with the increased tumor conspicuity and reduced relative sensitivity to edema. We also observed greater heterogeneity of tumor signal intensities (as evidenced by a broader histogram distribution) on RSI-CMs compared with DWI-4000 and ADC (Fig 6), which may reflect the intrinsic heterogeneity of tumor cellularity both within and across tumor types. If so, RSI-CMs may provide an improved tool for directing biopsies to the most cellular aspects of a patient's tumor, which may improve diagnosis and treatment planning.
There are a number of limitations to our study. First, only a small number of patients were selected due to the stringent criteria of including only presurgical tumors; and of those selected patients, some underwent radiation therapy before imaging and some did not. The purpose of the presurgical criteria was to mitigate any confound of postsurgical resection on our imaging comparisons, such as cytotoxic edema, blood products, and so forth. While incorporating patients with and without radiation therapy is not an ideal study design, we would not expect any systematic bias for one image contrast over another for 2 reasons: First, although radiation treatment is known to cause vasogenic edema and focal necrosis in tumor and surrounding tissue, it also reduces tumor cellularity; therefore, such treatment will result in reduced contrast between tumor and normal-appearing WM in both RSI-CMs and ADC. Second, our tumor VOIs incorporated only the portion of contrast-enhancing viable tumor that demonstrated reduced ADC, which would exclude tissue with significant radiation necrosis and edema from the analyses. Finally, while our study demonstrates improved tumor contrast and reduced sensitivity to edema on RSI-CMs compared with high-b-value DWI and ADC, our analyses were based on averaging signal characteristic across high-grade primary and metastatic tumors. Further study is needed to systematically evaluate RSI cellularity biomarkers across tumor types in addition to postoperative histopathologic validation of cellularity signals.
Conclusions
RSI-CMs offer improved conspicuity and delineation of high-grade primary and metastatic brain tumors and reduced sensitivity to edema compared with high-b-value DWI and ADC, which may facilitate earlier detection of residual, recurrent, and infiltrating brain tumors.
Supplementary Material
Acknowledgments
We thank the patients and staff at the University of California, San Diego, Neuro-Oncology Program for their generous participation.
ABBREVIATIONS:
- AUC
area under the receiver operating characteristic curve
- EC
edema conspicuity
- RSE
relative sensitivity to edema
- RSI
restriction spectrum imaging
- RSI-CM
RSI cellularity map
- TC
tumor conspicuity
Footnotes
Disclosures: Anders M. Dale—RELATED: Other: University of California, San Diego (UCSD), General Electric Medical Systems, Comments: The methods described in the article are covered by patent applications filed through UCSD, of which I am an Inventor. The relevant patents have been licensed to GE Healthcare, Grants/Grants Pending: National Institutes of Health,* Patents (planned, pending, or issued): UCSD,* Massachusetts General Hospital/Harvard,* Comments: various, Stock/Stock Options: CorTechs Labs, Comments: I am a founder of and equity holder in CorTechs Labs Inc and serve on its Scientific Advisory Board. The terms of this arrangement have been reviewed and approved by the University of California, San Diego, in accordance with its conflict-of-interest policies, Other: GE Healthcare, * Comments: I am the principal investigator of a sponsored research agreement between UCSD and General Electric Medical Systems. *Money paid to the institution.
This work was funded by National Institutes of Health grants R01AG031224, R01EB000790 (A.M.D.), RC2 DA29475 (A.M.D.), EB00790-06 (A.M.D.), R01NS065838 (C.R.M.), and 3P30CA023100-25S8 (S.K.)
None of the authors have any personal or institutional financial interest in drugs, materials, or devices described in this submission.
References
- 1. Le Bihan D. Molecular diffusion nuclear magnetic resonance imaging. Magn Reson Q 1991;7:1–30 [PubMed] [Google Scholar]
- 2. Lutsep HL, Albers GW, DeCrespigny A, et al. Clinical utility of diffusion-weighted magnetic resonance imaging in the assessment of ischemic stroke. Ann Neurol 1997;41:574–80 [DOI] [PubMed] [Google Scholar]
- 3. Kono KY, Inoue K, Nakayama, et al. The role of diffusion-weighted imaging in patients with brain tumors. AJNR Am J Neuroradiol, 2001;22:1081–88 [PMC free article] [PubMed] [Google Scholar]
- 4. Krabbe KP, Gideon P, Wagn P, et al. MR diffusion imaging of human intracranial tumours. Neuroradiology 1997;39:483–89 [DOI] [PubMed] [Google Scholar]
- 5. Sundgren PC, Fan X, Weybright P, et al. Differentiation of recurrent brain tumor versus radiation injury using diffusion tensor imaging in patients with new contrast-enhancing lesions. Magn Reson Imaging 2006;24:1131–42 [DOI] [PubMed] [Google Scholar]
- 6. Sugahara T, Korogi Y, Kochi M, et al. Usefulness of diffusion-weighted MRI with echo-planar technique in the evaluation of cellularity in gliomas. J Magn Reson Imaging 1999;9:53–60 [DOI] [PubMed] [Google Scholar]
- 7. Chen J, Xia J, Zhou YC, et al. Correlation between magnetic resonance diffusion weighted imaging and cell density in astrocytoma [in Chinese]. Zhonghua Zhong Liu Za Zhi 2005;27:309–11 [PubMed] [Google Scholar]
- 8. Guo AC, Cummings TJ, Dash RC, et al. Lymphomas and high-grade astrocytomas: comparison of water diffusibility and histologic characteristics. Radiology 2002;224:177–83 [DOI] [PubMed] [Google Scholar]
- 9. Maier SE, Sun Y, Mulkern RV. Diffusion imaging of brain tumors. NMR Biomed 2010;23:849–64 [DOI] [PMC free article] [PubMed] [Google Scholar]
- 10. Chenevert TL, Sundgren PC, Ross BD. Diffusion imaging: insight to cell status and cytoarchitecture. Neuroimaging Clin N Am 2006;16:619–32, viii–ix [DOI] [PubMed] [Google Scholar]
- 11. Nicholson C. Factors governing diffusing molecular signals in brain extracellular space. J Neural Transm 2005;112:29–44 [DOI] [PubMed] [Google Scholar]
- 12. White NT, Leergaard H, D'Arceuil J, et al. Probing tissue microstructure with restriction spectrum imaging: histological and theoretical validation. Human Brain Mapping. Available at: http://onlinelibrary.wiley.com/doi/10.1002/hbm.21454/abstract [DOI] [PMC free article] [PubMed]
- 13. Frank LR. Characterization of anisotropy in high angular resolution diffusion-weighted MRI. Magn Reson Med 2002;47:1083–99 [DOI] [PubMed] [Google Scholar]
- 14. Wedeen VJ, Hagmann P, Tseng WY, et al. Mapping complex tissue architecture with diffusion spectrum magnetic resonance imaging. Magn Reson Med 2005;54:1377–86 [DOI] [PubMed] [Google Scholar]
- 15. Tuch DS. Q-ball imaging. Magn Reson Med 2004;52:1358–72 [DOI] [PubMed] [Google Scholar]
- 16. Maier SE, Bogner P, Bajzik G, et al. Normal brain and brain tumor: multicomponent apparent diffusion coefficient line scan imaging. Radiology 2001;219:842–49 [DOI] [PubMed] [Google Scholar]
- 17. Bennett KM, Schmainda KM, Bennett RT, et al. Characterization of continuously distributed cortical water diffusion rates with a stretched-exponential model. Magn Reson Med 2003;50:727–34 [DOI] [PubMed] [Google Scholar]
- 18. Jensen JH, Helpern JA, Ramani A, et al. Diffusional kurtosis imaging: the quantification of non-gaussian water diffusion by means of magnetic resonance imaging. Magn Reson Med 2005;53:1432–40 [DOI] [PubMed] [Google Scholar]
- 19. Mulkern RV, Haker SJ, Maier SE. On high b diffusion imaging in the human brain: ruminations and experimental insights. Magn Reson Imaging 2009;27:1151–62 [DOI] [PMC free article] [PubMed] [Google Scholar]
- 20. Mulkern RV, Gudbjartsson H, Westin CF, et al. Multi-component apparent diffusion coefficients in human brain. NMR Biomed 1999;12:51–62 [DOI] [PubMed] [Google Scholar]
- 21. Holland D, Kuperman JM, Dale AM. Efficient correction of inhomogeneous static magnetic field-induced distortion in echo planar imaging. Neuroimage 2010;50:175–83 [DOI] [PMC free article] [PubMed] [Google Scholar]
- 22. Gerstner ER, Chen PJ, Wen PY, et al. Infiltrative patterns of glioblastoma spread detected via diffusion MRI after treatment with cediranib. Neuro Ooncol 2010;12:466–72 [DOI] [PMC free article] [PubMed] [Google Scholar]
- 23. Provenzale JM, McGraw P, Mhatre P, et al. Peritumoral brain regions in gliomas and meningiomas: investigation with isotropic diffusion-weighted MR imaging and diffusion-tensor MR imaging. Radiology 2004;232:451–60 [DOI] [PubMed] [Google Scholar]
- 24. Bastin ME, Sinha S, Whittle IR, et al. Measurements of water diffusion and T1 values in peritumoural oedematous brain. Neuroreport 2002;13:1335–40 [DOI] [PubMed] [Google Scholar]
- 25. Chiang IC, Kuo YT, Lu CY, et al. Distinction between high-grade gliomas and solitary metastases using peritumoral 3-T magnetic resonance spectroscopy, diffusion, and perfusion imagings. Neuroradiology 2004;46:619–27 [DOI] [PubMed] [Google Scholar]
- 26. Lu S, Ahn D, Johnson G, et al. Peritumoral diffusion tensor imaging of high-grade gliomas and metastatic brain tumors. AJNR Am J Neuroradiol 2003;24:937–41 [PMC free article] [PubMed] [Google Scholar]
- 27. Tsuchiya K, Fujikawa A, Nakajima M, et al. Differentiation between solitary brain metastasis and high-grade glioma by diffusion tensor imaging. Br J Radiol 2005;78:533–37 [DOI] [PubMed] [Google Scholar]
Associated Data
This section collects any data citations, data availability statements, or supplementary materials included in this article.


