

Abstract
We examined epigenetic regulation in regards to behaviorally and clinically relevant human brain function. Specifically, we found that increased promoter methylation of the serotonin transporter gene predicted increased threat-related amygdala reactivity and decreased mRNA expression in postmortem amygdala tissue. These patterns were independent of functional genetic variation in the same region. Furthermore, the association with amygdala reactivity was replicated in a second cohort and was robust to both sampling methods and age.
The systematic integration of human molecular genetics and in vivo neuroimaging have contributed to our increasing understanding of how DNA sequence-based genetic variation shapes individual differences in brain function, complex behavioral traits, and related risk for psychopathology1. Parallel research in animal models has highlighted a critical role for non-sequence-based epigenetic variation in the emergence of individual differences in brain function and risk-related behavior2. The importance of similar epigenetic mechanisms for behaviorally and clinically relevant brain function in humans has yet to be fully explored.
We used bisulfite sequencing to determine percent methylation of the proximal promoter region of SLC6A4 in saliva-derived DNA from a Discovery cohort of 80 young adults and blood-derived DNA from an independent Replication cohort of 96 adolescents. We targeted SLC6A4 because it encodes the serotonin transporter, which plays an important role in modulating brain function and behavior by regulating the duration and intensity of synaptic serotonin signaling. Dysfunction of the serotonin transporter is also implicated in the pathophysiology of mood and anxiety disorders,3 and pharmacologic blockade of this molecule is the primary mode of treating these same disorders.
We focused our analyses on the 20 CpG sites closest to the transcription start site (TSS) of SLC6A4 exhibiting substantial variability across individuals (Table 1; Supplementary Fig. 1a–b). Additional proximal promoter sites were excluded due to virtually no variability across individuals (Supplementary Table 1). In light of recent work suggesting methylation immediately downstream of the TSS may also impact transcription4, we sampled additional CpG sites up to 119 base pairs downstream of the TSS, spanning exon 1 and intron 1 (Supplementary Table 1), whose effects were investigated in separate control analyses.
Table 1.
Summary of results from linear regression models predicting in vivo amygdala reactivity and amygdala tissue SLC6A4 mRNA from percent methylation levels at each of the 20 individual proximal promoter CpG sites sampled across the Discovery, Replication and postmortem cohorts. Results from the in vivo imaging cohorts are not adjusted for covariates. In light of gender, age, pH, postmortem interval, and RNA ratio effects in the postmortem cohort, the results for the postmortem findings are adjusted for covariates. The CpG site numbering scheme reflects the ordering of CpG site within this proximal promoter region and has no relation to any unique CpG site numerical identifiers. All significant p values are highlighted in bold.
| Discovery Cohort (DNS) | Replication Cohort (TAOS) | Postmortem | |||||||||
|---|---|---|---|---|---|---|---|---|---|---|---|
| Left Amygdala | Right Amygdala | Left Amygdala | Right Amygdala | Amygdala SLC6A4 mRNA |
|||||||
| CpG site |
Distance to TSS |
b | p | b | p | b | p | b | p | b | p |
| 1 | −69 | 0.163 | 0.149 | 0.180 | 0.11 | 0.112 | 0.278 | −0.061 | 0.556 | −0.073 | 0.707 |
| 2 | −72 | 0.263 | 0.018 | 0.125 | 0.269 | 0.207 | 0.043 | 0.068 | 0.511 | −0.043 | 0.837 |
| 3 | −99 | 0.094 | 0.409 | 0.052 | 0.647 | 0.119 | 0.248 | 0.148 | 0.15 | 0.118 | 0.540 |
| 4 | −112 | 0.224 | 0.046 | 0.279 | 0.012 | 0.107 | 0.297 | 0.130 | 0.208 | −0.079 | 0.752 |
| 5 | −133 | 0.102 | 0.368 | 0.138 | 0.223 | 0.229 | 0.025 | 0.070 | 0.500 | −0.128 | 0.601 |
| 6 | −135 | 0.224 | 0.046 | 0.260 | 0.02 | 0.129 | 0.209 | −0.106 | 0.306 | 0.104 | 0.630 |
| 7 | −139 | 0.069 | 0.544 | 0.191 | 0.089 | 0.164 | 0.109 | −0.019 | 0.856 | −0.271 | 0.169 |
| 8 | −141 | 0.026 | 0.818 | 0.048 | 0.672 | 0.010 | 0.921 | 0.020 | 0.846 | −0.006 | 0.975 |
| 9 | −147 | 0.128 | 0.258 | 0.058 | 0.608 | 0.196 | 0.056 | −0.056 | 0.587 | 0.022 | 0.920 |
| 10 | −149 | 0.280 | 0.012 * | 0.225 | 0.045 | 0.134 | 0.193 | 0.085 | 0.411 | 0.070 | 0.708 |
| 11 | −155 | 0.186 | 0.099 | 0.240 | 0.032 | 0.214 | 0.037 | 0.133 | 0.195 | 0.088 | 0.683 |
| 12 | −170 | 0.162 | 0.151 | 0.144 | 0.204 | 0.264 | 0.009 | 0.070 | 0.496 | −0.223 | 0.301 |
| 13 | −174 | 0.245 | 0.028 | 0.219 | 0.051 | 0.273 | 0.007 | 0.213 | 0.037 | 0.071 | 0.702 |
| 14 | −188 | −0.029 | 0.799 | 0.287 | 0.010 * | 0.305 | 0.003 * | 0.219 | 0.032 * | −0.378 | 0.039 * |
| 15 | −190 | 0.157 | 0.164 | 0.164 | 0.146 | 0.218 | 0.033 | 0.097 | 0.345 | −0.013 | 0.943 |
| 16 | −195 | 0.094 | 0.407 | −0.103 | 0.363 | 0.226 | 0.027 | 0.037 | 0.722 | 0.177 | 0.407 |
| 17 | −200 | 0.006 | 0.955 | −0.107 | 0.343 | 0.082 | 0.424 | 0.004 | 0.965 | 0.166 | 0.495 |
| 18 | −207 | 0.148 | 0.189 | 0.091 | 0.423 | 0.226 | 0.027 | 0.014 | 0.893 | −0.032 | 0.865 |
| 19 | −209 | 0.119 | 0.294 | −0.059 | 0.602 | 0.235 | 0.021 | 0.029 | 0.782 | −0.082 | 0.671 |
| 20 | −213 | 0.100 | 0.376 | −0.057 | 0.616 | 0.115 | 0.263 | −0.116 | 0.261 | −0.729 | 0.472 |
CpG site with strongest association for each phenotype.
We evaluated the relationship between SLC6A4 proximal promoter methylation and threat-related amygdala reactivity assayed using blood oxygen level dependent (BOLD) functional magnetic resonance imaging (fMRI). We selected this neural phenotype as a measure of behaviorally and clinically relevant brain function because it is clearly involved in the emergence of both normal and pathologic emotional behaviors5, 6. Importantly, these behaviors include responsiveness to environmental and social stress, which is associated not only with epigenetic modification7 but also variability in serotonin signaling8. Moreover, there is now ample evidence linking variability in serotonin signaling with individual differences in amygdala reactivity5, 9, 10.
In our Discovery cohort, percent methylation of the SLC6A4 proximal promoter was positively correlated with threat-related amygdala reactivity in the left hemisphere (Adj. R2 = 0.067, b = 0.282, p = 0.011; Fig. 1a–b). This effect was observed at a trend level in the right hemisphere (Adj. R2 = 0.032, b = 0.211, p = 0.060). Percent methylation continued to account for significant variability in left amygdala reactivity even when controlling for possible effects of gender, age, early and recent life stress, and current psychiatric disorder (left hemisphere: ΔR2 = 0.084, b = 0.292, p = 0.009; right hemisphere: ΔR2 = 0.045, b = 0.214, p = 0.060). Similar results were obtained when using the top principal component (PC) capturing 24% of the methylation variance in the same region (Supplementary Tables 2 and 3; Supplementary Fig. 2a–b). In an exploratory follow-up analysis we probed the effects of individual CpG site methylation levels on these same phenotypes and found that CpG 14 (188 base pairs upstream of TSS) showed strongest association effects across both hemispheres (Table 1).
Figure 1.
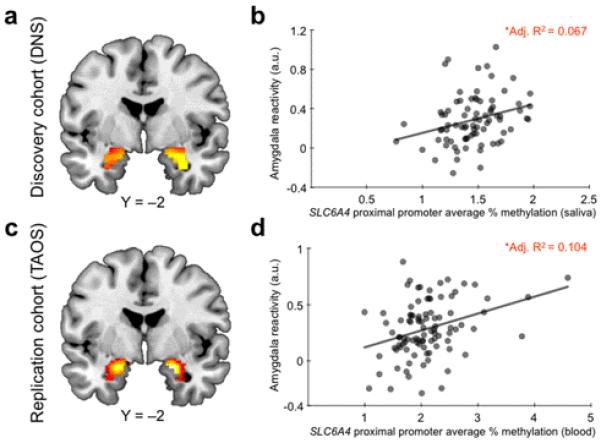
Effects of SLC6A4 promoter methylation on amygdala reactivity. Statistical parametric map illustrating mean bilateral threat–related amygdala reactivity across all participants in the (a) Discovery cohort (left: × = −24, y = −8, z = −16, t = 10.29, p = 2.0095 × 10⁻¹⁴, kE = 180; right: × = 30, y = −4, z = −20, t = 11.13, p < 0.00001, kE = 203) and (c) Replication cohort (left: × = −20, y = −4, z = −18, t = 11.29, p < 0.00001, kE = 197; right: × = 20, y = −4, z = −16, t = 11.80, p = 1.29 × 10⁻¹³, kE = 205). Activation clusters are overlaid onto canonical structural brain images in the coronal plane (Y = −2). Average percent SLC6A4 proximal promoter methylation was positively correlated with reactivity of the left amygdala in both the Discovery (b) and Replication cohort (d).
a.u.= arbitrary units.
*p < 0.05
Given prior work establishing predictive links between genetic variation and amygdala reactivity1, we next compared the effect of SLC6A4 proximal promoter methylation on amygdala reactivity to that of the serotonin transporter linked polymorphic region (5-HTTLPR) and rs25531, which together define a functional tri-allelic polymorphism previously associated with variability in amygdala reactivity as well as responsiveness to stress3. SLC6A4 methylation continued to predict amygdala reactivity even when 5-HTTLPR/rs25531 genotype was accounted for alongside all other covariates (left hemisphere: ΔR2 = 0.086, b = 0.296, p = 0.009; right hemisphere: ΔR2 = 0.043, b = 0.211, p = 0.066). This suggests preponderance of epigenetic variation over sequence-based variation in regulatory regions of the same gene.
As a negative control, we examined the correlation between amygdala reactivity and methylation in other regions of SLC6A4 as well as the COMT gene, which codes for an enzyme responsible for regulating catecholamine but not serotonin signaling. As expected, there were no significant correlations between left or right amygdala reactivity and percent methylation of either intron 1 or exon 1 of SLC6A4 (p > 0.10). Similarly, there were also no significant correlations between reactivity and percent promoter methylation of COMT (p > 0.50, Supplementary Table 4). Thus, these data reveal a specific effect of SLC6A4 proximal promoter methylation on amygdala reactivity. Given the specificity of these findings, we followed up the effects of these same 20 CpG sites in our Replication cohort.
Consistent with the findings from our Discovery cohort, we found that percent promoter methylation of SLC6A4, this time assayed in DNA derived from peripheral blood, was positively correlated with left amygdala reactivity in our Replication cohort (Adj. R2 = 0.104, b = 0.336, p = 0.001; Fig. 1c–d). In fact, this effect of percent methylation was larger than that accounted for in our Discovery cohort (10.4% vs 6.7%). The effect was again weaker in the right hemisphere (Adj. R2 = 0.007, b = 0.084, p = 0.42). Such hemispheric asymmetries are not uncommon in the imaging genetics literature9, 10 and may reflect task-specific characteristics11 or intrinsic differences in monoamine signaling between the two hemispheres12.
Notably, the effects in our Replication cohort remained unchanged when controlling for age, gender, early life stress, risk for psychiatric disorder, and 5-HTTLPR/rs25531 genotype (left hemisphere: ΔR2 = 0.090, b = 0.312, p = 0.005; right hemisphere: ΔR2 = 0.002, b = 0.049, p = 0.662). These results were confirmed using the first PC capturing 30.41% of all methylation variance in the region (Supplementary Tables 5 and 6; Supplementary Fig. 2c–d). Finally, as in the Discovery cohort, the single site showing strongest correlations with amygdala reactivity across hemispheres was CpG 14 (Table 1).
The direction of the effects we observe in our in vivo data (higher reactivity with greater percent methylation) is remarkably consistent with that of prior imaging genetics5, 9, multi-modal PET/fMRI10, 13, and pharmacologic fMRI14, 15 studies linking relatively increased serotonin signaling with increased amygdala reactivity, as well as observations that methylation within or near promoter regions generally inhibits gene transcription4. In light of these data and to gain further mechanistic insight into our in vivo findings, we examined the impact of percent methylation of the same 20 CpG sites sampled in our imaging cohorts on serotonin transporter mRNA levels in postmortem amygdala tissue from a third independent cohort of 34 individuals.
As expected, clinical and biochemical parameters (i.e., diagnostic status, pH, and RNA ratio) influenced mRNA levels (p values < 0.091). Thus, these were included as covariates alongside age, gender and postmortem interval in all analyses involving postmortem data. When controlling for the effects of these parameters, there was no significant association between overall percent methylation and mRNA in amygdala tissue (p = 0.699). However, a site-specific investigation revealed a significant negative correlation between mRNA levels and percent methylation at CpG 14, which exhibited the strongest correlation with amygdala reactivity in both our imaging cohorts (Table 1; Fig. 2). As with our in vivo imaging data, this epigenetic effect was further independent of 5-HTTLPR/rs25531 genotype (p = 0.031), despite nominally lower mRNA levels in S/LG allele carriers (p = 0.291).
Figure 2.
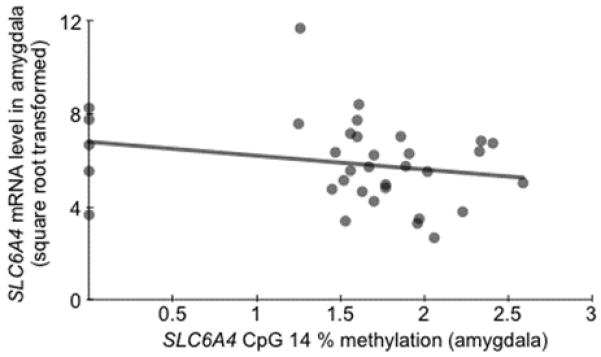
Effects of SLC6A4 promoter methylation on gene expression. There was a negative correlation between percent methylation at CpG 14 and SLC6A4 mRNA levels in amygdala tissue. Y-axis units are expressed as arbitrary signal (2-dCT × 10,000), square root transformed to normalize the distribution of the variable.
Collectively, our results converge to provide evidence that methylation of the proximal promoter of human SLC6A4 predicts threat-related amygdala reactivity possibly reflecting decreased serotonin transporter gene expression and, consequently, reduced regional serotonin reuptake. Moreover, theses epigenetic effects are independent of, and greater than, the effects of the 5-HTTLPR/rs25531 functional polymorphism near the same genomic region. Further demonstrating the independence of these genetic and epigenetic effects, none of the 20 proximal promoter CpG sites surveyed across the three cohorts overlap the 5-HTTLPR, which is located 1,400 base pairs upstream of the TSS and primarily impacts the distal promoter. In addition, 5-HTTLPR/rs25531 genotype had no effect on proximal promoter methylation in any cohort (p’s > 0.30).
While we do not directly map methylation in peripheral tissues onto methylation levels in brain within the same cohort, cross-cohort convergence among tissues (saliva, blood, brain) is consistent with recent work demonstrating a significant correlation between the blood and brain methylomes16. Furthermore, prior work has mapped variability in a similar range of SLC6A4 promoter methylation values onto individual differences in serotonin biosynthesis in vivo17. Finally, the cross-tissue convergence we observe provides evidence that two distinct types of readily assayed peripheral tissues (blood and saliva) could potentially be used as equally valid proxies of neural tissue. A notable limitation of the current work is that, due to practical constraints, the postmortem tissue analysis was limited to the amygdala, while more informative differences in SLC6A4 transcript levels are likely to emerge in the dorsal raphe nucleus, where the serotonin transporter is more densely expressed. This limitation notwithstanding, our current results demonstrate that meaningful links between the human epigenome and brain can be mapped using DNA derived from readily assayed peripheral tissues. In addition to encouraging careful consideration of the effects of promoter methylation in SLC6A4 on behaviorally and clinically relevant brain function, we hope that our current work will advance broader research on epigenetic mechanisms in the emergence of individual differences in human behavior and related risk for psychopathology.
Methods
Participants
Discovery cohort
The first 91 Caucasian participants (47 women; mean age 19.66±1.36) to complete the ongoing Duke Neurogenetics Study (DNS) were selected for inclusion in analyses involving methylation assays. The DNS assesses a range of behavioral and biological traits among young adult, student volunteers. All participants provided informed consent in accord with Duke University guidelines, and were in good general health. Two participants’ samples displayed wrong sequence patterns for our SLC6A4 promoter assays due to unknown mutations or equipment dispensation error and were thus excluded for this analysis. Nine additional participants were excluded due to task non-compliance or response box failure leaving a final sample of 80 individuals (42 women; mean age 19.74 ± 1.33).
All participants were free of the following study exclusions: (1) medical diagnoses of cancer, stroke, diabetes requiring insulin treatment, chronic kidney or liver disease, or lifetime history of psychotic symptoms; (2) use of psychotropic, glucocorticoid, or hypolipidemic medication; and (3) conditions affecting cerebral blood flow and metabolism (e.g., hypertension). Diagnosis of any current DSM-IV Axis I disorder or select Axis II disorders (Antisocial Personality Disorder and Borderline Personality Disorder), assessed with the electronic Mini International Neuropsychiatric Interview18 and Structured Clinical Interview for the DSM-IV (SCID) subtests19, respectively, were not an exclusion as the DNS seeks to establish broad variability in multiple behavioral phenotypes related to psychopathology. However, all participants were medication-free at the time of the study. No participants met criteria for either Antisocial or Borderline Personality Disorder, and 16 participants from our final sample (N = 80) met criteria for at least one Axis I disorder. Since the exclusion of these individuals did not substantially alter our results, we present data from the entire sample in the main text (specific diagnoses available upon request). In addition, all analyses were conducted both with and without current diagnosis as a covariate (dummy coded: 0 = no psychopathology, 1 = meeting criteria for one or more psychiatric disorders).
Replication cohort
Our Replication cohort was drawn from among children and adolescents (N=323, 11-15 years old) participating in the Teen Alcohol Outcomes Study (TAOS) at the University of Texas Health Science Center at San Antonio (UTHSCSA). This ongoing longitudinal study aims to investigate how individual differences in genetic background, environmental experience, and neural function contribute to the emergence of psychopathology, with an emphasis on alcohol use disorders. The current analysis focused on 96 participants (48 girls, mean age 13.62 ± 0.99) who were of Caucasian origin and who had high quality fMRI data in the first wave of neuroimaging. The study was approved by the institutional review board at UTHSCSA. Consent for study participation was obtained from participants’ parents or guardians. Under age participants provided assent.
Postmortem cohort
The demographic and clinical parameters of the cohort and technical parameters of the samples have been described in detail previously20. All procedures involving this cohort were approved by the University of Pittsburgh’s Committee for the Oversight of Research Involving the Dead and Institutional Review Board for Biomedical Research. Consent was obtained from each subject’s next of kin. For all subjects, consensus DSM-IV diagnoses of MDD were made by an independent committee of experienced clinical research scientists at a case conference utilizing information obtained from clinical records, toxicology exam and a standardized psychological autopsy21. The latter incorporates a structured interview, conducted by a licensed clinical psychologist with family members of the index subject, to assess diagnosis, psychopathology, medical, social and family histories, as well as history of substance abuse. All subjects died suddenly without prolonged agonal periods. For consistency across samples and to minimize population stratification and pharmacologic confounds, we focused our analysis on Caucasian individuals and excluded those with ascertained medication use at time of death (ascertained by toxicology screen on peripheral tissue), leaving a final sample of 35 (10 women, mean age 49.57 ± 11.87, range 22-69). Brains were analyzed for adequate pH (>6.0) and RNA integrity by optical density (RNA ratio; OD ≥ 1.3) and Agilent bioanalyzer analysis (Agilent Technologies, Palo Alto, CA; RIN expert scoring system ≥ 7) as described.20 Gender, age, MDD vs. control status, pH, RNA ratio and post mortem interval were controlled for in all analyses involving this sample. A square root transformation was applied to SLC6A4 mRNA levels to normalize its positively skewed and kurtotic distribution (pre-transformation skewness = 1.92, kurtosis = 6.45, post-transformation skewness = 0.65, kurtosis = 1.43).
Neuroimaging Methods
BOLD fMRI task
As described previously22, the amygdala reactivity paradigm used in the Discovery cohort (DNS) consists of 4 blocks of a face-processing task interleaved with 5 blocks of a sensorimotor control task. During task blocks, participants view a trio of faces (with neutral, angry, fearful or surprised expressions) and match 1 of 2 faces (bottom) identical to a target face (top). During control blocks, participants match simple geometric shapes. In the Replication cohort (TAOS), the task consisted only of Angry and Fearful Faces. Thus, for consistency between samples, we focused our analyses on the Anger + Fear > Shapes contrast in our Discovery cohort. Performance was monitored and participants with accuracy < 75% were excluded from analysis.
BOLD fMRI data acquisition
Participants in the Discovery cohort were scanned using a research-dedicated GE MR750 3T scanner equipped with high-power high-duty-cycle 50-mT/m gradients at 200 T/m/s slew rate, and an eight-channel head coil for parallel imaging at high bandwidth up to 1MHz at the Duke-UNC Brain Imaging and Analysis Center. A semi-automated high-order shimming program was used to ensure global field homogeneity. A series of 34 interleaved axial functional slices aligned with the anterior commissure-posterior commissure (AC-PC) plane were acquired for full-brain coverage using an inverse-spiral pulse sequence to reduce susceptibility artifact (TR/TE/flip angle = 2000ms/30ms/60; FOV = 240 mm; 3.75 × 3.75 × 4 mm voxels; interslice skip = 0). Four initial RF excitations were performed (and discarded) to achieve steady-state equilibrium. To allow for spatial registration of each participant’s data to a standard coordinate system, high-resolution three-dimensional structural images were acquired in 34 axial slices co-planar with the functional scans (TR/TE/flip angle = 7700ms/3.0 ms/12; voxel size = 0.9 × 0.9 × 4 mm; FOV = 240 mm, interslice skip = 0).
Participants in the Replication cohort were scanned on a Siemens 3T Trio Scanner at the UTHSCSA. BOLD fMRI data were acquired with a gradient-echo echo planar imaging (EPI) sequence (TR/TE/flip angle = 2000ms/25ms/70; FOV = 256mm, 2.00 × 2.00 × 3.00mm voxels, interslice skip = 0) covering 34 interleaved 3 mm-thick axial slices. As in the Discovery cohort, high-resolution three-dimensional structural images were acquired in 34 axial slices co-planar with the functional scans (TR/TE/flip angle = 5610ms/72ms/150; voxel size = 0.8 × 0.8 × 3 mm; FOV = 220 mm × 320 mm, interslice skip = 0).
BOLD fMRI data preprocessing
The same data preprocessing steps were applied to both the Discovery and the Replication cohort. Briefly, images for each subject were realigned to the first volume in the time series to correct for head motion, spatially normalized into a standard stereotaxic space (Montreal Neurological Institute template) using a 12-parameter affine model (final resolution of functional images=2 mm isotropic voxels), and smoothed to minimize noise and residual difference in gyral anatomy with a Gaussian filter, set at 6-mm full-width at half-maximum. Voxel-wise signal intensities were ratio normalized to the whole-brain global mean.
Variability in single-subject whole-brain functional volumes was determined using the Artifact Recognition Toolbox (http://www.nitrc.org/projects/artifact_detect). Individual whole-brain BOLD fMRI volumes meeting at least one of two criteria were assigned a lower weight in determination of task-specific effects: 1) significant mean-volume signal intensity variation (i.e., within volume mean signal greater or less than 4 standard deviations of mean signal of all volumes in time series), and 2) individual volumes where scan-to-scan movement exceeded 2 mm translation or 2° rotation in any direction.
BOLD fMRI data analysis
The general linear model (GLM) of SPM8 (http://www.fil.ion.ucl.ac.uk/spm) was used to conduct fMRI data analyses. Linear contrasts employing canonical hemodynamic response functions were used to estimate differential effects of condition from the contrast of Faces > Shapes for each individual. Individual contrast images were then used in second-level random effects models accounting for scan-to-scan and participant-to-participant variability to determine mean condition-specific regional responses using one-sample t-tests. Regions of interest (ROIs) masks for the bilateral amygdala were constructed using the automatic anatomical labeling (AAL) within WFU PickAtlas Tool, version 1.04. A statistical threshold of p < 0.05, FWE corrected, and ≥10 contiguous voxels was applied to amygdala analyses within each hemisphere. BOLD values from voxels within the amygdala exhibiting strongest main effect of task were extracted using the VOI tool in SPM8.
These extracted values were then entered into regression models using IBM SPSS Statistics 20.0 (SPSS Inc., Chicago, IL). Importantly, by extracting amygdala BOLD parameter estimates from the voxels activated by our paradigm rather than clusters specifically correlated with our independent variables of interest, we preclude the possibility of any regression coefficient inflation that may result from capitalizing on the same data twice23. We have successfully used this conservative strategy in previous reports24-26.
RNA Processing and Quantitative Real-time PCR
Total RNA was isolated from TRIzol homogenates of the amygdala in all postmortem subjects. The samples were purified using RNeasy spin columns (Qiagen; Valencia, CA), and RNA integrity was assessed using the Agilent 2100 Bioanalyzer (Agilent Technologies, Walbronn, Germany). cDNA was generated by mixing 1 μg total RNA with oligo-dT primers and SuperScript II reverse transcriptase (Invitrogen, Carlsbad, CA) per the manufacturer’s protocol. PCR products were amplified in quadruplets on a Mastercycler real-time PCR machine (Eppendorf, Hamburg, Germany) using universal PCR conditions, as described previously27. Results were calculated as the geometric mean of threshold cycles of SLC6A4 transcript amplification normalized to three validated internal controls (actin, glyceraldehyde-3-phosphate dehydrogenase, and cyclophilin G). Although performed in serotonergic projection areas, SLC6A4 transcripts are readily detectable by qPCR.
DNA Extraction and 5-HTTLPR/rs25531 Genotyping
Saliva samples from Discovery cohort participants were collected using Oragene kits and DNA was extracted in accordance with the manufacturer’s guidelines (Oragene, Genotek, Toronto, Ontario). In the Replication cohort, DNA was extracted from whole blood. Postmortem brain DNA was isolated using the DNeasy Blood and Tissue kit (Qiagen, Valencia, CA), using a protocol that was modified from manufacturers’ instructions (additional proteinase K and RNase A).
The same 5-HTTLPR/rs25531 genotyping protocol was applied to DNA samples from all three cohorts. Primer sequences for genotyping 5-HTTLPR are described previously28, the forward primer having the sequence (5′- ATGCCAGCACCTAACCCCTAATGT-3′) and the reverse (5′-GGACCGCAAGGTGGGCGGGA-3′). PCR was conducted using the following cycling conditions: initial 15-min denaturing step at 95°C, followed by 35 cycles of 94°C for 30 sec, 66°C for 30 sec and 72°C for 40 sec, and a final extension phase of 72°C for 15 min. Reactions were performed in 10X reaction Buffer IV (ABgene), 1.5mM MgCl2, 50ng of genomic DNA, 5pmols of each primer, 0.3mM dNTPs and 1 unit of Native Taq (Promega). PCR products were subsequently digested by MspI restriction enzyme for 4 hours at 37°C. The digestion products were separated on a 3% agarose gel (MultiABgarose, ABgene) supplemented with Ethidium bromide (0.03%, BDH) and visualized by ultraviolet transillumination. Genotype calls were made by three independent raters, who reached consensus on 100% of the Discovery and Replication cohort samples. Genotype could not be determined accurately for one postmortem sample. Thus, it was removed from analysis, leaving a final sample of 34 individuals (10 women, mean age 49.44 ± 12.02).
DNA Methylation Analyses by Quantitative Bisulfite Pyrosequencing
Discovery cohort
DNA methylation levels of the proximal promoter of the serotonin transporter gene in the Discovery cohort were determined using quantitative bisulfite Pyrosequencing by EpigenDx Inc (Worcester, MA). Briefly, the human serotonin transport gene (SLC6A4) proximal promoter methylation assays analyze 20 CpG dinucleotides in the promoter region from −213 to −69 base pairs of the transcriptional start site (TSS), based on Ensembl Gene ID ENSG00000108576 and the Transcript ID ENST00000394821. The SLC6A4 promoter assays (ADS580-FS1 and ADS580-FS2) are targeted to the antisense sequence of SLC6A4 gene. The targeted CpG loci are listed in Supplementary Table 1, along with their genomic location and position relative to the translational start site. The target sequences (genomic DNA and bisulfite converted DNA) are available upon request.
For each analysis, the bisulfite conversion was performed with 500 ng provided genomic DNA using the EZ DNA methylation kit (ZymoResearch, Inc., CA). The PCR reaction was performed based on recommended assay conditions (EpigenDx, MA) using 0.2 μM of each primer with one of the PCR primers being biotinylated in order to purify the final PCR product using Sepharose beads. The PCR product was bound to Streptavidin Sepharose HP (Amersham Biosciences, Uppsala, Sweden), and the Sepharose beads containing the immobilized PCR product were purified, washed and denatured using 0.2 M NaOH solution and rewashed using the Pyrosequencing Vacuum Prep Tool (Pyrosequencing, Qiagen) as recommended by the manufacturer. 10 μl of the PCR products were sequenced by Pyrosequencing PSQ96 HS System (Pyrosequencing, Qiagen) following the manufacturer’s instructions (Pyrosequencing, Qiagen). The methylation status of each CpG site was analyzed individually as an artificial T/C SNP using QCpG software (Pyrosequencing, Qiagen).
The methylation level at each CpG site was calculated as the percentage of the methylated alleles over the sum of methylated and unmethylated alleles. The mean methylation level was calculated using methylation levels of all measured CpG sites within each targeted region. For quality control, each experiment included non-CpG cytosines as internal controls to verify efficient sodium bisulfite DNA conversion. We also included low, medium, high methylated standards (EpigenDx, MA) as controls in each run. In light of the low methylation values observed at some CpG sites (<4%) in the Discovery cohort, additional PCR bias testing was performed by EpigenDx for the entire ADS580 assay (i.e., all 20 CpG sites taken together), as well as individually for CpG 14. The bias testing was conducted by mixing the unmethylated DNA control and in vitro methylated DNA at different ratios (0%, 2.5%, 5%, 7.5%, 10%, 50% and 100%) followed by bisulfite modification, PCR and pyrosequencing analysis, which were run in triplicate. There was a high correlation between the percent methylation obtained from the mixing study and expected methylation percentages (r2>0.97), which confirms the quality of our data (Supplementary Fig. 1).
Replication and postmortem cohorts
In the Replication and postmortem cohorts, methylation analysis on the same SLC6A4 proximal promoter 20 CpG sites as targeted by the ADS580FS1 and ADS580FS2 assays was carried out at the Core for Advanced Translational Technologies (UTHSCSA). The protocol used was the same as in the Discovery cohort, except with independently designed PCR and sequencing primers (primer sequences available upon request). Results were analyzed using PyroMark Q96 MD and PyroMark CpG 1.0 software (Qiagen, Valencia, CA).
Control analyses conducted by EpigenDx only in the Discovery cohort used additional methylation assays in exon 1 and intron 1 of SLC6A4 (Supplementary Table 1), as well as the promoter region of the COMT gene (Supplementary Table 4). Detailed assay information is available upon request.
Self-Report Measures
To assess recent life stress we administered a modified version of the Life Events Scale for Students (LESS29). This modified version of the scale asks participants to indicate whether they experienced common stressful life events within the past 12 months; in addition, for each event that occurred participants reported on the impact it had on their lives on a 1-4 scale (with 4 being the highest). The impact scores were set to zero for events that did not occur. Based on prior research24, 29, we focused on the LESS Highest Impact metric, reflecting the highest impact associated with any event which occurred within the past year. We assessed early life trauma using the Childhood Trauma Questionnaire (CTQ30).
Statistical Analysis
Statistical analysis of methylation data
Percent methylation was computed as the ratio of methylation cytosines over the sum of all methylation and unmethylated cytosines. Our main analyses focused on two SLC6A4 promoter assays covering a total of 20 CpG sites sampled across all three cohorts (Table 1; Supplementary Table 1).
No single nucleotide polymorphisms (SNPs) resulting in CpG site gain or loss were identified within the assayed regions. In addition to analysis using average percent methylation across the 20 CpG sites in our region of interest, we applied principal component analysis (PCA) to these 20 CpG sites in both the Discovery and Replication cohorts. The unrotated correlation matrix was analyzed to output principal component scores. An eigenvalue greater than 1 indicates that PCs account for more variance than accounted by one of the original variables in standardized data. PCA resulted in five PCs with eigenvalues>1 in both samples. The first PC exhibited effects similar to those associated with SLC6A4 promoter methylation values averaged across all 20 CpG sites in both the Discovery and the Replication cohort (Supplementary Tables 2, 3, 5 and 6; Supplementary Fig. 1). In light of the smaller number of datapoints (n = 34 final sample), no PCA was performed in the postmortem cohort, where CpG sites were analyzed individually.
Linear regression models, as implemented in IBM SPSS Statistics 20.0 (Chicago, IL), were used to investigate the linear effect of methylation values (independent variable) on amygdala reactivity or SLC6A4 mRNA levels (dependent variables). Results from two-tailed tests are reported for all analyses.
Supplementary Material
Disclosures and acknowledgments
We thank Bartholomew Brigidi, Kelly Faig, Adam Gorka, Spenser Jacobson, Annchen Knodt, Ben Williams, and Karen Sugden for their assistance in DNS data collection and analysis, and Jamie Hanson for his assistance in figure preparation. The DNS is supported by Duke University and NIDA grant DA03369. The TAOS was supported by AA016274 and ongoing support from the Dielmann Family (D.E.W.). Y.S.N. receives support through a Howard Hughes Medical Institute International Student Research fellowship. A.R.H. receives support through NIDA grants DA033369 and DA031579. K.C.K. receives support through NIMH grants MH078928 and MH093612. E.S. receives support through NIMH grants MH084060 and MH077159.
Footnotes
The authors report no conflicts of interest.
A supplementary methods checklist is available.
Author Contributions Y.S.N. designed the study, participated in the collection of the neuroimaging and genetic data for the Discovery cohort, conducted all statistical analyses, and wrote the manuscript with A.R.H.
K.C.K. and S.G. designed and coordinated the methylation analyses in the Discovery cohort.
C. W. developed and performed the methylation assays in the Replication and Postmortem cohorts.
M.L.S. conducted the quantitative PCR in the Postmortem cohort.
E.S. designed the parent protocol, supervised quantitative PCR experiments, and coordinated methylation analyses in the Postmortem cohort.
D.E.W. designed the parent protocol for the Replication cohort and coordinated the methylation assays in both the Replication and Postmortem cohorts.
A.R.H. designed the study, coordinated all analyses, and wrote the manuscript with Y.S.N. He also designed the parent protocol for the Discovery cohort and the neuroimaging protocol for the Replication cohort.
All authors provided feedback on the manuscript and approved its final version.
References
- 1.Hariri AR. Annu. Rev. Neurosci. 2009;32:225–247. doi: 10.1146/annurev.neuro.051508.135335. [DOI] [PMC free article] [PubMed] [Google Scholar]
- 2.Meaney MJ, Szyf M. Dialogues Clin Neurosci. 2005;7:103–123. doi: 10.31887/DCNS.2005.7.2/mmeaney. [DOI] [PMC free article] [PubMed] [Google Scholar]
- 3.Caspi A, Hariri AR, Holmes A, Uher R, Moffitt TE. A. J. Psychiatry. 2010;167:509–527. doi: 10.1176/appi.ajp.2010.09101452. [DOI] [PMC free article] [PubMed] [Google Scholar]
- 4.Brenet F, et al. PloS one. 2011;6:e14524. doi: 10.1371/journal.pone.0014524. [DOI] [PMC free article] [PubMed] [Google Scholar]
- 5.Fakra E, et al. Arch. Gen. Psychiatry. 2009;66:33–40. doi: 10.1001/archpsyc.66.1.33. [DOI] [PMC free article] [PubMed] [Google Scholar]
- 6.Abercrombie HC, et al. Neuroreport. 1998;9:3301–3307. doi: 10.1097/00001756-199810050-00028. [DOI] [PubMed] [Google Scholar]
- 7.Mehta D, et al. Proc. Natl. Acad. Sci. U. S. A. 2013 [Google Scholar]
- 8.Chaouloff F. J Psychopharmacol. 2000;14:139–151. doi: 10.1177/026988110001400203. [DOI] [PubMed] [Google Scholar]
- 9.Hariri AR, et al. Science. 2002;297:400–403. doi: 10.1126/science.1071829. [DOI] [PubMed] [Google Scholar]
- 10.Fisher PM, et al. Nat. Neurosci. 2006;9:1362–1363. doi: 10.1038/nn1780. [DOI] [PubMed] [Google Scholar]
- 11.Baas D, Aleman A, Kahn RS. Brain Res. Brain Res. Rev. 2004;45:96–103. doi: 10.1016/j.brainresrev.2004.02.004. [DOI] [PubMed] [Google Scholar]
- 12.Young EJ, Williams CL. Behav. Neurosci. 2010;124:633–644. doi: 10.1037/a0020885. [DOI] [PubMed] [Google Scholar]
- 13.Rhodes RA, et al. J. Neurosci. 2007;27:9233–9237. doi: 10.1523/JNEUROSCI.1175-07.2007. [DOI] [PMC free article] [PubMed] [Google Scholar]
- 14.Bigos KL, et al. Neuropsychopharmacology. 2008;33:3221–3225. doi: 10.1038/npp.2008.52. [DOI] [PMC free article] [PubMed] [Google Scholar]
- 15.Di Simplicio M, Norbury R, Reinecke A, Harmer CJ. Psychol. Med. 2013:1–12. doi: 10.1017/S0033291713000731. [DOI] [PubMed] [Google Scholar]
- 16.Tylee DS, Kawaguchi DM, Glatt SJ. American journal of medical genetics. Part B, Neuropsychiatric genetics : the official publication of the International Society of Psychiatric Genetics. 2013;162B:595–603. doi: 10.1002/ajmg.b.32150. [DOI] [PubMed] [Google Scholar]
- 17.Wang D, et al. PloS one. 2012;7:e39501. doi: 10.1371/journal.pone.0039501. [DOI] [PMC free article] [PubMed] [Google Scholar]
- 18.Sheehan DV, et al. J. Clin. Psychiatry. 1998;59(Suppl 20):22–33. quiz 34-57. [PubMed] [Google Scholar]
- 19.First MB, Spitzer RL, Gibbon M, Williams JBM. Structured Clinical Interview for DSM-IV Axis I Disorders, Research Version, Non-patient Edition. New York State Psychiatric Institute, Biometrics Research Department; New York: 1996. [Google Scholar]
- 20.Sibille E, et al. A. J. Psychiatry. 2009;166:1011–1024. doi: 10.1176/appi.ajp.2009.08121760. [DOI] [PMC free article] [PubMed] [Google Scholar]
- 21.Glantz LA, Lewis DA. Arch. Gen. Psychiatry. 1997;54:943–952. doi: 10.1001/archpsyc.1997.01830220065010. [DOI] [PubMed] [Google Scholar]
- 22.Carre JM, Hyde LW, Neumann CS, Viding E, Hariri AR. Social neuroscience. 2013;8:122–135. doi: 10.1080/17470919.2012.703623. [DOI] [PMC free article] [PubMed] [Google Scholar]
- 23.Viviani R. Neuroimage. 2010;50:184–189. doi: 10.1016/j.neuroimage.2009.10.085. [DOI] [PubMed] [Google Scholar]
- 24.Nikolova YS, Hariri AR. Biology of mood & anxiety disorders. 2012;2:19. doi: 10.1186/2045-5380-2-19. [DOI] [PMC free article] [PubMed] [Google Scholar]
- 25.Nikolova YS, Ferrell RE, Manuck SB, Hariri AR. Neuropsychopharmacology. 2011;36:1940–1947. doi: 10.1038/npp.2011.82. [DOI] [PMC free article] [PubMed] [Google Scholar]
- 26.Carre JM, Fisher PM, Manuck SB, Hariri AR. Social cognitive and affective neuroscience. 2012;7:213–221. doi: 10.1093/scan/nsq101. [DOI] [PMC free article] [PubMed] [Google Scholar]
- 27.Tripp A, et al. A. J. Psychiatry. 2012;169:1194–1202. doi: 10.1176/appi.ajp.2012.12020248. [DOI] [PMC free article] [PubMed] [Google Scholar]
- 28.Gelernter J, Kranzler H, Cubells JF. Hum. Genet. 1997;101:243–246. doi: 10.1007/s004390050624. [DOI] [PubMed] [Google Scholar]
- 29.Nikolova YS, Bogdan R, Brigidi BD, Hariri AR. Biol. Psychiatry. 2012;72:157–163. doi: 10.1016/j.biopsych.2012.03.014. [DOI] [PubMed] [Google Scholar]
- 30.Bernstein D, Stein JA, Newcomb MD, Walker E, Pogge D, Ahluvalia T, Stokes J, Handelsman L, Medrano M, Desmond D, Zule W. Child Abuse Negl. 2002;27:169–190. doi: 10.1016/s0145-2134(02)00541-0. [DOI] [PubMed] [Google Scholar]
Associated Data
This section collects any data citations, data availability statements, or supplementary materials included in this article.