Abstract
One of the major aims of the International Union of Physiological Sciences (IUPS) Physiome Project is to develop multiscale mathematical and computer models that can be used to help understand human health. We present here a small facet of this broad plan that applies to the gastrointestinal system. Specifically, we present an anatomically and physiologically based modelling framework that is capable of simulating normal and pathological electrical activity within the stomach and small intestine. The continuum models used within this framework have been created using anatomical information derived from common medical imaging modalities and data from the Visible Human Project. These models explicitly incorporate the various smooth muscle layers and networks of interstitial cells of Cajal (ICC) that are known to exist within the walls of the stomach and small bowel. Electrical activity within individual ICCs and smooth muscle cells is simulated using a previously published simplified representation of the cell level electrical activity. This simulated cell level activity is incorporated into a bidomain representation of the tissue, allowing electrical activity of the entire stomach or intestine to be simulated in the anatomically derived models. This electrical modelling framework successfully replicates many of the qualitative features of the slow wave activity within the stomach and intestine and has also been used to investigate activity associated with functional uncoupling of the stomach.
Keywords: Model, Bidomain, Simulation, Interstitial cells of Cajal, Physiome, GIOME
INTRODUCTION
The concept of a “Physiome Project” was presented in a report from the Commission on Bioengineering in Physiology to the International Union of Physiological Sciences (IUPS) Council at the 32nd World Congress in Glasgow in 1993. In 2001, this project was designated as a major focus of the IUPS for the next decade. The long term goal of this project is to understand and describe the human organism, its physiology and its pathophysiology. One of the major aims of the overall Physiome concept is to develop multiscale mathematical and computer models that can be used to help understand human health. Since the beginning, momentum has continued in the Physiome project, with much effort focused on the heart and associated Cardiome project. In contrast, the gastrointestinal Physiome project (the GIOME) is still in its infancy. However, GIOME related activities are beginning to appear at several research centres, as highlighted in this issue.
In this paper we present an integrated biophysically based modelling framework for the gastrointestinal system, which is being used to examine electrical activity within the stomach and small bowel. Much of this work parallels work carried out in the Cardiome project, although there are clear anatomical and physiological deviations.
In the human stomach, there is rhythmic electrical activity with a normal frequency of approximately 3 cycles/min (cpm; termed “slow wave activity”). Similar electrical activity exists within the human small intestine although the frequency varies between 8 and 12 cpm, depending on the distance from the pylorus. It is now widely accepted that slow wave activity is a spontaneous event that arises in the interstitial cells of Cajal (ICCs), and is then conducted to the surrounding smooth muscle. Once the electrical activity reaches the smooth muscle, a further excitable event may occur. This event, recently termed an action potential and historically referred to as “spiking behaviour” or “electrical response activity”, is responsible for the major contraction of smooth muscle.
Our understanding of gastrointestinal electrical activity is still in its infancy when compared to that of other muscles, most notably the heart. In the cardiac area, for instance, there exist several anatomically realistic and biophysically detailed multiscale modelling studies[1]. In contrast, only in the last few years have modelling studies of gastric slow waves been performed using anatomically based models[2-4]. Before 2002, most gastrointestinal models were designed to capture the general behaviour of the slow wave in simplified geometries, such as simplified conoid or ellipsoid geometry[5-8]. Anatomically-based models have now been used to investigate normal slow wave rhythm, functional uncoupling, and associated electromagnetic activity. Besides geometric models based on the Visual Human Project, geometric models have also been derived from computed tomography (CT) images, allowing an investigation of patient-specific geometries and their effects on the simulated results. For all of these geometric models, a continuum level description of electrical behaviour that is based on the work of Aliev[9] has been employed.
Presented below is a brief description of our anatomically and physiologically based multiscale models of the human stomach and small intestine. Following this, we present some of the results obtained to date using these models. Initially, normal slow wave activity was simulated and, as far as possible, compared and contrasted to what is currently known about slow wave activity. The models have also been used to investigate abnormal activity such as functional uncoupling. These simulations illustrate the versatility of the modelling framework being developed.
ANATOMICALLY REALISTIC MODELS
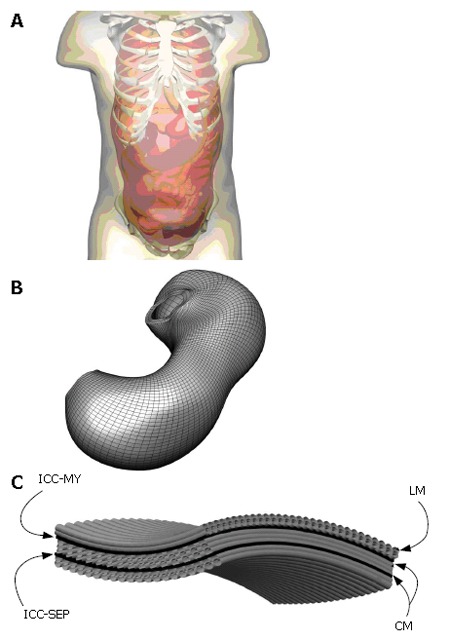
An initial model of the human gastrointestinal system has been created from photographic slices from the Visible Human data set[10]. Details of the model development were described in Pullan et al[1]. In brief, the components of the gastrointestinal system were digitized from the images, creating over 60 000 data points. From these digitized points, surface and volume meshes of the stomach and intestine were fitted to sub-millimetre accuracy. An illustration of this model is given in Figure 1, together with an enlarged view of the components of the gastric model. Specifically represented are the longitudinal and circular smooth muscle layers (LM and CM respectively), with appropriate fibre orientations, separated by the layers of ICCs, which are the myenteric layer (ICC-MY) and the septa layer (ICC-SEP).
Figure 1.

Shown above in (A) is the skin surface enclosing the esophageous, stomach, small and large intestines and a portion of the skeletal system where the components of the digestive system were created from digitized images from the visible man project. Shown in (B) is an enlarged view of the stomach with a high resolution mesh created over the finite elements that define the stomach geometry and (C) is an enlarged view of layers and muscle fibers on that stomach. Specifically modelled are the longitudinal (LM) and circular muscle (CM) layers separated by the ICC-MY (myenteric) and ICC-SEP (septa) layers.
Further geometric models have been developed using CT images acquired from normal human subjects and porcine Magnetic Resonance Images (MRI) (Figure 2). To improve the contrast in the CT images, the human subjects ingested 16 ounces of oral contrast (containing 10 g hypaque sodium powder, Amersham Health) over a period of 90 min prior to the abdominal spiral CT scan. For the animal MRI scans, axial, coronal and saggital T2-weighted images were obtained. As with the models constructed from the Visible Human data set, the images were manually digitized and then geometric models were fitted to these data. Shown in Figure 3 are four different examples of human stomach models that have been created from CT images. This figure illustrates the large variability in stomach location and size among different subjects.
Figure 2.

Gastric geometric models of a normal human (A and B) and pig (C). A: Enlarged view of human stomach surface with green points showing the digitized points of the stomach, overlaid with a CT image; B: the fitted stomach and skin surfaces with a CT image overlaid. The costal margin is outlined by the white interconnected points. C: Anterior view of a pig stomach created from MR images. Shown are the digitised points corresponding to the stomach (green points), the stomach surface (transparent surface) as well as a coronal MR image from which the model was created.
Figure 3.

Anterior views of models of stomachs created from CT images acquired from 4 different human volunteers, illustrating some of the high degree of anatomical variability. Shown are the stomach (red surfaces), skin (transparent surface) and the costal margin (white interconnected points).
CONTINUUM BASED MODELLING
A continuum modelling approach was used to simulate the electrical activity of the stomach and intestine. The bidomain model, widely used in simulations of cardiac electrical activity[11,12], was used to represent the transmembrane and extracellular potentials in the active tissues of the stomach and intestine. These equations are summarised in Equations 1 and 2:
Math 1
Math 1.

Math(A1).
Math 2
Math 2.

Math(A2).
where the i and e subscripts represent properties of the intracellular and extracellular domains respectively. The σ terms are tissue conductivities (which in general will be tensors), the φ terms are potentials, the Vm term is the transmembrane potential (the potential difference across the cell membrane), Am is the surface to volume ratio of the membrane and Cm is the membrane capacitance. Individual cellular models are able to plug directly into these equations through the Iion term in the first equation. At a fine scale, each cellular model is able to incorporate complex subcellular processes.
Using this geometric model, these equations are solved using either the finite element based finite difference method or the structured finite element method[12]. An illustration of a high resolution mesh that has been defined over the stomach geometry is shown in Figure 1B. A modified Fitzhugh-Nagumo (FHN) model[9,13] was used to model the electrical activity of the muscle cells and ICCs, since this currently appears to be the most advanced model that explicitly differentiates between the different cell types (ICCs and smooth muscle). The cellular equations are based on a normalised transmembrane potential, u, that varies from 0 to 1 and a single recovery variable, v. These equations are:
Math 3
Math 3.

Math(A3).
Math 4
Math 4.

Math(A4).
where k is the maximum membrane conductance, a is the normalized threshold potential, ε controls the excitability of the system, γ is the recovery rate constant and β is used to shift the cellular equilibrium from an excitatory to an oscillatory state. The smooth muscle and ICC layers were coupled through a scaled potential gradient with a diffusion coefficient of 0.03.
Outside the active tissues of the gastrointestinal tract, a generalized Laplace’s equation describes the current flows within the passive tissue regions,
Math 5
Math 5.

Math(A5).
Here the ο subscripts denote quantities outside the active region. The extracellular domain described by Equation 2 above is directly coupled to the external passive regions (governed by Equation 5) through continuity of potentials and currents. Using this equation set, the resultant electrical activity within, on and surrounding the active tissues of the stomach and small bowel can be determined from the (continuum) cellular level activity.
SIMULATIONS OF GASTRIC ELECTRICAL ACTIVITY
Normal slow wave activity
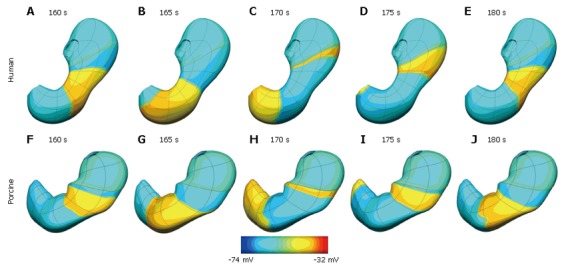
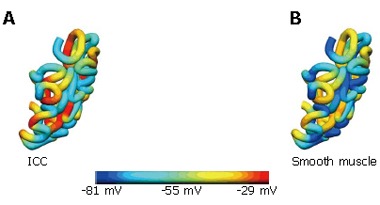
Normal slow wave activity in the stomach and intestine has previously been simulated using the Visible Human model[3,4,14]. The gastric computational model had a total of 432 nodes, 320 elements and 566 656 grid points with average spatial resolutions (distance between grid points) of 1.06 mm (circumferentially), 0.84 mm [longitudinally] and 0.33 mm (transmurally). The intestinal model had an average spatial resolution of 0.95 mm down the entire length. These length scales were small enough to provide close to a converged solution to the governing equations while remaining computationally feasible to solve. The parameters in the cellular equations (Equation 3 and 4) were chosen to match published serosal recordings. Illustrative examples of normal gastric and intestinal slow wave activity are given in Figures 4A-E and 5 respectively.
Figure 4.

Simulation results at five second intervals showing gastric slow wave activity wave in a human (A-E) and porcine (F-J) stomach. The human stomach has a dominant frequency of 3.0 cpm while the porcine model has a dominant frequency of 3.7 cpm. Shown above is the transmembrane potential distribution on the outer surface of the stomach coloured by the scale bar below the images.
Figure 5.

Slow wave intestinal activity. Shown are the transmembrane potentials from the (A) ICC and (B) smooth muscle layers at a particular time instance.
From these simulations, conduction velocities and other parameters were computed and compared to experimental observations. A summary of these comparisons for the stomach is given in Table 1, and for the intestine in Table 2.
Table 1.
Summary of simulated gastric model parameters compared to published values that have been determined experimentally
| Source | [14] | [15] | [16] | [17] | Model |
| Species | Hound dogs | Mongrel dogs | Human | Mongrel dogs | Human |
| Frequency (cpm) | 4-6 | 1.58-1.88 | 2.68-3.28 | N/A | 3 |
| Duration (s) | N/A | 6.8-8.5 | N/A | Submucosal cells: 4.4-5.6 | 7.9 |
| Myenteric cells: 6.1-6.5 | |||||
| Propagation | N/A | Circular muscle: | Corpus: 2.2 | Circular muscle | Antrum: |
| velocity (mm/s) | 16.6-19.2 | Antrum: 6.8 | (fibre): 15.5-29.9 | LM: 16.9 | |
| Circular muscle | CM1: 12.5 | ||||
| (cross fibre): 5.8-16.6 | CM2: 10.7 |
Note the results from Horiguchi et al[16] are indirect measurements while the other sources are direct tissue measurements and results from Xu et al[15] correspond to isolated tissue strips. In the model results, LM is the outer longitudinal muscle layer, CM1 is the middle circular muscle layer and CM2 is the inner circular muscle layer.
Table 2.
Summary of simulated intestinal model parameters compared to published values that have been determined experimentally
|
Experimental data (Canine) |
Model |
|||||
| Frequency (cpm) | Conduction velocity (cm/s) | Wavelength (cm) | Frequency (cpm) | Conduction velocity (cm/s) | Wavelength (cm) | |
| Duodenum | 17.4 | 10.0 | 36.4 | 17.4 | 10.30 | 34.0 |
| Jejunum | 16.0 | 7.11 | 25.0 | 15.4 | 6.50 | 26.6 |
| Ileum | 12.2 | 1.22 | 3.7 | 9.9 | 1.65 | 8.2 |
Experimental data from Bauer et al[18].
Normal gastric activity has also been simulated on the porcine stomach model (shown previously in Figure 2C). In this case the model has a dominant frequency of 3.7 cpm, which is within the expected experiment range of 3-4.5 cpm. This activity is shown graphically in Figure 4F-J.
Functionally uncoupled activity
In a normal stomach, slow waves originate from dominant pacemakers along the greater curvature in the mid-corpus and spread aborally through the antrum to the pyloric sphincter. The pacemaker region in the corpus is dominant in the stomach because it generates slow waves at the highest frequency. With a breakdown in the ICC network, as can occur for instance in diabetes[20], regions of ICC-MY within the gastric network can become uncoupled from the dominant pacemaker, and the synchronised spread of electrical activity from corpus to pylorus is disrupted. In such a situation, ICC-MY within the antral region may become local pacemakers, and electrical slow waves may be generated in ectopic sites. An increase in the intrinsic frequency of antral pacemakers can lead to functional uncoupling and ectopic pacemaking. This can result in collisions between slow waves propagating from ectopic sites and the normal pacemaker site, disrupting gastric peristalsis and delaying gastric emptying (gastroparesis).
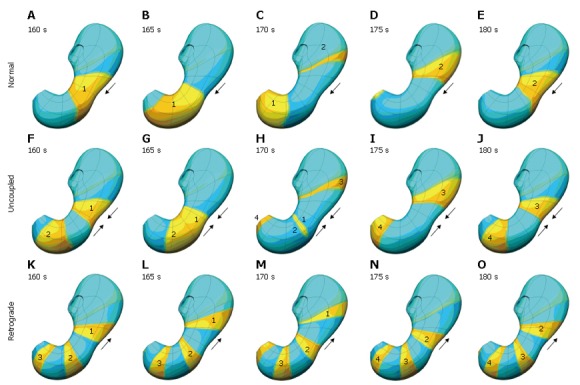
To simulate this phenomenon, the excitability parameter, ε, was defined to be spatially varying. Under normal conditions, the ICC excitability was at a maximum in the proximal corpus on the greater curvature, decreasing slightly circumferentially and more prominently longitudinally[3,21]. By altering the ICC excitability profile, functionally uncoupled activity was generated. Figure 6
Figure 6.

Top row (A-E) shows normal slow wave activity at 5 second interval. In this case the antrum is entrained by the slow wave activity originating in the corpus, is shown. In the second row (F-J), the corpus and antrum maintain the same frequency of slow wave activity, but in this situation, the antrum is not being entrained by the activity of the corpus. The bottom row (K-O) illustrates what happens when the intrinsic frequency of the antrum exceeds that of the corpus, resulting in some retrograde slow wave behaviour.
shows some of the different types of functionally uncoupled behaviour that can arise. Figure 6A-E shows normal slow wave activity in which the antrum is entrained by the slow wave activity originating in the corpus. In Figure 6F-J, the corpus and antrum maintain the same frequency of slow wave activity, but in this situation the antrum is not being entrained by the activity of the corpus. Figure 6K-O illustrates what happens when the intrinsic frequency of the antrum exceeds that of the corpus, resulting in retrograde slow wave behaviour.
CONCLUSION
We have presented an extensible anatomically and biophysically based modelling framework that can be used to investigate the electrical activity of the stomach and small intestine. While still in its infancy, the electrical modelling framework has successfully replicated many of the features of the slow wave activity within the stomach and intestine. It has also being used to investigate activity associated with functional uncoupling of the stomach. We are currently exploring wider applicability of the method so that it can be used, for example, in investigating the response to electrical stimuli that are used within gastric electrical stimulation[22,23].
There is much work that still needs to be done, including further validation and refinement of the existing model. In terms of validation, there are a number of avenues that can be explored to aid in this endeavour. These include directly comparing simulated extracellular potentials against high-resolution in vivo measurements of extracellular potentials in the stomach and intestine walls. Experiments of this nature have recently been performed by Ver Donck et al[24]. Additionally, electrical activity within the organs and the magnetic activity arising from this can be computed at and above the body surface and compared to non-invasive EGG and MGG recordings such as those obtained by Bradshaw et al[25]. We are currently working with various experimental groups to acquire such electrical and magnetic data so that we can continue to enhance and extend our model.
ACKNOWLEDGMENTS
The authors would also like to greatly acknowledge the input of Anita Lin and Rita Yassi in some of the earlier modelling work, the assistance of Phillip Williams, L Alan Bradshaw and William O Richards from Vanderbilt University and Jiande Chen from the University of Texas Medical Branch.
Footnotes
Supported in part by NIH grant R01 DK64775
Co-correspondence to: Andrew J Pullan
S- Editor Liu Y L- Editor Lutze M E- Editor Che YB
References
- 1.Pullan AJ, Buist ML, Cheng LK. Mathematically Modelling the Electrical Activity of the Heart: From Cell to Body Surface and Back Again. New Jersey: World Scientific; 2005. [Google Scholar]
- 2.Pullan A, Cheng L, Yassi R, Buist M. Modelling gastrointestinal bioelectric activity. Prog Biophys Mol Biol. 2004;85:523–550. doi: 10.1016/j.pbiomolbio.2004.02.003. [DOI] [PubMed] [Google Scholar]
- 3.Buist ML, Cheng LK, Yassi R, Bradshaw LA, Richards WO, Pullan AJ. An anatomical model of the gastric system for producing bioelectric and biomagnetic fields. Physiol Meas. 2004;25:849–861. doi: 10.1088/0967-3334/25/4/006. [DOI] [PubMed] [Google Scholar]
- 4.Lin AS, Buist ML, Cheng LK, Smith NP, Pullan AJ. Computational simulations of the human magneto- and electroenterogram. Ann Biomed Eng. 2006;34:1322–1331. doi: 10.1007/s10439-006-9142-4. [DOI] [PubMed] [Google Scholar]
- 5.Liang J, Chen JD. What can be measured from surface electrogastrography. Computer simulations. Dig Dis Sci. 1997;42:1331–1343. doi: 10.1023/a:1018869300296. [DOI] [PubMed] [Google Scholar]
- 6.Mirizzi N, Stella R, Scafoglieri U. Model to simulate the gastric electrical control and response activity on the stomach wall and on the abdominal surface. Med Biol Eng Comput. 1986;24:157–163. doi: 10.1007/BF02443929. [DOI] [PubMed] [Google Scholar]
- 7.Mintchev MP, Bowes KL. Computer simulation of the effect of changing abdominal thickness on the electrogastrogram. Med Eng Phys. 1998;20:177–181. doi: 10.1016/s1350-4533(98)00019-8. [DOI] [PubMed] [Google Scholar]
- 8.Irimia A, Bradshaw LA. Ellipsoidal electrogastrographic forward modelling. Phys Med Biol. 2005;50:4429–4444. doi: 10.1088/0031-9155/50/18/012. [DOI] [PubMed] [Google Scholar]
- 9.Aliev RR, Richards W, Wikswo JP. A simple nonlinear model of electrical activity in the intestine. J Theor Biol. 2000;204:21–28. doi: 10.1006/jtbi.2000.1069. [DOI] [PubMed] [Google Scholar]
- 10.Spitzer V, Ackerman MJ, Scherzinger AL, Whitlock D. The visible human male: a technical report. J Am Med Inform Assoc. 1996;3:118–130. doi: 10.1136/jamia.1996.96236280. [DOI] [PMC free article] [PubMed] [Google Scholar]
- 11.Plonsey R, Barr RC. Mathematical modeling of electrical activity of the heart. J Electrocardiol. 1987;20:219–226. doi: 10.1016/s0022-0736(87)80019-5. [DOI] [PubMed] [Google Scholar]
- 12.Buist M, Sands G, Hunter P, Pullan A. A deformable finite element derived finite difference method for cardiac activation problems. Ann Biomed Eng. 2003;31:577–588. doi: 10.1114/1.1567283. [DOI] [PubMed] [Google Scholar]
- 13.Fitzhugh R. Impulses and Physiological States in Theoretical Models of Nerve Membrane. Biophys J. 1961;1:445–466. doi: 10.1016/s0006-3495(61)86902-6. [DOI] [PMC free article] [PubMed] [Google Scholar]
- 14.Lin AS, Buist ML, Smith NP, Pullan AJ. Modelling slow wave activity in the small intestine. J Theor Biol. 2006;242:356–362. doi: 10.1016/j.jtbi.2006.03.004. [DOI] [PubMed] [Google Scholar]
- 15.Xu X, Wang Z, Hayes J, Chen JD. Is there a one-to-one correlation between gastric emptying of liquids and gastric myoelectrical or motor activity in dogs? Dig Dis Sci. 2002;47:365–372. doi: 10.1023/a:1013726223531. [DOI] [PubMed] [Google Scholar]
- 16.Horiguchi K, Semple GS, Sanders KM, Ward SM. Distribution of pacemaker function through the tunica muscularis of the canine gastric antrum. J Physiol. 2001;537:237–250. doi: 10.1111/j.1469-7793.2001.0237k.x. [DOI] [PMC free article] [PubMed] [Google Scholar]
- 17.Familoni BO, Abell TL, Bowes KL. A model of gastric electrical activity in health and disease. IEEE Trans Biomed Eng. 1995;42:647–657. doi: 10.1109/10.391163. [DOI] [PubMed] [Google Scholar]
- 18.Bauer AJ, Publicover NG, Sanders KM. Origin and spread of slow waves in canine gastric antral circular muscle. Am J Physiol. 1985;249:G800–G806. doi: 10.1152/ajpgi.1985.249.6.G800. [DOI] [PubMed] [Google Scholar]
- 19.Lammers WJ, Ver Donck L, Schuurkes JA, Stephen B. Peripheral pacemakers and patterns of slow wave propagation in the canine small intestine in vivo. Can J Physiol Pharmacol. 2005;83:1031–1043. doi: 10.1139/y05-084. [DOI] [PubMed] [Google Scholar]
- 20.Ordög T, Takayama I, Cheung WK, Ward SM, Sanders KM. Remodeling of networks of interstitial cells of Cajal in a murine model of diabetic gastroparesis. Diabetes. 2000;49:1731–1739. doi: 10.2337/diabetes.49.10.1731. [DOI] [PubMed] [Google Scholar]
- 21.Buist ML, Cheng LK, Sanders KM, Pullan AJ. Multiscale modelling of human gastric electric activity: can the electrogastrogram detect functional electrical uncoupling? Exp Physiol. 2006;91:383–390. doi: 10.1113/expphysiol.2005.031021. [DOI] [PubMed] [Google Scholar]
- 22.Cigaina V. Gastric pacing as therapy for morbid obesity: preliminary results. Obes Surg. 2002;12 Suppl 1:12S–16S. doi: 10.1007/BF03342141. [DOI] [PubMed] [Google Scholar]
- 23.D'Argent J. Gastric electrical stimulation as therapy of morbid obesity: preliminary results from the French study. Obes Surg. 2002;12 Suppl 1:21S–25S. doi: 10.1381/096089202762552638. [DOI] [PubMed] [Google Scholar]
- 24.Ver Donck L, Lammers WJ, Moreaux B, Smets D, Voeten J, Vekemans J, Schuurkes JA, Coulie B. Mapping slow waves and spikes in chronically instrumented conscious dogs: implantation techniques and recordings. Med Biol Eng Comput. 2006;44:170–178. doi: 10.1007/s11517-005-0018-9. [DOI] [PubMed] [Google Scholar]
- 25.Bradshaw LA, Irimia A, Sims JA, Gallucci MR, Palmer RL, Richards WO. Biomagnetic characterization of spatiotemporal parameters of the gastric slow wave. Neurogastroenterol Motil. 2006;18:619–631. doi: 10.1111/j.1365-2982.2006.00794.x. [DOI] [PubMed] [Google Scholar]


