

Abstract
Trastuzumab emtansine (T-DM1) is an antibody–drug conjugate (ADC) therapeutic for treatment of human epidermal growth factor receptor 2 (HER2)-positive cancers. The T-DM1 dose product contains a mixture of drug-to-antibody ratio (DAR) moieties whereby the small molecule DM1 is chemically conjugated to trastuzumab antibody. The pharmacokinetics (PK) underlying this system and other ADCs are complex and have not been elucidated. Accordingly, we have developed two PK modeling approaches from preclinical data to conceptualize and understand T-DM1 PK, to quantify rates of DM1 deconjugation, and to elucidate the link between trastuzumab, T-DM1, and DAR measurements. Preclinical data included PK studies in rats (n = 34) and cynomolgus monkeys (n = 18) at doses ranging from 0.3 to 30 mg/kg and in vitro plasma stability. T-DM1 and total trastuzumab (TT) plasma concentrations were measured by enzyme-linked immunosorbent assay. Individual DAR moieties were measured by affinity capture liquid chromatography-mass spectrophotometry. Two PK modeling approaches were developed for T-DM1 using NONMEM 7.2 software: a mechanistic model fit simultaneously to TT and DAR concentrations and a reduced model fit simultaneously to TT and T-DM1 concentrations. DAR moieties were well described with a three-compartmental model and DM1 deconjugation in the central compartment. DM1 deconjugated fastest from the more highly loaded trastuzumab molecules (i.e., DAR moieties that are ≥3 DM1 per trastuzumab). T-DM1 clearance (CL) was 2-fold faster than TT CL due to deconjugation. The two modeling approaches provide flexibility based on available analytical measurements for T-DM1 and a framework for designing ADC studies and PK–pharmacodynamic modeling of ADC efficacy- and toxicity-related endpoints.
KEY WORDS: antibody–drug conjugate, deconjugation, population pharmacokinetic model, T-DM1, trastuzumab emtansine
INTRODUCTION
Antibody–drug conjugates (ADCs) are a relatively new promising class of compounds in clinical development for the treatment of cancer (1–4). They harness the targeting capability and long half-life of antibodies to deliver potent small molecule cytotoxins that may be too toxic to directly administer and/or have poor pharmacokinetic (PK) properties. ADCs made via conventional drug conjugation strategies (using lysine side-chain amines or sulfhydryl groups for conjugation) are complex, heterogeneous mixtures of various drug-to-antibody ratio (DAR) moieties. Understanding the PK underlying these ADCs has been elusive, primarily due to the lack of analytical techniques capable of readily measuring the individual DAR moieties comprising the ADCs. Herein, we present a novel modeling and simulation (M&S) analysis of an ADC, trastuzumab emtansine (T-DM1), to elucidate the complex PK and provide an M&S platform for the ongoing clinical development of T-DM1 as well as other ADCs.
T-DM1 is an ADC for the treatment of human epidermal growth factor receptor 2 (HER2)-positive cancers (5,6). The antibody backbone of T-DM1 is trastuzumab (Herceptin®), a recombinant, humanized anti-HER2 monoclonal IgG antibody approved in 1998 for the treatment of HER2-positive metastatic breast cancer. DM1 is a small molecule cytotoxin, a potent derivative of the microtubule inhibitor maytansine, which was abandoned as a chemotherapeutic due to a narrow therapeutic index (3). T-DM1 is synthesized via conventional ADC strategies, whereby DM1 is chemically linked to lysine residues on trastuzumab via a stable nonreducible (“non-cleavable”) thioether bond using the SMCC (N-succinimidyl-4-(N-maleimidomethyl)-cyclohexane-1-carboxylate) linker. Following uptake via the HER2 receptor, T-DM1 is degraded in the lysosome; DM1, and DM1-containing catabolites, are thus released intracellularly and bind tubulin, thereby disrupting microtubule assembly/disassembly and selectively killing HER2-overexpressing tumor cells (7,8).
During T-DM1 synthesis, DM1 may conjugate to one or more lysine residues on trastuzumab yielding a dose product containing a mixture of different numbers of DM1 per trastuzumab antibody; summation of these individual DAR and free trastuzumab (i.e., unconjugated DAR0) concentrations are equivalent to the total trastuzumab (TT) concentration. These different DAR moieties may have unique PK and/or pharmacodynamic (PD) characteristics. For T-DM1 efficacy, both ADC and TT concentrations are relevant as T-DM1 retains the antitumor mechanism of trastuzumab (9) thought to involve HER2 signal inhibition (10).
Quantification of the DAR moieties comprising ADCs is not routinely performed; the standard enzyme-linked immunosorbent assay (ELISA) either measures ADC concentrations (antibody bearing at least one cytotoxin) or total antibody concentrations (antibody with or without cytotoxin) and do not differentiate individual DAR moieties (11). Recently, an affinity capture liquid chromatography-mass spectrophotometry (LC-MS) assay has been developed to measure the individual DAR moieties comprising ADCs (12,13). For T-DM1, this assay detected 0–7 DM1 per trastuzumab (i.e., DAR0–DAR7) with an average DAR of 3.1. This manuscript describes the development of a mechanistic PK model of T-DM1 using affinity capture LC-MS data from preclinical in vitro and in vivo PK experiments in rats and cynomolgus monkeys. The model conceptualizes the PK system for T-DM1 down to its individual DAR moieties and quantifies their distribution, elimination, and rates of DM1 deconjugation. Additionally, a reduced T-DM1 PK model based on ELISA measurements of TT and T-DM1 was developed, which provided modeling flexibility for ADCs given that affinity capture LC-MS analysis may not always be available. The application of these models towards preclinical and clinical development of T-DM1 and other ADCs is discussed further.
MATERIALS AND METHODS
Preclinical PK Studies
Table I presents the data from preclinical in vitro plasma stability experiments and in vivo PK studies in rats (n = 34) and cynomolgus monkeys (n = 18), which was used for model development. The PK studies in rats were approved by Institutional Animal Care and Use Committee (IACUC) and conducted at Genentech, Inc. The PK studies in cynomolgus monkeys were approved by IACUC and conducted by Covance Laboratories, Inc. (Covance; Madison, WI).
Table I.
In Vitro and In Vivo PK Studies
| Study | T-DM1 dose producta | Number (n) | T-DM1 administration | Available datab |
|---|---|---|---|---|
| In vitro plasma stabilityc | T-DM1DAR 3.1 | 1 | 100 μg/mL | TT; DAR0–DAR7 |
| Rat PKd | T-DM1DAR 1.5 | 5 | 10.0 mg/kg IV | TT; DAR0–DAR7 |
| T-DM1DAR 3.1 | 5 | 10.0 mg/kg IV | TT; DAR0–DAR7 | |
| Rat PK | T-DM1DAR 3.1 | 24 | 0.3 (n = 7), 3.0 (n = 8), and 20.0 mg/kg IV (n = 9) | TT; T-DM1 |
| Cynomolgus monkey PK | T-DM1DAR 3.1 | 4 | 30.0 mg/kg IV | TT; T-DM1; DAR0–DAR7 |
| T-DM1DAR 3.1 | 14 | Multiple-dose IV infusion: 10.0 mg/kg q3w x4 | TT; T-DM1 |
See “MATERIALS AND METHODS” for details
PK pharmacokinetic, T-DM1 trastuzumab emtansine, DAR drug-to-antibody ratio, IV intravenous, q3w once every 3 weeks, TT total trastuzumab
aT-DM1DAR 1.5 and T-DM1DAR 3.1 dose products have an average of 1.5 and 3.1 DM1/trastuzumab, respectively
bTotal trastuzumab and T-DM1 were measured by ELISA; DAR0–DAR7 were measured by affinity capture LC-MS
cSeparate experiments for rat and cynomolgus monkey plasma
dTwo of five animals used for total trastuzumab measurements; three of five animals used for DAR0–DAR7 measurements
Preparation of T-DM1DAR 3.1 and T-DM1DAR 1.5 Dose Products
Two different preclinical T-DM1 dose products were prepared by regulating the amount of SMCC linker added during the manufacturing process. Specifically, less SMCC linker was added to generate the T-DM1DAR 1.5 dose product compared with more SMCC linker added to generate the T-DM1DAR 3.1 dose product. The T-DM1DAR 3.1 dose product (average DAR = 3.1) contained DAR0–DAR7 moieties with the following percentages as measured by affinity capture LC-MS: 2% DAR7, 5% DAR6, 10% DAR5, 19% DAR4, 26% DAR3, 23% DAR2, 13% DAR1, and 2% unconjugated antibody (DAR0). The T-DM1DAR 1.5 dose product (average DAR = 1.5) contained DAR0–DAR5 moieties with the following percentages as measured by affinity capture LC-MS: 1% DAR5, 4% DAR4, 13% DAR3, 26% DAR2, 35% DAR1, and 21% DAR0.
T-DM1 Plasma Stability Study
T-DM1 (100 μg/mL) was incubated in rat and cynomolgus monkey plasma and in buffer control at 37°C. Samples (one per time point) were collected at 0 and 5 min; 1 and 4 h; and 1, 2, and 4 days postdose for measurement of TT and DAR concentrations. Pooled lithium-heparinized rat and cynomolgus monkey plasma (Bioreclamation, Hicksville, NY) was used. The buffer control was phosphate-buffered saline (PBS) containing 0.5% bovine serum albumin (BSA, pH 7.4; Sigma-Aldrich, Inc., St. Louis, MO).
T-DM1 PK Studies in Rats
Two PK studies were conducted in vivo in rats. In the first study, ten naïve Sprague–Dawley rats (n = 5 rats/group) were administered a single intravenous (IV) dose of 10 mg/kg T-DM1DAR 3.1 or 10 mg/kg T-DM1DAR 1.5. Three of the five rats were used to determine DAR concentrations, with blood samples collected at the following time points: 5 min; 1, 4, and 12 h; and 1, 2, 4, 7, 10, 14, and 21 days postdose. Sampling was staggered between rats at four to five time points per rat. The remaining two rats were used to determine TT concentrations, with blood samples at the following time points: 5 min; 1, 4, and 12 h; and 1, 2, 4, 7, 10, 14, 18, and 21 days postdose.
For the second PK study, T-DM1DAR 3.1 was administered as a single IV dose at 0.3, 3.0, and 20.0 mg/kg (n = 7–9 Sprague Dawley rats/group). Blood samples were collected at the following time points: 3 min; 1 and 6 h; and 1, 2, 3, 4, 7, 8, 11, 14, 21, 29, 35, and 42 days postdose. Blood samples were processed for TT and T-DM1 concentrations. Rats weighed between 193 and 283 g from both studies.
T-DM1 PK Studies in Cynomolgus Monkeys
T-DM1DAR 3.1 was administered to cynomolgus monkeys both as a single IV dose at 30 mg/kg (n = 2 males (M) and 2 females (F) per group), as well as every 3 weeks (q3w) for four doses at 10 mg/kg (n = 7 M and 7 F/group). All animals were approximately 3–5 years old. Male cynomolgus monkeys weighed 3.0–4.5 kg and female cynomolgus monkeys weighed 2.6–3.0 kg; the average weight was 3.5 kg. Blood samples were collected via the femoral vein.
For the single-dose (30 mg/kg) study, blood samples were collected as follows: 2 min; 4 and 12 h; and 1, 2, 3, 5, 7, 10, 14, 21, and 28 days postdose. Samples were processed for TT, DAR, and T-DM1 concentrations.
For the multiple-dose study (10 mg/kg q3w), blood samples were collected as follows for the first dose: pre-dose and 5 min; 6 and 10 h; and 1, 3, and 6 days postdose. Blood samples were collected as follows for the second and third doses: pre-dose and 5 min postdose. For the final fourth dose, blood samples were collected pre-dose and 5 min; 10 h; and 1, 3, 5, 7, 14, 21, 30, and 42 days postdose. Samples were processed for TT and T-DM1 concentrations.
ELISA
TT Concentrations
TT concentrations were measured using a HER2 extracellular domain (ECD) for capture and antihuman Fc-horseradish peroxidase (HRP) as the secondary antibody. This assay measured trastuzumab antibody both with and without conjugated DM1, i.e., DAR0–DAR7. The lower limit of quantification (LLOQ) defined by the low end-of-assay reporting range was 0.164, 0.164, and 0.400 ng/mL for the plasma stability, in vivo rat PK, and in vivo cynomolgus monkey PK studies, respectively.
T-DM1 Concentrations
T-DM1 concentrations were measured using an anti-DM1 antibody for capture and biotinylated HER2 ECD and streptavidin-HRP for detection. The assay measured any trastuzumab antibody with one or more DM1 molecules conjugated to it, i.e., DAR1–DAR7. The LLOQ defined by the low end-of-assay reporting range was 0.164, 0.0660, and 0.300 ng/mL for the plasma stability, in vivo rat PK, and in vivo cynomolgus monkey PK studies, respectively.
Affinity Capture LC-MS Assay
An affinity capture LC-MS assay measured the relative intensities of the various DAR moieties in plasma (12,13).
Experimental
Biotinylated HER2 ECD was immobilized onto streptavidin-coated paramagnetic beads (Invitrogen, Carlsbad, CA). Plasma samples were incubated with paramagnetic beads for approximately 2 h at room temperature. Following the affinity capture process, the bound ADCs were isolated, washed, and deglycosylated on the beads by incubating with PNGase F (Prozyme, USA) in HBS-EP buffer (GE Healthcare, USA) at 37°C overnight. Subsequently, the beads were washed extensively by HBS-EP and water, and the T-DM1 DAR moieties were then eluted by 30% acetonitrile in water for affinity capture LC-MS analysis. A volume of 10 μL of the eluate was injected onto a PLRP-S column (50 × 0.3 mm, 5 μM, 4,000 Å, Agilent) with a 15 μL/min flow rate. Typical mobile phase (acetonitrile and water containing 0.1% formic acid) was used. T-DM1 moieties were ionized by electrospray ionization and detected by a Q-Star XL mass spectrometer (AB Sciex) operated in the positive time-of-flight-mass spectrometry (TOF-MS) mode. Raw data of T-DM1 DAR moieties was deconvoluted using Analyst QS 1.1 software, and peak area under curve (AUC) was obtained for T-DM1 moiety.
DAR Concentrations
The percentage of each DAR (DAR0–DAR7) moiety in plasma samples was calculated from its relative signal intensity. The individual DAR plasma concentrations were then obtained by multiplying these individual percentages by the TT concentration (from ELISA) at the respective time. This procedure was used for the in vitro plasma and in vivo cynomolgus monkey PK experiments. For the in vivo rat PK experiments, blood sample limitations necessitated that TT concentrations (from ELISA) were averaged from two rats. DAR plasma concentrations for the other three of five rats were obtained by multiplying their individual DAR percentages by this average TT concentration at respective times. No adjustment was made to correct DAR concentrations as the difference in molecular weight between DAR moieties was ~0.5%.
T-DM1 PK Model Development
Two PK models describing T-DM1 disposition were developed based on the preclinical data. These two models, i.e., a “mechanistic” and a “reduced” model, intended to provide modeling flexibility given the availability of antibody, ADC, and DAR measurements, for future studies with T-DM1 as well as for other ADCs in development.
Mechanistic T-DM1 PK Model
Figure 1a shows a schematic of the mechanistic T-DM1 PK model. This model was fit simultaneously to (1) TT and DAR0–DAR7 concentration–time data from both in vitro plasma stability and in vivo rat experiments and (2) TT and DAR0–DAR7 concentration–time data from both in vitro plasma stability and in vivo cynomolgus monkey experiments. The in vitro data provided additional DM1 deconjugation data to support parameter estimates and to test the assumption that in vitro and in vivo DM1 deconjugation rates are similar. The two T-DM1 dose products (T-DM1DAR 3.1 and T-DM1DAR 1.5) provided different starting conditions to test the assumption that individual DAR moieties (i.e., DAR7, DAR6, etc.) have similar disposition, regardless of whether they are initially present in the dose product or formed during the deconjugation process.
Fig. 1.
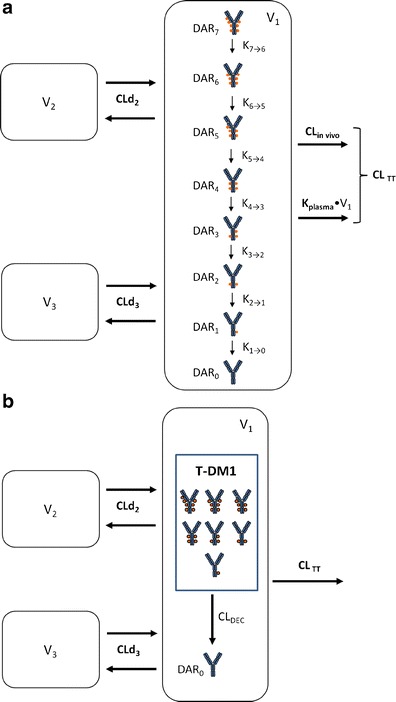
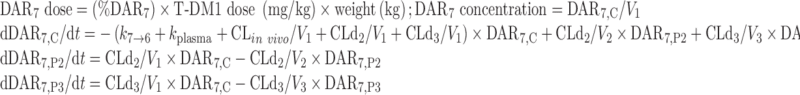
a Schematic of the mechanistic T-DM1 PK model describing the concentration–time course of individual DAR0–DAR7 moieties and TT based on ELISA and affinity capture LC-MS data. DM1 molecules (filled circles) are shown linked to trastuzumab in generic locations for illustration only. T-DM1 trastuzumab emtansine, PK pharmacokinetic, TT total trastuzumab, CL TT TT clearance from the central compartment, CL in vivo in vivo antibody clearance from the central compartment, equal to CLTT − k plasma × V 1, CLd 2 distributional clearance 2, CLd 3 distributional clearance 3, DAR n n DM1 molecules bound to trastuzumab (drug-to-antibody ratio), k plasma rate constant for antibody degradation in plasma, supported by in vitro data, k n → n − 1 rate constant for DM1 deconjugation from higher DAR moiety to next moiety in the chain, V 1 volume of distribution of central compartment, V 2 volume of distribution of peripheral compartment 2, V 3 volume of distribution of peripheral compartment 3. b Schematic of the reduced T-DM1 PK model describing the time course of T-DM1 and TT based only on ELISA data. T-DM1 is defined as any trastuzumab molecule with at least one linked DM1 molecule. DM1 molecules (filled circles) are shown linked to trastuzumab in generic locations for illustration only. CL DEC deconjugation clearance from T-DM1 to unconjugated trastuzumab (DAR 0). Additional parameters are as defined in Fig. 1a. T-DM1 trastuzumab emtansine, TT total trastuzumab
As shown in Fig. 1a, individual DAR moieties are linked together through a catenary chain of subcompartments within the central compartment (V1) of a three-compartment model. DAR moieties undergo distributional clearance (CLd2 and CLd3) into two peripheral compartments (V2 and V3) and are cleared from the central compartment through antibody clearance (CLTT) processes. CLTT was parameterized as composed of a first-order antibody degradation rate constant (kplasma), supported by the in vitro plasma stability data, and in vivo antibody clearance processes (CLin vivo). Individual rates of DM1 deconjugation from DAR moieties were modeled using first-order rate constants (kn → n − 1), where n is the higher DAR moiety, and n − 1 is the subsequent DAR moiety in the catenary chain.
For model building, the following procedure was taken: (1) TT concentrations were modeled first and indicated that a three-compartment model best fit the data; (2) all DM1 deconjugation rate constants (i.e., k7 → 6–k1 → 0) were initially estimated; results indicated that k7 → 6–k3 → 2 were of similar values. Therefore, a stepwise approach was taken, which first assumed that all deconjugation rate constants were equivalent, that is k7 → 6 = k6 → 5 = k5 → 4 = k4 → 3 = k3 → 2 = k2 → 1 = k1 → 0. The NONMEM objective function value (OFV) with this model fit was compared with the next model fit in this approach, that is with k7 → 6 = k6 → 5 = k5 → 4 = k4 → 3 = k3 → 2 = k2 → 1 ≠ k1 → 0. This procedure was continued until the NONMEM OFV revealed no further improvement; (3) DM1 deconjugation occurring in peripheral V2 and V3 compartments was tested as above; (4) an alternative model parameterization was tested which assumed that DM1 deconjugation rates were independent of the number of DM1s attached or the conjugations site as described in Gibiansky et al. (14); in this approach, k1 → 0 was the single deconjugation parameter, and the other intercompartmental deconjugation rate constants were factors of k1 → 0, i.e., k2 → 1 = 2 × k1 → 0, k3 → 2 = 3 × k1 → 0, etc.
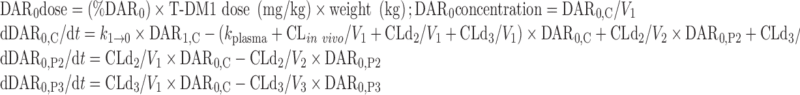
The final NONMEM PK model equations describing the individual DAR0–DAR7 moieties and TT following T-DM1 administration are shown below; TT and DAR0–DAR7 concentrations were the dependent variables in the mechanistic model. In total, 24 differential equations were used to describe the eight individual DAR moieties in this system, as each moiety distributes into three compartments, and DM1 deconjugation occurs in the central (C) compartment. For model input, the percentage of each DAR moiety in the T-DM1 dose product (i.e., T-DM1DAR 3.1 or T-DM1DAR 1.5) was seeded into the central compartment (DAR0,C–DAR7,C) at time = 0. Each DAR moiety equilibrated with two peripheral (P) compartments (DAR0,P2–DAR7,P2 and DAR0,P3–DAR7,P3). When fitting the model to the in vitro portion of the dataset, V1 referred to the plasma incubation volume (~1 mL), and the clearance processes were not applicable and therefore fixed to 0 (i.e., CLin vivo = 0, CLd2 = 0, and CLd3 = 0). Additionally, the T-DM1 concentration–time, conjugated DM1 concentration–time, cumulative DM1–time, and DARAVG–time courses were predicted from model equations as shown.
For DAR7:
 |
For DAR6:
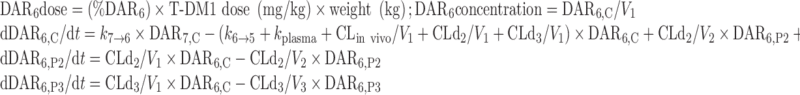 |
Equations for DAR5, DAR4, DAR3, DAR2, and DAR1 concentrations are modeled similar to DAR6, with three compartments per moiety, and input from the higher DAR moiety, i.e., kn → n − 1
For DAR0 (unconjugated trastuzumab):
 |
For TT plasma concentrations [TT]; (sum of DAR7,C–DAR0,C):
 |
T-DM1 plasma concentrations [T-DM1]; (sum of DAR7,C–DAR1,C) were predicted from the model using the following equation:
 |
Conjugated DM1 concentrations [Conjugated DM1] were predicted from the model using the following equation, where the molecular weights of DM1 and trastuzumab are 737 and 145,532 g/mol, respectively:
 |
The cumulative amount of DM1 equivalents (DM1eq) released via deconjugation was predicted from the model using the equation below, where the molecular weights of DM1 and trastuzumab are 737 and 145,532 g/mol, respectively. The notation DM1eq was used given that DM1, MCC-DM1, and lysine-MCC-DM1 are all catabolites of T-DM1 (6,7).
 |
The DARAVG time course was predicted from the model using the following equation, where each DAR moiety is multiplied by the number of DM1s conjugated to trastuzumab, and then divided by the TT amount:
 |
Reduced T-DM1 PK Model
Figure 1b shows a schematic of the reduced T-DM1 PK model. This model was fit simultaneously to ELISA measurements of TT and T-DM1 concentration–time data from rat experiments and then separately to data from cynomolgus monkey experiments. T-DM1 is represented by a single compartment within the central compartment (V1) of a three-compartment model. T-DM1, by definition, is any trastuzumab antibody conjugated to at least one molecule of DM1. A single deconjugation parameter (CLDEC) described the conversion of T-DM1 to unconjugated trastuzumab (DAR0). T-DM1 and DAR0 distribute (CLd2 and CLd3) into the two peripheral compartments (V2 and V3), and are cleared by antibody clearance (CLTT) processes. The reduced PK model was developed to provide an alternative modeling approach for other ADCs when measurement of individual DAR moieties by this reported affinity capture LC-MS may not be available or feasible.
The NONMEM PK model equations describing T-DM1, DAR0, and TT concentration–time courses following T-DM1 dosing are shown below. In total, six differential equations were used. For model input, the percentage of DAR0 in the dose product was seeded into the central compartment (DAR0,C) and the remaining (100% DAR0) was seeded into the T-DM1 central compartment (T-DM1c). T-DM1 and DAR0 equilibrated with the peripheral compartments V2 (T-DM1P2 and DAR0,P2) and V3 (T-DM1P3 and DAR0,P3). T-DM1 and TT concentrations were dependent variables in the model:
For T-DM1:
 |
For unconjugated trastuzumab (DAR0):
 |
For TT concentration [TT]:
 |
Data Analysis
Model development was performed using the First-order conditional estimation (FOCE) method with INTERACTION in NONMEM 7.2 (15) and PerlSpeaksNONMEM (PsN) version 2.0 (Uppsala, Sweden) (16). Concentrations of the individual DAR0–DAR7 moieties, TT, and T-DM1 were log transformed.
Log-normal parameter distributions were used for inter-individual variability (IIV), whereas the parameter for an ith individual was represented by Parameteri = typical value × exp(ηi), where ηi represents the IIV. The residual error was modeled as an additive error, which corresponds approximately to a proportional error on the untransformed data. The objective function value (OFV) was used for the comparison of nested models, using the log-likelihood ratio test. A difference in OFV of >3.84, corresponding to a significance level of P < 0.05, was used for discrimination between two nested models that differed in one parameter (16).
The number of data samples available from plasma stability, rat PK, and cynomolgus monkey PK studies were 189, 1,091, and 883, respectively.
Model Evaluation
Model evaluations were performed using diagnostic plots and visual predictive checks (VPCs). For VPCs, the 50th percentile with 95% confidence intervals (CI) was obtained by simulating 500 data sets from the final model using the original model building dataset. Observed data was overlaid with model predictions.
Model Predictions
In order to understand the subtleties of T-DM1 PK, concentration–time curves for TT, T-DM1, DAR0–DAR7, and conjugated DM1 and DARAVG were simulated in cynomolgus monkeys for a single T-DM1 dose of 3.6 mg/kg and for multiple-dose regimen of 3.6 mg/kg q3w; T-DM1 3.6 mg/kg q3w is the clinical dose regimen. For simulations, the typical parameter estimates (Table II) from the mechanistic PK model fit to cynomolgus monkey data and the preclinical T-DM1DAR 3.1 dose product, were used.
Table II.
Mechanistic T-DM1 PK Model Parameter Estimates
| Rat | Cynomolgus monkey | |||||||||
|---|---|---|---|---|---|---|---|---|---|---|
| Parameter | Description | Unit | Value | RSE (%) | IIV (%) | RSE (%) | Value | RSE (%) | IIV (%) | RSE (%) |
| CLTT a | Total trastuzumab clearance | mL/day | 2.42 | (5.7) | 24.0 | (18) | 17.4 | (13) | 24.8 | (22) |
| k plasma | Plasma degradation rate constant | day−1 | 0.156 | (1.2) | – | – | 0.0939 | (3.0) | – | – |
| CL in vivo b | In vivo antibody clearance | mL/day | 0.704 | – | – | – | 3.50 | – | – | – |
| V 1 | Central volume | mL | 11.0 | (4.3) | 18.5 | (11) | 148 | (4.8) | 11.7 | (12) |
| CLd2 | Distributional clearance 2 | mL/day | 49.0 | (35) | – | – | 25.5 | (35) | – | – |
| V 2 | Peripheral volume 2 | mL | 3.44 | (58) | 49.4 | (41) | 57.2 | (38) | 46.8 | (33) |
| CLd3 | Distributional clearance 3 | mL/day | 12.0 | (16) | – | – | 81.2 | (19) | – | – |
| V 3 | Peripheral volume 3 | mL | 16.7 | (6.2) | 16.8 | (21) | 127 | (15) | – | – |
| k 7 → 6 c | DAR7–DAR3 deconjugation rate constants | day−1 | 0.543 | (15) | 21.8 | (40) | 0.341 | (7.7) | – | – |
| k 6 → 5 | ||||||||||
| k 5 → 4 | ||||||||||
| k 4 → 3 | ||||||||||
| k 3 → 2 | ||||||||||
| k 2 → 1 | DAR2 deconjugation rate constant | day−1 | 0.388 | (7.1) | – | – | 0.255 | (6.7) | – | – |
| k 1 → 0 | DAR1 deconjugation rate constant | day−1 | 0.114 | (30) | 15.1 | (48) | 0.0939 | (5.8) | – | – |
| Res err | Residual error | % | 11.1 | (6.1) | – | – | 15.3 | (3.3) | – | – |
T-DM1 trastuzumab emtansine, PK pharmacokinetic, IIV interindividual variability, RSE relative standard error
aComposed of CLin vivo and k plasma × V 1
bDerived by: CLin vivo = CLtrastuzumab − k plasma × V 1
cRate constants were determined to be equal from model building
Further simulations were done to illustrate the utility of the mechanistic model towards designing experiments to elucidate PK drivers of PD response (e.g., antitumor response, adverse effects). Using the two preclinical T-DM1DAR 3.1 and T-DM1DAR 1.5 dose products, TT, T-DM1, conjugated DM1, and cumulative DM1eq time courses were simulated in an experimental paradigm which assumed the PK driver of PD response was the following: (1) steady-state T-DM1 trough concentration, (2) steady-state T-DM1 exposure (i.e., T-DM1 AUC), (3) steady-state conjugated DM1 concentration, and (4) cumulative DM1eq. In this paradigm, the dose of the T-DM1DAR 1.5 dose product was aligned to match the 3.6 mg/kg q3w T-DM1DAR 3.1 dose, thus providing a reasonably direct method to test the PK driver assumptions given a relevant test system of PD response. For steady-state T-DM1 trough, conjugated DM1, and cumulative DM1eq, simulations with Berkeley Madonna software determined doses of 5.8, 8.0, and 7.1 mg/kg q3w for T-DM1DAR 1.5, respectively. For steady state T-DM1 AUC, 5.16 mg/kg T-DM1DAR 1.5 dose was solved mathematically as outlined in Appendix 1.
RESULTS
Model Evaluations
The mechanistic PK model (Fig. 1a) well described the TT and DAR0–DAR7 concentration–time data simultaneously from the in vitro and in vivo studies. Given the final model structure and results, the following assumptions were tested and supported: (1) degradation of TT and DAR moieties occurs similarly in vivo in the central compartment as in vitro with plasma at 37°C;and (2) individual DAR moieties have the same PK disposition regardless of whether they are initially present in the dose product or formed during the deconjugation process. The alternative model parameterization, which tested k1 → 0 as a single deconjugation parameter with the other intercompartmental deconjugation rate constants as factors of k1 → 0 related to DM1 load, had poorer fits; the NONMEM OFV for the alternative model fit to the rat and cynomolgus monkey data were 98 and 110 points higher, respectively.
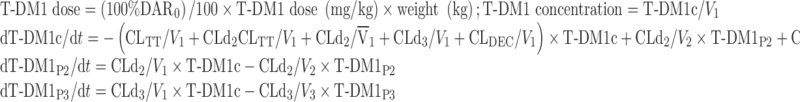
Figure 2 shows the VPCs for TT and individual DAR moieties from the final mechanistic model fit to rat data. Specifically, the upper panels show VPCs for the in vitro rat plasma stability data; VPCs for the rat T-DM1DAR 3.1 and T-DM1DAR 1.5in vivo PK data are shown in the middle and lower panels, respectively. In the upper panels, the left-most panel shows in vitro TT concentrations declining over time from ~100 μg/mL with a half-life of 4.4 days, as calculated from the kplasma parameter estimate (ln(2)/0.156 day-1). The DAR panels to the right of TT are VPCs of the individual DAR moieties that comprise TT. DAR1 and DAR0 show an increase over time as these moieties have slower deconjugation rates and receive input from the higher DAR moieties.
Fig. 2.
VPCs of TT and DAR0–DAR7 concentrations for the mechanistic deconjugation model fit to data from: top, In vitro rat plasma stability study with 100 μg/mL T-DM1DAR 3.1; middle, rat PK study with 10 mg/kg T-DM1DAR 3.1; bottom, rat PK study with10 mg/kg T-DM1DAR 1.5. For all plots, the shaded area is the 50th percentile with 95% CI, and the solid red line is the median of the observed data (blue circles). Both axes are shown on log scale for visualization purposes. DAR n n DM1 molecules bound to trastuzumab (drug-to-antibody ratio), VPC visual predictive check, TT total trastuzumab, PK pharmacokinetic, T-DM1 trastuzumab emtansine
For the in vivo rat data, shown in the middle and lower panels of Fig. 2, the VPC trend is similar to the in vitro data but with added in vivo distributional and elimination components. For both T-DM1DAR 3.1 and T-DM1DAR 1.5, the left-most panel shows TT concentrations declining over time based on three-compartmental PK behavior. Subsequent panels show profiles of each DAR moiety that comprise TT; for each DAR, the initial concentration corresponds to its percentage in the dose product, and its elimination proceeds at a rate governed by kplasma, CLTT/V1, and the respective kn → n − 1 deconjugation rate constant. In vivo concentrations of DAR0 increase over time in the middle panel (T-DM1DAR 3.1 dose product), as DAR0 input is primarily from the higher DAR moieties. This increase is masked in the bottom panel (T-DM1DAR 1.5 dose product) as there was no DAR7 or DAR6 and a higher initial percentage of DAR0 was present. For all analytes, the median line through the observed data falls mostly within the 95% CI of the 50th percentile.
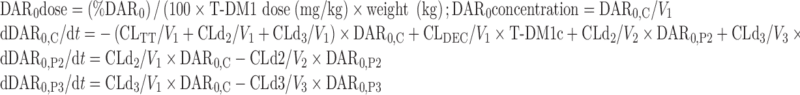
Figure 3 shows the VPCs for TT and individual DAR moieties from the final mechanistic PK model fit to cynomolgus monkey data. The upper panels show VPCs for the in vitro cynomolgus monkey plasma stability data; VPCs for the cynomolgus monkey T-DM1DAR 3.1in vivo PK data are shown in the lower panels. These results follow the same pattern as in Fig. 2, as both rat and cynomolgus monkey data were described with the same model structure and the trends for parameter estimates were similar. For all analytes, the median line through the observed data falls mostly within the 95% CI of the 50th percentile.
Fig. 3.
VPCs of TT and DAR0–DAR7 concentrations for the mechanistic deconjugation model fit to data from: top, In vitro cynomolgus monkey plasma stability study with 100 μg/mL T-DM1DAR 3.1; bottom, cynomolgus monkey PK study with 30 mg/kg T-DM1DAR 3.1. For all plots, the shaded area is the 50th percentile with 95% CI, and the solid red line is the median of the observed data (blue circles). Both axes are shown on log scale for visualization purposes. VPC visual predictive check, TT total trastuzumab, DAR drug-to-antibody ratio, T-DM1 trastuzumab emtansine, PK pharmacokinetic
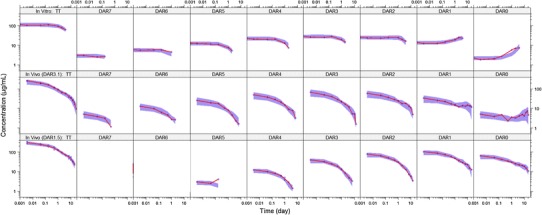
The reduced PK model (Fig. 1b) simultaneously well described the TT and T-DM1 concentration–time data from the in vivo studies. VPCs for TT and T-DM1 concentrations for rats (0.3, 3.0, and 20 mg/kg) are shown in Fig. 4a and for cynomolgus monkeys (10 mg/kg q3w and 30 mg/kg) in Fig. 4b. The median lines through observed data are within the 95% CI of the 50th percentile. For both the mechanistic and reduced T-DM1 PK models, no indications of model misspecifications were evident from model diagnostic plots (data not shown).
Fig. 4.
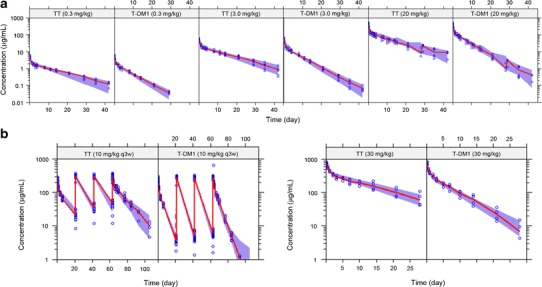
VPCs of TT and T-DM1 concentrations for the reduced model fit to data from a rat PK study with 0.3, 3.0, and 20 mg/kg T-DM1DAR 3.1 and b cynomolgus monkey PK study with 10 mg/kg q3w and 30 mg/kg T-DM1DAR 3.1. For each VPC, the shaded area is the 50th percentile with 95% CI, and the solid red line is the median of the observed data (blue circles). VPC visual predictive check, TT total trastuzumab, T-DM1 trastuzumab emtansine, PK pharmacokinetic, DAR drug-to-antibody ratio
Parameter Estimates
Tables II and III show the final parameter estimates for the mechanistic and reduced T-DM1 PK models, respectively. Relative standard error (RSE) values indicated that most parameters were well estimated. RSE values of the V2 parameter in rats (Table II) and the V3 parameter in cynomolgus monkeys (Table III) were >50% and less well estimated; although these parameter estimates had a higher degree of uncertainty, the VPCs showed that the models described the data well.
Table III.
Reduced T-DM1 PK Model Parameter Estimates
| Rat | Cynomolgus monkey | |||||||||
|---|---|---|---|---|---|---|---|---|---|---|
| Parameter | Description | Unit | Value | RSE (%) | llV (%) | RSE (%) | Value | RSE (%) | llV (%) | RSE (%) |
| CLTT | Total trastuzumab clearance | mL/day | 2.37 | (4.9) | 24.6 | (19) | 19.9 | (9.8) | 19.8 | (23) |
| V 1 | Central volume | mL | 10.7 | (4.0) | 19.8 | (12) | 154 | (4.8) | 7.65 | (18) |
| CLd2 | Distributional Clearance 2 | mL/day | 59.7 | (32) | – | – | 56.8 | (46) | – | – |
| V2 | Peripheral volume 2 | mL | 2.52 | (28) | 68.0 | (39) | 50.0 | (60) | – | – |
| CLd3 | Distributional Clearance 3 | mL/day | 13.9 | (11) | – | – | 60.4 | (35) | – | – |
| V 3 | Peripheral volume 3 | mL | 15.5 | (4.9) | 16.5 | (18) | 84.7 | (50) | 27.3 | (43) |
| CLDEC | Deconjugation clearance | mL/day | 2.24 | (3.4) | 15.3 | (18) | 22.0 | (6.9) | 11.9 | (28) |
| CLT-DM1 a | T-DM1 clearance | mL/day | 4.61 | – | – | – | 41.9 | – | – | – |
| TT t 1/2γ b | Total trastuzumab terminal t1/2 | day | 8.84 | – | – | – | 10.5 | – | – | – |
| T-DM1 t 1/2γ b | T-DM1 terminal t1/2 | day | 4.77 | – | – | – | 5.21 | – | – | – |
| Res err | Residual error | % | 10.9 | (5.6) | – | – | 9.64 | (16) | – | – |
T-DM1 trastuzumab emtansine, IIV interindividual variability, RSE relative standard error, t 1/2 half-life, PK pharmacokinetic
aDerived by: CLT-DM1 = CLTT + CLDEC
bDerived by three-compartment PK equation for terminal half-life
Values for typical compartmental PK parameters (CLTT, V1, CLd2, V2, CLd3, and V3) were estimated using both the mechanistic and reduced T-DM1 PK models and are fundamentally the same. The two modeling approaches yielded similar estimates for CLTT and V1 in both rats and cynomolgus monkeys but slightly different estimates for CLd2, V2, CLd3, and V3; the difference between the distributional parameters was attributed to the different data used for each analysis (i.e., TT and DAR concentration data with the mechanistic model but TT and T-DM1 concentration data with the reduced model). Of note, PK simulations using the final parameter estimates from both models showed that the TT profiles were similar. This is illustrated with the VPCs in Fig. 3 (mechanistic model) and Fig. 4b (reduced model) for cynomolgus monkeys administered 30 mg/kg T-DM1. As shown, the same TT data is similarly well predicted by both PK parameter results.
In addition to standard compartmental PK parameters, the mechanistic T-DM1 PK model provided estimates for the individual DM1 deconjugation rate constants and the kplasma rate constant. From the model building procedure, the individual DM1 deconjugation rate constants of k7 → 6, k5 → 4, k4 → 3, and k3 → 2 were found to be equivalent in both species; additional DM1 deconjugation in the peripheral compartments were tested but did not improve the OFV. In both rats and cynomolgus monkeys, DM1 deconjugation rates were fastest for DAR moieties with ≥3 DM1 per trastuzumab and in turn >DAR2 and DAR1. Overall, DM1 deconjugated approximately 40% and 34% faster from DAR7–DAR3 moieties versus DAR2 in rats and cynomolgus monkeys, respectively. DM1 deconjugation from DAR1 was the slowest step in the deconjugation chain, approximately 3.4- and 2.7-fold slower than DAR2 in rats and cynomolgus monkeys, respectively. Values for kplasma were different for rats and cynomolgus monkeys, at 0.156 and 0.0939 day−1, respectively.
The reduced PK model employed T-DM1 clearance via two mechanisms: antibody clearance mechanisms (CLTT) and deconjugation clearance mechanisms (CLDEC). In both rats and cynomolgus monkeys, CLDEC was approximately equal to that of CLTT, indicating deconjugation as a major pathway of T-DM1 clearance (Table III). T-DM1 clearance (CLTDM1) was derived as the sum of CLTT and CLDEC values. In both rats and cynomolgus monkeys, CLTDM1 was twice as fast as CLTT indicating a 50% shorter terminal t1/2 for T-DM1 versus TT. CLDEC was approximately 50% of CLTDM1 in both rats and cynomolgus monkeys, indicating that the overall T-DM1 deconjugation is similar between species.
Mechanistic PK Model Predictions
Figure 5a and b show the predicted concentration–time curves for TT, T-DM1, conjugated DM1, and DAR0–DAR7 based on the cynomolgus monkey mechanistic PK model to fully illustrate the system and some subtleties of T-DM1 PK. The average DAR (DARAVG)–time curve is also shown.
Fig. 5.
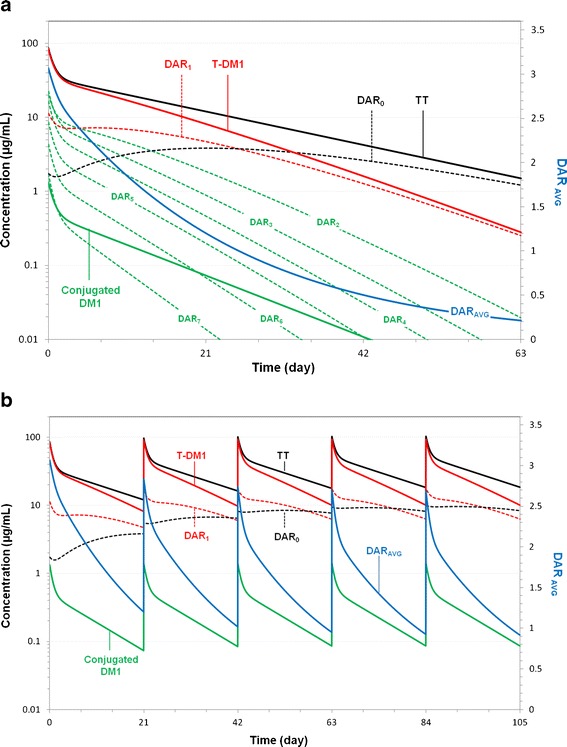
Model predictions of TT, T-DM1, conjugated DM1; DAR0–DAR7 concentration–time curves; and DARAVG–time curve, based on the final parameter estimates from the mechanistic T-DM1 PK model fit to cynomolgus monkey data. The T-DM1 curve is the composite of the seven curves representing DAR1–DAR7 moieties. The TT curve is the composite of the 8 curves representing DAR0–DAR7 moieties. Predictions are for a cynomolgus monkey administered a single dose of 3.6 mg/kg T-DM1DAR 3.1 and b cynomolgus monkey administered multiple q3w doses of 3.6 mg/kg T-DM1DAR 3.1. DAR AVG average drug-to-antibody ratio, TT total trastuzumab, T-DM1 trastuzumab emtansine, PK pharmacokinetic
The initial concentration of each DAR moiety derives from its percentage in the dose product divided by the central volume (Fig. 5a). Only TT and DAR7 analytes showed the triphasic log-linear disposition; these analytes have only distributional and elimination processes as the intercompartmental deconjugation rates do not affect their disposition. T-DM1 and DAR6–DAR0 moieties are approximately log-linear, as they have additional “formation” component(s) from higher DAR moieties. The DARAVG curve begins at 3.1 and decreases over time as DM1 molecules deconjugate from individual DAR moieties. The shape of the DARAVG curve results from the relative initial amounts of each DAR species and the individual DM1 deconjugation rates. Specifically, the more rapid decline to DARAVG = 2 at 6 days arises from the fact that most of T-DM1 dose (DAR3–DAR7; 62%) deconjugates faster. The DARAVG value remains above 1.0 for up to 20 days due to the slower elimination of DAR0–DAR2. The conjugated DM1 concentration–time curve reflects the amount of DM1 still conjugated to trastuzumab, and its shape derives from the product of the TT and DARAVG curve.
The terminal half-lives (t1/2γ) for TT and unconjugated trastuzumab (DAR0) are equivalent. This is illustrated in Fig. 5a as TT and DAR0 curves eventually merge together. For the other DAR moieties, t1/2γ can be calculated from CLTT, V1, CLd2, V2, CLd3, V3, and the respective DM1 deconjugation rate constant (kn → n − 1) parameters; the input rate from the respective higher DAR moieties (kn + 1 → n) is not involved for calculation of t1/2γ as these rates are greater or equal to the output rate, and formation rate limited kinetics do not apply. Similar to TT, the t1/2γ for T-DM1 is equal to that of DAR1. This is also illustrated in Fig. 5a as T-DM1 and DAR1 curves eventually merge together. T-DM1 and DAR1t1/2γ are functions of CLTT, V1, CLd2, V2, CLd3, V3, and k1 → 0. k1 → 0 describes the rate at which the final DM1 is lost, and thus the transition from T-DM1 to unconjugated trastuzumab.
Figure 5b shows model-predicted curves for a 3.6 mg/kg q3w dose to illustrate concepts for the T-DM1 PK system at steady state. First, steady-state T-DM1 maximum concentrations (Cmax) and trough concentrations (Ctrough) are slightly lower than TT Cmax and Ctrough. This arises from the shorter half-life of T-DM1 due to the additional DM1 deconjugation clearance and not due to differences in distributional volumes. Second, the maximum DARAVG reduces slightly from 3.1 to 2.8 after repeated doses of T-DM1 due to the accumulation of DAR0 and DAR1, which have a longer half-life than the other DAR moieties.
Figure 6a–d shows the mechanistic model-predicted curves using the T-DM1DAR 3.1 and T-DM1DAR 1.5 dose products, in which potential PK drivers of a PD response (i.e., steady-state T-DM1 trough concentrations, T-DM1 AUC, conjugated DM1 concentrations, and cumulative DM1eq) were simulated. In this experimental paradigm, the use two or more ADC dose products is posited as to help elucidate PK drivers of PD responses. For example, preclinical PK/PD experiments comparing 3.6 mg/kg q3w T-DM1DAR 3.1 and 5.16 mg/kg q3w T-DM1DAR 1.5 (Fig. 6b) would test T-DM1 AUC as a PK driver for some PD response (e.g., adverse effects, biomarker upregulation, and antitumor response). If the PD response is equal between dose products, the hypothesis is supported; if the PD response is greater for the T-DM1DAR 3.1 dose product, conjugated DM1 concentrations or cumulative DM1eq may be the PK driver; confirmatory experiments as outlined in Fig. 6c, d, respectively, could then be designed.
Fig. 6.
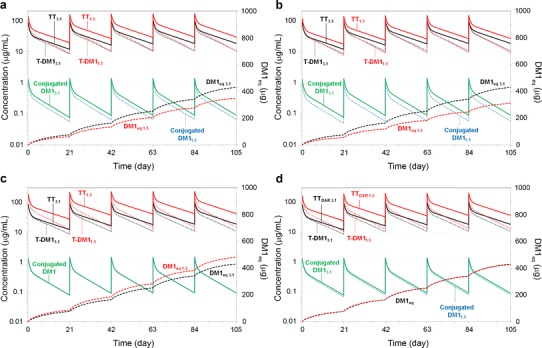
Model predictions of TT, T-DM1, and conjugated DM1 concentration–time curves and the cumulative DM1eq–time curve, based on the final parameter estimates from the mechanistic T-DM1 PK model fit to cynomolgus monkey data; subscripts on plots (i.e., 1.5 and 3.1) indicate whether predictions are from the T-DM1DAR 1.5 or T-DM1DAR 3.1 dose product. Predictions for conjugated DM1 and DM1eq are equivalent between dose products in Fig. 6c, d, respectively. Predictions are for cynomolgus monkeys administered multiple q3w doses of 3.6 mg/kg T-DM1DAR 3.1 and a 5.8 mg/kg T-DM1DAR 1.5; b 5.16 mg/kg T-DM1DAR 1.5; c 8.0 mg/kg T-DM1DAR 1.5; and d 7.1 mg/kg T-DM1DAR 1.5. DM1eq = DM1 equivalents; TT total trastuzumab, T-DM1 trastuzumab emtansine, PK pharmacokinetic
DISCUSSION
This M&S analysis, to our knowledge, presents the first mechanistic PK model of an ADC, which has integrated the individual ADC DAR moieties and their deconjugation processes. Fundamental questions typically arise when considering ADC disposition, and the mechanistic PK model developed for T-DM1 (Fig. 1a) was instrumental in facilitating the following primary conclusion: (1) the conjugation of DM1 (mol. wt. = 737 Da) does not appear to significantly alter the disposition of the parent trastuzumab antibody (mol. wt. = 146 kDa)—individual DAR1–DAR7 moieties are shown to be well described alongside DAR0 (i.e., unconjugated trastuzumab antibody) using the same antibody clearance pathways (i.e., CLTT, CLd2, and CLd3) and distributional volumes (i.e., V1, V2, and V3). The CLTT value for cynomolgus monkeys (17.4 mL/day), determined from the model, is similar to the reported trastuzumab CL value of 5.52 mL/day kg−1 (~19.3 mL/day) (17). Additionally, the central volume (V1) determined for rats and monkeys reported from the model (11.0 and 148 mL, respectively) approximates the plasma volume for both animal species (18), as is typical for trastuzumab and other monoclonal antibodies (17). We note that if naked antibody PK data is available during model development, such data could be added to the dataset as 100% DAR0 (i.e., free trastuzumab) and tested via modeling for differences in disposition; notably, the T-DM1DAR 1.5 dose product had 21% DAR0 present and did not require different clearance pathways or volumes. Additionally, if levels of ADC target receptor data are measured, or if PK data is nonlinear, a target-mediated drug disposition (TMDD) approach may be integrated into the model (14,19).
Other conclusions supported by the mechanistic PK model include: (2) DM1 deconjugation appears to occur at similar rates in vitro as in vivo in the central compartment—DM1 deconjugation also occurs inside target cells to provide its antitumor effect; however, this is an elimination route (i.e., component of CLTT), as intracellular DM1 deconjugation involves degradation of the carrier trastuzumab antibody, which does not reenter systemic circulation intact as a lower DAR moiety; (3) DM1 deconjugates faster from DAR3–DAR7 than from DAR1 and DAR2 moieties—this phenomenon is not clearly understood. It can be hypothesized that higher conjugated DAR moieties have more probability to lose DM1 than less conjugated DAR moieties, or alternatively, that they have DM1 molecules that are conjugated to more solvent–accessible lysine residues on trastuzumab, making them less resistant to deconjugation (20,21); and (4) the rate-limiting step for DM1 deconjugation is the k1 → 0 parameter—as DM1 deconjugation is the other T-DM1 elimination pathway along with CLTT, DM1 deconjugation is confirmed as the mechanism by which T-DM1 has a faster clearance with respect to its parent antibody trastuzumab.
The mechanistic PK model enabled the prediction of the conjugated DM1 concentration–time and DARAVG–time curves under single-dose and steady-state dose simulations (Fig. 5a, b). A similar DARAVG–time profile was also presented in a mouse PK study for another ADC containing DM1, cantuzumab mertansine, in which the DARAVG was experimentally measured using radiolabel experiments (22); herein, the authors concluded that elimination was a first-order or pseudo first-order process. We conclude that the shape of the DARAVG–time curve has underlying complex kinetics deriving from the relative initial amounts of each DAR species and the individual DAR deconjugation rates making up the ADC and is not an overall first-order process. The DAR moieties comprising T-DM1 “compete” for cellular uptake via the HER2 receptor on tumor cells; the conjugated DM1 curve incorporates the average DM1 drug load and may be a more appropriate PK representation of drug at the site of action. The mechanistic PK model also enabled the prediction of the cumulative DM1eq (μg) released from the deconjugation progress (Fig. 6a–d); additional PK experiments are necessary to incorporate DM1 disposition into the model in order to directly predict DM1 concentrations—e.g., measuring DM1 concentrations following both IV DM1 and IV T-DM1 dosing.
To date, a PK/PD model of antitumor T-DM1 efficacy (23) and a PK/PD model of T-DM1-mediated thrombocytopenia (TCP) (24) have been developed in which the PD effect was driven by T-DM1 concentrations measured by ELISA. Using the mechanistic PK model developed herein, model–based approaches towards evaluating additional PK drivers of PD responses may be undertaken. Regarding T-DM1 antitumor efficacy, potential PK drivers include: (1) T-DM1 concentrations, where the binding of the anti-HER2 region of T-DM1 drives response, such that the antitumor effects between DAR moieties are equal; (2) the individual DAR moiety concentrations, where more heavily loaded DARs may have more antitumor effect; and (3) conjugated DM1 concentrations, where the overall DM1 drug load still attached to antibody may more appropriately drive response. Notably, for a monomethyl auristatin E (MMAE)-containing ADC, DAR moieties of two, four, and eight MMAE per antibody had differing PK and antitumor activities in animal models (25); here, if individual DAR measurements over time were measured, a mechanistic PK model could be used to assess individual DAR or conjugated cytotoxin concentrations as drivers for tumor response in a PK/PD model building strategy, in addition to ADC concentrations as PK driver approach (23).
In this M&S analysis, PK data from two T-DM1 dose products (T-DM1DAR 3.1 and T-DM1DAR 1.5) were used to develop the mechanistic PK model and to elucidate T-DM1 PK. We posit that, during preclinical drug development, PK/PD experiments using multiple ADC dose products may be designed to elucidate the PK driver for PD response. With regard to antitumor efficacy, a practical approach using this paradigm would be to develop a similar mechanistic PK model using tumor bearing mouse ADC and DAR PK data from two or more ADC dose products. Model predictions are then done to establish dose equivalencies for various PK drivers for the ADC dose products, as illustrated in Fig. 6a–d for T-DM1DAR 3.1 and T-DM1DAR 1.5. PK/PD experiments are subsequently conducted in a tumor bearing mouse model, with hypothesis-driven ADC dose amounts and dose products as described, to elucidate the PK driver for antitumor effect. If coupled with a similar PK/PD approach for any adverse effects, the mechanistic model approach further supports ADC dose and dose product selection towards minimizing toxicity and maximizing efficacy.
As practical limitations may prevent affinity capture LC-MS from being routinely used in clinical ADC analysis, we show that T-DM1 disposition can be described with a reduced modeling approach (Fig. 1b) using ELISA measurements, even though the underlying PK involves multiple processes. Here, T-DM1 concentrations are represented by a single compartment (composite of DAR1–DAR7) and a single clearance parameter (CLDEC) from T-DM1 to unconjugated trastuzumab well describes the divergence of T-DM1 from the TT curve. We note that this “average” deconjugation rate constant (CLDEC/V1) from the reduced model cannot be mathematically derived from parameter values determined in the mechanistic model; the T-DM1 curve, as predicted by the mechanistic PK model, depends on the individual DAR%, the individual deconjugation rates, and antibody clearance mechanisms and does not simplify mathematically. The reduced modeling approach developed for T-DM1 can be also be applied towards preclinical discovery and clinical development of other ADCs by providing a framework for (1) assessing linker stability of ADCs, (2) evaluating methodologies for allometric scaling of ADCs, (3) evaluating PK drivers for PK/PD models of toxicity or efficacy, and (4) optimal PK sampling design. These concepts are discussed further.
ADC-mediated efficacy and toxicity is influenced by the stability of the linker, where the systemic cytotoxin release from less stable linkers results in loss of efficacy and potential for toxicity. From the reduced model, CLDEC can be viewed as a quantitative measure of linker stability, where higher CLDEC values describe a less stable linker, and can, thus, inform ADC design. In addition, CLDEC can be used to evaluate species differences; for T-DM1, CLDEC was approximately 50% of CLTDM1 in both rats and cynomolgus monkeys, indicating that the overall T-DM1 deconjugation is similar between species. The reduced model does not, however, predict the amount nor time course of DM1 released; this involves multiple steps and is dependent on the percentage of DAR in the starting material as mentioned.
With regard to allometry, scaling of antibody clearance from cynomolgus monkeys to humans has been successful given that cynomolgus monkeys are a similar antibody binding species (17). For ADCs, allometric scaling is somewhat more complex, as multiple analytes (i.e., total antibody, ADC, and DAR moieties) and clearance pathways (i.e., CLantibody, CLin vivo, CLADC, and CLDEC) are involved. In a clinical PK analysis of T-DM1, both TT and T-DM1 concentrations were measured after T-DM1 dosing; this analysis found approximately 2-fold higher clearance and 2-fold shorter half-lives for T-DM1 than for TT (26), identical to results herein for both rats and cynomolgus monkeys. Similarly, results from separate clinical population PK analyses of T-DM1 (27) and trastuzumab (28) indicated that the typical clearance for T-DM1 (0.70 L/day) was approximately 3-fold higher than trastuzumab clearance (0.225 L/day). Allometric scaling for T-DM1 is under investigation using both modeling approaches.
As mentioned, T-DM1 is being considered for front-line treatment of metastatic breast cancer, and HER2-positive patients may benefit from a dual pharmacologic effect of trastuzumab combined with the targeted delivery of T-DM1 (9). Thus, the measurement of both TT and T-DM1 concentrations is warranted, and a single population model of these two analytes can be developed in the reduced model approach. Moreover, TT and T-DM1 can be evaluated as dual PK drivers of antitumor response. Regarding T-DM1-mediated TCP (24), CLDEC could be assessed as a correlate for toxicity, given that it is related to the release of DM1; higher CLDEC values in patients may correlate with higher incidence of Grade 3/4 TCP, and this is under investigation. Similarly, CLDEC could be assessed as a correlate for efficacy; lower CLDEC values in patients may correlate with higher incidences of treatment response. Finally, the reduced T-DM1 model can be used to develop an optimal sampling strategy to streamline clinical development, analytical, and time costs so that not only are plasma sampling time points optimized but also the necessary ELISA analyses (i.e., for antibody, ADC, or both) (29).
CONCLUSIONS
The complex PK of T-DM1, a prototypical lysine-linked ADC, was elucidated via development of a mechanistic PK model fit simultaneously to TT and DAR concentrations from in vitro and in vivo data. A reduced PK model, fit simultaneously to TT and T-DM1 concentrations from ELISA, was also developed as a practical alternative modeling approach. These modeling approaches can readily be applied to other ADCs such as the THIOMABs, which are engineered cysteine-linked ADCs having homogenous DAR starting material (30,31); these DAR moieties can also be measured similarly by affinity capture LC-MS (12,13) and any deconjugation processes quantified. An additional affinity capture LC-MS method has been recently developed that is able to measure individual DAR moieties from interchain cysteine-linked ADCs (32,33). Overall, this modeling analysis seeks to provide insight and guidance with regard to the PK analysis and PK/PD modeling for ADCs, using T-DM1 as a case study. ADCs are emerging as novel, exciting therapeutics in oncology (34); the elucidation of T-DM1 PK presented herein, as well as the M&S analyses and strategies, may be applicable to other ADCs.
Appendix 1: Calculation of exposure (AUC) for T-DM1 and its individual DAR moieties
As illustrated in Fig. 1a, each DAR moiety is eliminated from its respective compartment via two rates: (1) deconjugation to the next DAR moiety, and (2) antibody clearance mechanisms. In order to derive the equations for the individual DAR exposures (i.e., AUCDAR0–AUCDAR7) and T-DM1 exposure (i.e., the sum of AUCDAR1–AUCDAR7), we define the following:
Dose = T-DM1 dose (mg/kg) × weight (kg)
fnn = fraction of DAR moiety (n) in the T-DM1DAR 3.1 dose product; e.g., fn7 = 0.02 (See Methods: Preparation of T-DM1DAR 3.1 and T-DM1DAR 1.5 Dose Products)
kTT = rate constant for antibody clearance mechanisms = (CLTT/V1); e.g., kTT = 17.4/148 = 0.118 day−1; Table II, cynomolgus monkeys
kn,TOT = total elimination rate for each DAR moiety (n) = (kn → n − 1 + kTT); e.g., k7,TOT = k7 → 6 + kTT = 0.341 + 0.118 = 0.459 day−1; Table II, cynomolgus monkeys
The system of T-DM1 deconjugation is a catenary chain containing the moieties DAR0–DAR7. Not only does the exposure of each moiety derive from its initial percentage in the dose product but also from input from higher DAR species. The fraction of each DAR moiety serving as input into the other compartments is calculated as follows:
Fn → n − 1 = fraction of DAR moiety (n) as input to next DAR (n − 1) compartment = (kn → n − 1/(kn → n − 1 + kTT)); e.g., F7 → 6 = (k7 → 6/(k7 → 6 + kTT)) = (0.341/(0.341 + 0.118)) = 0.742; Table II, cynomolgus monkeys
- The fraction of DAR moiety as input to all DAR compartments is as follows, using DAR7 as an example:
- F7 → 6 = the fraction of DAR7 as input to DAR6
- F7 → 5 = F7 → 6 × F6 → 5; the fraction of DAR7 as input to DAR5
- F7 → 4 = F7 → 6 × F6 → 5 × F5 → 4; the fraction of DAR7 as input to DAR4
- F7 → 3 = F7 → 6 × F6 → 5 × F5 → 4 × F4 → 3; the fraction of DAR7 as input to DAR3
- F7 → 2 = F7 → 6 × F6 → 5 × F5 → 4 × F4 → 3 × F3 → 2; the fraction of DAR7 as input to DAR2
- F7 → 1 = F7 → 6 × F6 → 5 × F5 → 4 × F4 → 3 × F3 → 2 × F2 → 1; the fraction of DAR7 as input to DAR1
- F7 → 0 = F7 → 6 × F6 → 5 × F5 → 4 × F4 → 3 × F3 → 2 × F2 → 1 × F1 → 0; the fraction of DAR7 as input to DAR0
Equations for the AUC of the individual DAR0–DAR7 moieties are shown below. Here, the total amount of each DAR, deriving from its percentage in the dose product and from input from the higher DAR moieties, is divided by its respective clearance to yield AUC.
AUCDAR7 = Dose × fn7/(V1 × k7,TOT)
AUCDAR6 = dose × (F7 → 6 × fn7 + fn6)/(V1 × k6,TOT)
AUCDAR5 = Dose × (F7 → 5 × fn7 + F6 → 5 × fn6 + fn5)/(V1 × k5,TOT)
AUCDAR4 = dose × (F7 → 4 × fn7 + F6 → 4 × fn6 + F5 → 4 × fn5 + fn4)/(V1 × k4,TOT)
AUCDAR3 = dose × (F7 → 3 × fn7 + F6 → 3 × fn6 + F5 → 3 × fn5 + F4 → 3 × fn4 + fn3)/(V1 × k3,TOT)
AUCDAR2 = dose × (F7 → 2 × fn7 + F6 → 2 × fn6 + F5 → 2 × fn5 + F4 → 2 × fn4 + F3 → 2 × fn3 + fn2)/(V1 × k2,TOT
AUCDAR1 = dose × (F7 → 1 × fn7 + F6 → 1 × fn6 + F5 → 1 × fn5 + F4 → 1 × fn4 + F3 → 1 × fn3 + F2 → 1 × fn2 + fn1)/(V1 × k1,TOT)
AUCDAR0 = dose × (F7 → 0 × fn7 + F6 → 0 × fn6 + F5 → 0 × fn5 + F4 → 0 × fn4 + F3 → 0 × fn3 + F2 → 0 × fn2 + F1 → 0 × fn1 + fn0)/(V1 × kTT)
The overall T-DM1 exposure is the sum of the individual DAR1–DAR7 AUCs.
-
AUCTDM1 = AUC DAR7 + AUCDAR6 + AUCDAR5 + AUCDAR3 + AUC DAR2 + AUCDAR1, thus
AUCTDM1 = dose × fn7/(V1 × k7,TOT) + dose × (F7 → 6 × fn7 + fn6)/(V1 × k6,TOT) + …etc.
- Substitution, in the above equation, with the Table II parameter values for cynomolgus monkeys and the fn1–fn7 values for the T-DM1DAR 3.1 dose product (see “Preparation of T-DM1DAR 3.1 and T-DM1DAR 1.5 Dose Products”) yields:
- T-DM1DAR 3.1 dose product at 3.6 mg/kg has an AUCTDM1 = 538 μg/mL × day−1
Appendix 2: Dose calculations (mg/kg) for T-DM1 dose products targeting a specified T-DM1 AUC
Appendix 1 derived the mathematical equations for T-DM1 AUC and its individual DAR AUCs. From these equations, the dose (mg/kg) of the T-DM1DAR 1.5 dose product equivalent to 3.6 mg/kg T-DM1DAR 3.1 by AUC is calculated here.
- From Appendix 1:
- T-DM1DAR 3.1 dose product at 3.6 mg/kg has an AUCTDM1 = 538 μg/mL × day−1
- AUCTDM1 = dose × fn7/(V1 × k7,TOT) + dose × (F7 → 6 × fn7 + fn6)/(V1 × k6,TOT) + … etc.
- Rearrangement yields:
- Dose = AUCTDM1/(fn7/(V1 × k7,TOT) + (F7 → 6 × fn7 + fn6)/(V1 × k6,TOT) + … etc.)
- Substitution, in the above equation with the Table II parameter values for cynomolgus monkeys, and the appropriate fn1–fn7 values for the T-DM1DAR 1.5 dose product (see “Preparation of T-DM1DAR 3.1 and T-DM1DAR 1.5 Dose Products”) yields:
- T-DM1DAR 1.5 dose product at 5.16 mg/kg has an AUCTDM1 = 538 μg/mL × day−1
Footnotes
Jay Tibbitts and Lena E. Friberg contributed equally to this work.
REFERENCES
- 1.Chen J, Jaracz S, Zhao X, Chen S, Ojima I. Antibody–cytotoxic agent conjugates for cancer therapy. Expert Opin Drug Deliv. 2005;2(5):873–90. doi: 10.1517/17425247.2.5.873. [DOI] [PubMed] [Google Scholar]
- 2.Wu AM, Senter PD. Arming antibodies: prospects and challenges for immunoconjugates. Nat Biotechnol. 2005;23(9):1137–46. doi: 10.1038/nbt1141. [DOI] [PubMed] [Google Scholar]
- 3.Lopus M. Antibody–DM1 conjugates as cancer therapeutics. Cancer Lett. 2011;307(2):113–8. doi: 10.1016/j.canlet.2011.03.017. [DOI] [PMC free article] [PubMed] [Google Scholar]
- 4.Chari RV, Martell BA, Gross JL, Cook SB, Shah SA, Blattler WA, et al. Immunoconjugates containing novel maytansinoids: promising anticancer drugs. Cancer Res. 1992;52(1):127–31. [PubMed] [Google Scholar]
- 5.Lewis Phillips GD, Li G, Dugger DL, Crocker LM, Parsons KL, Mai E, et al. Targeting HER2-positive breast cancer with trastuzumab emtansine, an antibody–cytotoxic drug conjugate. Cancer Res. 2008;68(22):9280–90. doi: 10.1158/0008-5472.CAN-08-1776. [DOI] [PubMed] [Google Scholar]
- 6.Burris HA, 3rd, Tibbitts J, Holden SN, Sliwkowski MX, Lewis Phillips GD. Trastuzumab emtansine (T-DM1): a novel agent for targeting HER2+ breast cancer. Clin Breast Cancer. 2011;11(5):275–82. doi: 10.1016/j.clbc.2011.03.018. [DOI] [PubMed] [Google Scholar]
- 7.Shen B-Q, Bumbaca D, Saad O, Yue Q, Pastuskovas CV, Khojasteh SC, et al. Catabolic fate and pharmacokinetic characterization of trastuzumab emtansine (T-DM1): an emphasis on preclinical and clinical catabolism. Curr Drug Metab. 2012;13:901–10. doi: 10.2174/138920012802138598. [DOI] [PubMed] [Google Scholar]
- 8.Erickson HK, Phillips GL, Leipold DD, Provenzano CA, Mai E, et al. The effect of different linkers on target cell catabolism and pharmacokinetics/pharmacodynamics of trastuzumab maytansinoid conjugates. Mol Cancer Ther. 2012;11(5):1133–42. doi: 10.1158/1535-7163.MCT-11-0727. [DOI] [PubMed] [Google Scholar]
- 9.Junttila TT, Guangmin L, Parsons K, Phillips GL, Sliwkowski MX. Trastuzumab-DM1 (T-DM1) retains all the mechanisms of action of trastuzumab and efficiently inhibits growth of lapatinib insensitive breast cancer. Breast Cancer Res Treat. 2011;128(2):347–56. doi: 10.1007/s10549-010-1090-x. [DOI] [PubMed] [Google Scholar]
- 10.Slikowski MX, Lofgre J, Lewis GD, Hotalin TE, Fendly BM, Fox JA. Nonclinical studies addressing the mechanism of action of Herceptin® (Trastuzumab) Semin Oncol. 1999;26(4 Suppl 12):60–70. [PubMed] [Google Scholar]
- 11.Lin K, Tibbitts J. Pharmacokinetic considerations for antibody drug conjugates. Pharm Res. 2012;29(9):2354–66. doi: 10.1007/s11095-012-0800-y. [DOI] [PubMed] [Google Scholar]
- 12.Xu K, Liu L, Saad OM, Baudys J, Williams L, Leipold D, et al. Characterization of intact antibody–drug conjugates from plasma/plasma in vivo by affinity capture capillary liquid chromatography-mass spectrometry. Anal Biochem. 2011;412:56–66. doi: 10.1016/j.ab.2011.01.004. [DOI] [PubMed] [Google Scholar]
- 13.Xu K, Liu L, Dere R, Mai E, Erickson R, Hendricks A, et al. Characterization of the drug-to-antibody ratio distribution for antibody–drug conjugates in plasma/serum. Bioanalysis. 2013;5(9):1057–71. doi: 10.4155/bio.13.66. [DOI] [PubMed] [Google Scholar]
- 14.Gibiansky L, Gibiansky E. Target-mediated drug disposition model and its approximations for antibody–drug conjugates. J Pharmacokinet Pharmacodyn. 2014;41:35–47. doi: 10.1007/s10928-013-9344-y. [DOI] [PubMed] [Google Scholar]
- 15.Beal SL, Boeckman AJ, Sheiner LB, editors. NONMEM User’s guide, part IV. San Francisco: University of California at San Francisco; 1988–1992. [Google Scholar]
- 16.Linbolm L, Pihlgren P, Jonsson EN. Psn-Toolkit: a collection of computer intensive statistical methods for non-linear mixed effect modeling using NONMEM. Comput Methods Programs Biomed. 2005;79(3):241–57. doi: 10.1016/j.cmpb.2005.04.005. [DOI] [PubMed] [Google Scholar]
- 17.Deng R, Iyer S, Theil FP, Mortensen DL, Fielder PJ, Prabhu S. Projecting human pharmacokinetics of therapeutic antibodies from nonclinical data. mAbs. 2011;3(1):61–6. doi: 10.4161/mabs.3.1.13799. [DOI] [PMC free article] [PubMed] [Google Scholar]
- 18.Davies B, Morris T. Physiological parameters in laboratory animals and humans. Pharm Res. 1993;10(7):1093–5. doi: 10.1023/A:1018943613122. [DOI] [PubMed] [Google Scholar]
- 19.Mager DE, Jusko WJ. General pharmacokinetic model for drugs exhibiting target-mediated drug disposition. J Pharmacokin Pharmacodyn. 2001;28:507–32. doi: 10.1023/A:1014414520282. [DOI] [PubMed] [Google Scholar]
- 20.Shen B-Q, Xu K, Liu K, Raab H, Bhakta S, et al. Conjugation site modulated the in vivo stability and therapeutic activity of antibody–drug conjugates. Nat Biotechnol. 2012;30(2):184–9. doi: 10.1038/nbt.2108. [DOI] [PubMed] [Google Scholar]
- 21.Erickson HK, Lambert JM. ADME of antibody–maytansinoid conjugates. AAPS J. 2012;14(4):799–805. doi: 10.1208/s12248-012-9386-x. [DOI] [PMC free article] [PubMed] [Google Scholar]
- 22.Xie H, Audette C, Hoffee M, Lambert JM, Blattler WA. Pharmacokinetics and biodistribution of the antitumor immunoconjugate, cantuzumab mertansine (huc242-dm1), and its two components in mice. J Pharmacol Exp Ther. 2004;308(3):1073–82. doi: 10.1124/jpet.103.060533. [DOI] [PubMed] [Google Scholar]
- 23.Jumbe NL, Xim Y, Leipold D, Crocker L, Dugger D, Mai E, et al. Modeling the efficacy of trastuzumab-DM1, and antibody drug conjugate, in mice. J Pharmacokinet Pharmacodyn. 2010;37(3):221–42. doi: 10.1007/s10928-010-9156-2. [DOI] [PubMed] [Google Scholar]
- 24.Bender BC, Schaedeli-Stark F, Koch R, Joshi A, Chu YW, Rugo H, et al. A population pharmacokinetic/pharmacodynamic model of thrombocytopenia characterizing the effect of trastuzumab emtansine (T-DM1) on platelet counts in patients with HER2-positive metatstatic breast cancer. Cancer Chemother Pharmacol. 2012;70(4):591–601. doi: 10.1007/s00280-012-1934-7. [DOI] [PubMed] [Google Scholar]
- 25.Hamblett KJ, Senter PD, Chace DF, Sun MM, Lenox J, Cerveny CG, et al. Effects of drug loading on the antitumor activity of a monoclonal antibody drug conjugate. Clin Cancer Res. 2004;10(20):7063–70. doi: 10.1158/1078-0432.CCR-04-0789. [DOI] [PubMed] [Google Scholar]
- 26.Girish S, Gupta M, Wang B, Lu D, Krop IE, Vogel CL, et al. Clinical pharmacology of trastuzumab emtansine (T-DM1): an antibody–drug conjugate in development for the treatment of HER2-postive cancer. Clin Chemother Pharmacol. 2012;69(5):1229–40. doi: 10.1007/s00280-011-1817-3. [DOI] [PMC free article] [PubMed] [Google Scholar]
- 27.Gupta M, LoRusso PM, Wang B, Yi JH, Burris HA, 3rd, Beeram M, et al. Clinical implications of pathophysiological and demographic covariates on the population pharmacokinetics of trastuzumab emtansine, a HER2-targeted antibody–drug conjugate, in patients with HER2-positive metastatic breast cancer. J Clin Pharmacol. 2012;52(5):691–703. doi: 10.1177/0091270011403742. [DOI] [PubMed] [Google Scholar]
- 28.Bruno R, Washington CB, Lu JF, Lieberman G, Banken L, Klein P. Population pharmacokinetics of trastuzumab in patients with HER2+ metastatic breast cancer. Cancer Chemother Pharmacol. 2005;56(4):361–9. doi: 10.1007/s00280-005-1026-z. [DOI] [PubMed] [Google Scholar]
- 29.Lu D, Joshi A, Wang B, Olsen S, Yi J-H, Krop IE, et al. An integrated multiple-analyte pharmacokinetic model to characterize trastuzumab emtansine (T-DM1) clearance pathways and to evaluate reduced pharmacokinetic sampling in patients with HER2-positive metastatic breast cancer. Clin Pharmacokinet. 2013;52(8):657–72. doi: 10.1007/s40262-013-0060-y. [DOI] [PubMed] [Google Scholar]
- 30.Junutula JR, Raab H, Clark S, Bhakta S, Leipold DD, et al. Site-specific conjugation of a cytotoxic drug to an antibody improves the therapeutic index. Nat Biotechnol. 2008;26(8):925–32. doi: 10.1038/nbt.1480. [DOI] [PubMed] [Google Scholar]
- 31.Panowksi S, Bhakta S, Raab H, Polakis P, Junutula JR. Site-specific antibody drug conjugates for cancer therapy. MAbs. 2014;6(1):34–45. doi: 10.4161/mabs.27022. [DOI] [PMC free article] [PubMed] [Google Scholar]
- 32.Valliere-Douglass JF, McFee WA, Salas-Solano O. Native intact mass determination of antibodies conjugated with monomethyl auristatin E and F at interchain cysteine residues. Anal Chem. 2012;84(6):2843–9. doi: 10.1021/ac203346c. [DOI] [PubMed] [Google Scholar]
- 33.Hengel SM, Sanderson RJ, Valliere-Douglass JF, Nicholas N, Leiske C, et al. Measurement of in vivo drug load distribution of cysteine-linked antibody–drug conjugates using microscale liquid chromatography mass spectrometry. Anal Chem. 2014 doi: 10.1021/ac403860c. [DOI] [PubMed] [Google Scholar]
- 34.Sievers EL, Senter PD. Antibody–drug conjugates in cancer therapy. Annu Rev Med. 2013;64:15–29. doi: 10.1146/annurev-med-050311-201823. [DOI] [PubMed] [Google Scholar]