
Fig. 2.
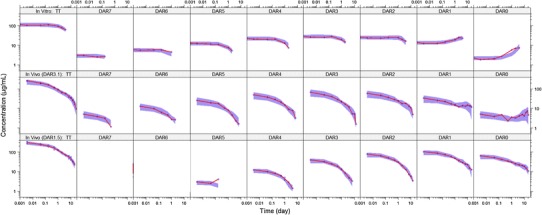
VPCs of TT and DAR0–DAR7 concentrations for the mechanistic deconjugation model fit to data from: top, In vitro rat plasma stability study with 100 μg/mL T-DM1DAR 3.1; middle, rat PK study with 10 mg/kg T-DM1DAR 3.1; bottom, rat PK study with10 mg/kg T-DM1DAR 1.5. For all plots, the shaded area is the 50th percentile with 95% CI, and the solid red line is the median of the observed data (blue circles). Both axes are shown on log scale for visualization purposes. DAR n n DM1 molecules bound to trastuzumab (drug-to-antibody ratio), VPC visual predictive check, TT total trastuzumab, PK pharmacokinetic, T-DM1 trastuzumab emtansine