Abstract
Bitopertin (RG1678) is a glycine reuptake inhibitor in phase 3 trials for treatment of schizophrenia. Its clinical oral pharmacokinetics is sensitive to changes in drug substance particle size and dosage form. Physiologically based pharmacokinetic (PBPK) absorption model simulations of the impact of changes in particle size and dosage form (either capsules, tablets, or an aqueous suspension) on oral pharmacokinetics was verified by comparison to measured plasma concentrations. Then, a model parameter sensitivity analysis was applied to set limits on the particle sizes included in tablets for the market. The model was also used to explore the in vitro to in vivo correlation. Simulated changes in oral pharmacokinetics caused by differences in particle size and dosage form were confirmed in two separate relative bioavailability studies. Model parameter sensitivity analyses predicted that AUCinf was hardly reduced as long as particle diameter (D50) remained smaller than 30 μm, and >20% reduced Cmax is anticipated only when particle diameter exceeds 15 μm. An exploration of the sensitivity to the presence of larger particles within a polydisperse distribution showed that simulated Cmax is again more affected than AUC but is less than 20% reduced as long as D50 is less than 8 μm and D90 is smaller than 56 μm. PBPK absorption modelling can contribute to a quality by design (QbD) approach for clinical formulation development and support the setting of biorelevant specifications for release of the product.
Electronic supplementary material
The online version of this article (doi:10.1208/s12248-014-9639-y) contains supplementary material, which is available to authorized users.
KEY WORDS: absorption model, bitopertin, formulation, glycine reuptake inhibitor, glycine transporter 1, physiologically based pharmacokinetics, quality by design, RG1678
INTRODUCTION
Schizophrenia is a serious public health problem; it afflicts approximately 1% of the world’s population and is the third leading cause of disability (6). This disorder is broadly characterized by three domains of psychopathology, including negative symptoms (social withdrawal, lack of motivation, and emotional reactivity), positive symptoms (hallucinations and delusions), and cognitive deficits (working memory and attention and executive function). Current therapies address mainly the positive symptoms while the negative symptoms remain poorly treated. Dysfunctional N-methyl-d-aspartate (NMDA) receptor neurotransmission has been implicated in the pathophysiology of schizophrenia (8), and one way to enhance receptor function is to increase synaptic levels of glycine through inhibition of glycine transporter type 1 (GlyT1) (7). Bitopertin (RG1678) is a potent and non-competitive glycine reuptake inhibitor discovered (20) and characterized pre-clinically (2) at Roche. The drug is currently in phase 3 trials and is being developed by Roche.
Physiologically based pharmacokinetic models (PBPK) are increasingly replacing more empirical approaches in pharmaceutical discovery and development because of their strength in data integration and delivery of mechanistic insights and superior predictive power (21). Physiologically based absorption models are especially useful when biopharmaceutical challenges are faced throughout the drug development lifecycle (18). A particular strength of such mechanistic absorption models is the ability to translate drug product measurements and in vitro biopharmaceutical data into expected in vivo performance. Thus, these models can play a role in ensuring pre-defined quality by design (QbD) in the development of pharmaceutical products (9,24) since by understanding formulation and manufacturing variables and their translation into in vivo, pharmaceutical product quality can be assured (23).
This article describes how a mechanistic model of bitopertin dissolution and absorption was built to integrate measured data on drug substance particle size and dosage form and was verified by comparison of simulated pharmacokinetics to data generated in clinical studies. The model was then applied to perform parameter sensitivity analyses which lead to a specification of the limits of particle sizes in the tablets to be marketed. The model predicts that, if drug substance remains within specification, less than 20% variation in pharmacokinetic parameters (Cmax and AUC) is expected. The model was also useful to verify the biorelevance of an in vitro dissolution test.
METHODS
Basic PBPK Model
The construction of a PBPK model for bitopertin and prediction of clinical pharmacokinetics and starting dose has been described previously (17). Measured clinical plasma concentrations after single ascending doses were in good agreement with model simulations and indicated that the slightly less than dose-proportional increase in both AUC and Cmax was due to limited solubility. The current report takes this PBPK absorption model further and focuses on the translation of dosage form and drug substance properties to in vivo pharmacokinetics.
Modelling Strategy
The following general strategy was followed
Verification of mechanistic PBPK absorption model simulations by comparison to clinical data from phase 1 clinical studies.
Model parameter sensitivity analyses to determine formulation factors highly influential on simulated oral exposures.
Prediction and construction of prototype formulations designed to show in vivo differences, e.g. if particle size is identified as a sensitive factor dosage forms containing particles where significantly reduced exposure is expected, are produced.
- Verification of the predicted influence of formulation factors
- Preliminary pre-clinical in vivo testing of prototype formulations (NB: only rely on this step if the pre-clinical species is believed appropriate based on verified PBPK modelling with existing pre-clinical data).
- If results in (a) are as expected, then proceed with clinical testing; otherwise, revisit assumptions and possibly reperform step 3.
- Verification of the predicted impact on human exposures with clinical data and possible model refinement.
Model parameter sensitivity analysis leading to recommendation of technical specification limits expected to result in limited change in clinical PK parameters.
If appropriate, further use of the model to derive in vivo dissolution and verify that in vitro dissolution measurements are suitable to control drug product quality.
Clinical Pharmacokinetic Studies
Data from three clinical studies are used in this report.
SAD was a single oral ascending dose study of safety, tolerability, pharmacokinetics, and pharmacodynamics in healthy male volunteers as reported in (17).
REL_BA1 was a study to investigate the relative bioavailability of 30 mg tablets containing either finely or coarsely milled material. This study was performed as a randomized, open-label, five period crossover design in healthy subjects. Twenty-two subjects (10 males and 12 females) were dosed with a single dose of both tablets after an overnight fast. The mean (range) for age was 38 (21–63) years, for body weight was 71 (55–92) kg, and for BMI was 24.0 (18.1–29.8) kg/m2.
REL_BA2 was a study to investigate the relative bioavailability of tablets, capsules, and suspension formulation. It was performed as a randomized, open-label, crossover design in healthy subjects. A single dose of each of the three different formulations was given under fasted conditions. Sixteen subjects (seven males and nine females) were enrolled and 15 completed the study. The mean age (range) was 46 (25–64) years, mean body weight was 68.9 (49.0–91.0) kg, and mean BMI was 23.7 (19.4–29.4) kg/m2.
Pre-clinical Pharmacokinetic Data
Prior to clinical study REL_BA1, a preparatory pharmacokinetic study was performed in cynomolgus monkeys. Potential clinical tablet formulations were administered orally at 30 mg per animal in a crossover design to four monkeys. For construction of the monkey absorption model, data from a previously described pharmacokinetic study with intravenous dosing to two monkeys was used (17).
Physicochemical and In Vitro Input Data
A brief overview of the key absorption-related data in the basic model is provided in Table I. The full set of input data and parameter settings for the GastroPlus bitopertin models in monkey and human are provided in the Supplementary Material.
Table I.
Summary of Drug Specific Physicochemical Input Data and Particle Size Distribution Parameters for Drug Material in Formulations
| Molecular weight | 543.5 | ||
| Ionization constant | Neutral (base pKa <2) | ||
| logD at pH 7.4 | 3.03 | ||
| Human permeability (10–4 cm/s) | 3.5 (high) | ||
| Solubility (mg/mL) in fasted state simulating intestinal fluid: pH = 6.5a | 0.025 | ||
| Particle size distribution parameters for used formulations | D10b [μm] | D50c [μm] | D90d [μm] |
| Finely milled material for formulation in study SAD | 0.9 | 2.3 | 5.1 |
| Finely milled material for formulation in study REL_BA1 and REL_BA2 | 1.1 | 3.7 | 12.2 |
| Coarsely milled material for formulation in study REL_BA1 | 3.7 | 27 | 109 |
Scaled from Caco2 cells using method described in (18)
SAD single-ascending dose
aComposition of media is described in (5). Clinical dosage forms (standard capsules) were equilibrated for 24 h at 37°C, and the supernatant was analyzed by HPLC after centrifugation and filtration through a PVDF filter (0.45 μM)
b10%,of the volume of drug material was measured as below the given diameter
c50% of the volume of drug material was measured as below the given diameter
d90% of the volume of drug material was measured as below the given diameter
Drug Particle Size Data
A summary of particle diameters below which 10% (D10), 50% (D50), and 90% (D90) of the volume distribution of drug material used in clinical studies were measured is given in Table I. The full measured particle size distributions evaluated by laser diffraction (14,22) are provided in the Supplementary Material. For simulations of clinical study REL_BA2, the particle size distribution of drug material in both suspension and tablet formulations was the same as the finely milled material used in REL_BA1.
In Vitro Dissolution Data
Dissolution of film-coated tablets containing finely milled or coarsely milled drug substance was measured in medium containing 0.1 N HCl and 0.2% SDS (v/w) using an USP 2 apparatus at 50 rpm. The samples were measured by a validated HPLC method. Surfactant was added to the medium to reach sink conditions, and a high discriminating power was observed for each variant (Fig. 1; Supplementary Material).
Fig. 1.
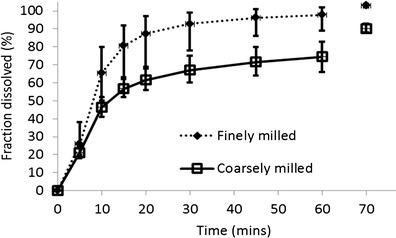
In vitro dissolution of film-coated tablets containing finely and coarsely milled drug substance. To obtain the measurement shown at the 70-min time point, the paddle speed was increased to the maximum value at 60 min and maintained for 10 min, after which time, an additional sample was taken
PBPK Modelling Software
PBPK modelling was performed using the advanced compartmental absorption and transit model (ACAT) in GastroPlus version 8.5. GastroPlus includes a dynamic physiologically based absorption model based on a representation of the gastrointestinal tract which tracks drug transit, dissolution, and permeation across the gastrointestinal membranes (1,19). Different options for modelling the dissolution of solid drug exist, but in the work described here, dissolution rate was calculated using a form of the Noyes-Whitney equation (16) modified to account for the dissolution of spherical particles (13)
Deff is the effective diffusion coefficient, ρ is the density of the drug particle, rt is the radius of spherical particles, h is the diffusion layer thickness, Cs is the solubility, and Cl is the drug concentration in the intestinal lumen.
The drug particle size used as input to this dissolution model was specified as either
A single mean value describing a monodisperse distribution,
A mean and standard deviation describing a lognormal distribution, or
A table of measured particle diameter and percent of total drug below that diameter.
In all simulations, 16 particle size bins were used which is the maximum number allowed by GastroPlus. The simulations for the study REL_BA2 used the default GastroPlus settings for suspension, tablet, and solution formulations where the stomach transit time for suspension and solutions formulations is reduced to 0.1 versus 0.25 h for tablets.
Pharmacokinetic Data Analysis
Bitopertin plasma concentrations from both clinical and pre-clinical studies were measured by validated high-performance liquid chromatography (HPLC) with tandem mass spectrometric detection. The lower limit of quantification was 0.25 ng/mL in human plasma and 1 ng/mL in animal plasma. For estimation of pharmacokinetic parameters, WinNonlin® 3.1 (animal study) or 5.3 (human studies) (Pharsight Co., Mountain View, CA, USA) was used. Maximal concentration (Cmax) and time of maximal concentration (Tmax) were determined directly from the plasma concentration–time profiles while area under the curve (AUC) was calculated non-compartmentally using the linear trapezoidal method. For AUC extrapolated to infinity (AUCinf), the apparent terminal elimination rate (λz) was obtained by log-linear regression of the terminal phase of the plasma concentration–time curve with extrapolation from the observed concentration at the last time point.
RESULTS
Simulation of Pharmacokinetics in Human After Single Ascending Doses
The model simulations agreed well with the measured pharmacokinetics after single administrations as capsules containing micronized drug with particle size (D50) of 2.3 μm (Table I) at doses ranging from 3 to 240 mg (see Supplementary Material). A model parameter sensitivity analysis performed at doses considered likely to be efficacious (10 and 20 mg) showed that simulated exposures were not affected by changes in precipitation time and were little affected by changes in permeability. However, reduction in solubility and increases in particle diameter (assuming a monodisperse distribution) above 12 μm both reduced the simulated maximal plasma concentrations (Fig. 2).
Fig. 2.
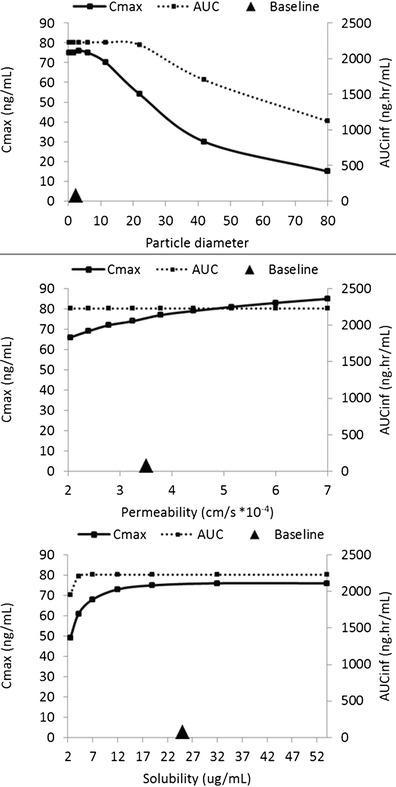
Model parameter sensitivity analysis for a single dose of 10 mg. Large triangle symbol marks the baseline value of the particle diameter, permeability, and solubility used in the PBPK model. The range of values explored for solubility and permeability reflects the uncertainty in these parameters while for particle size the range reflects sizes technically achievable with different milling technologies
Pre-clinical Verification of Simulated Particle Size Effect
To build confidence in the predicted impact of particle size on oral exposures prior to clinical studies, two batches of tablets were prepared containing either finely or coarsely milled drug material and were dosed in a crossover design pharmacokinetic study to four male monkeys. Prospective simulations of this monkey study were run using the measured data on particle sizes (Table I) as model inputs, and the model predicted a reduced Cmax and AUC for the tablets containing coarsely milled drug which was confirmed by the monkey study. Full details for the monkey model and comparison of simulated and observed pharmacokinetics in monkey are provided in the Supplementary Material. This pre-clinical study, therefore, supported the predictions of the model, so a clinical relative bioavailability study was undertaken with the same tablets.
Clinical Verification of Simulated Particle Size Effect
A crossover design pharmacokinetic study in 22 healthy subjects was performed to investigate the relative bioavailability of 30-mg tablets containing finely or coarsely milled drug substance. Measured particle size distribution data (Supplementary Material) were used as input to the dissolution model. Otherwise, model settings were identical to those used to simulate the single ascending dose study. Full details are provided in the Supplementary Material. A comparison of simulated and observed profiles and pharmacokinetic parameters is shown in Fig. 3, and additional details including the individual clinical profiles are provided in the Supplementary Material.
Fig. 3.
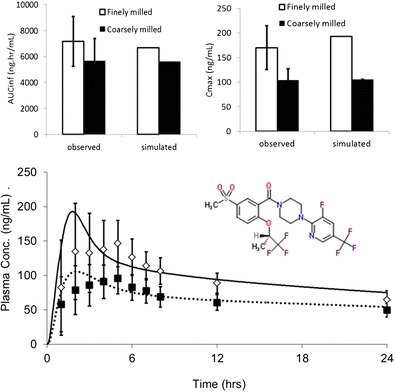
Simulated and observed clinical pharmacokinetic parameters and profiles for finely and coarsely milled tablets after a single dose of 30 mg bitopertin (structure shown)
The model captures well the reduced exposure for coarsely milled particles and the simulated mean profile falls within the range of observed profiles. Relative bioavailability of “coarse” to “fine” tablets was 78% for AUCinf and 62% for Cmax (90% confidence intervals 74–84 and 57–67%, respectively). The simulated relative bioavailabilities were 52 and 72% for Cmax and AUC respectively, which slightly overestimates the change in Cmax due to an overestimated Cmax for the finely milled tablets. The simulation predicted a reduction in the fraction of dose absorbed from 99.7% for the finely milled tablet to 72% for the coarsely milled tablet.
Clinical Verification of Simulated Dosage Form Effect
At the request of the health authorities, a crossover design pharmacokinetic study in 16 healthy subjects was performed to investigate the relative bioavailability of tablets compared to a suspension. Prior model simulations had predicted very similar profiles irrespective of whether the dose was administered as a tablet, an oral suspension, or an oral solution. Prediction was that Cmax would be slightly higher and Tmax slightly earlier for the solution due to more rapid gastric emptying (0.1 vs 0.25 h). Simulated and mean observed pharmacokinetic parameters are provided in the Supplementary Material, and concentration versus time profiles are shown in Fig. 4. The 90% CIs of the observed Cmax and AUCinf mean ratios for the tablet versus the oral suspension were both within the standard bioequivalence range of 80 to 125%. The very similar observed pharmacokinetics for the tablet and suspension formulations was as predicted by the PBPK model.
Fig. 4.
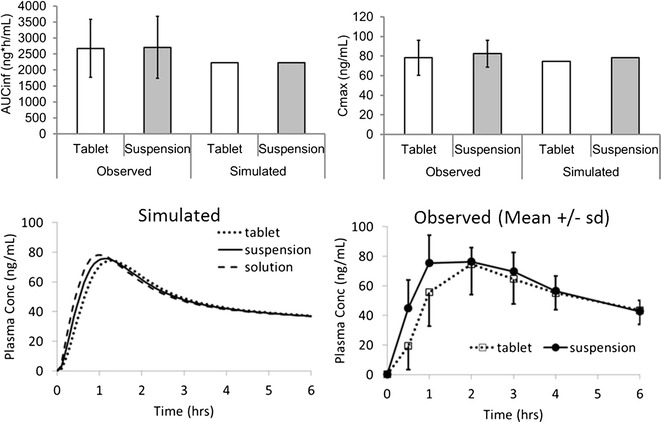
Simulated and observed pharmacokinetic parameters and profiles for tablet and suspension formulations dosed at 10 mg
Use of the Verified Model to Set Limits on Particle Size
Having verified that the absorption model was capturing the differences observed clinically with different dosage forms and particle sizes, the model was applied to predict an upper limit on mean particle size below which pharmacokinetics would be expected to be equivalent. These simulations used a monodisperse distribution. Figure 5 shows simulated Cmax, and AUC as particle diameter is increased continuously from small values up to 30 μm. Figure 5 shows that AUCinf is hardly reduced if particles remain smaller than 30 μm. Cmax is more affected, but a 20% reduced Cmax is only seen when particle diameter is greater than 15 μm. The parameters observed in study REL_BA1 are also shown in Fig. 5, although it should be noted that the simulations assume a monodisperse distribution of drug substance particles whereas the tablets contained polydisperse distributions, and so differences due to the increased variance of particle sizes in the coarsely milled material are not captured by the simulations.
Fig. 5.
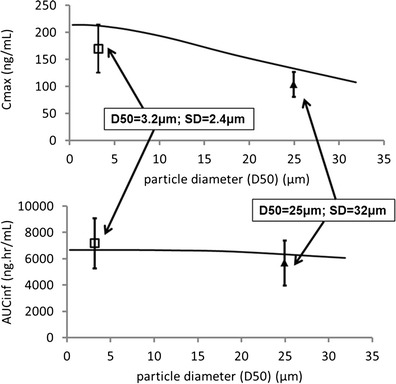
Simulated sensitivity of pharmacokinetic parameters to changing particle size after a single dose of 30 mg. Black line shows simulated exposures over a range of particle diameters assuming a monodisperse particle size distribution. Symbols show observed mean (±SD) exposures in study REL_BA1 for tablets containing coarsely and finely milled material with different polydisperse particle size distributions
To explore the sensitivity of simulated parameters to the variance of a polydisperse distribution, a series of theoretical distributions were generated with D50 held constant but D90 varied. Two different values of D50 were explored. Table II shows results for D50 maintained at values of either 3.6 or 8 μm. Results are presented graphically in Fig. 6 where the parameters are expressed relative to maximum values obtained for a simulated solution formulation.
Table II.
Simulated Pharmacokinetic Parameters for a Single Dose of 30 mg Using Particle Size Distributions with Two Different D50 Values. For Each D50, a Range of D90 Values is Explored
| PSD1 | PSD2 | PSD3 | PSD4 | PSD5 | |
|---|---|---|---|---|---|
| D50 of 3.6 μm | |||||
| D10a (μm) | 0.8 | 0.4 | 0.2 | 0.16 | 0.1 |
| D50b (μm) | 3.6 | 3.6 | 3.6 | 3.6 | 3.6 |
| D90c (μm) | 12 | 24.8 | 47.6 | 79.2 | 131.2 |
| Simulated Cmax (ng/mL) | 206 | 194 | 185 | 179.4 | 175 |
| Simulated AUCinf (ng h/mL) | 6,685 | 6,670 | 6,582 | 6,478 | 6,381 |
| D50 of 8 μm | |||||
| D10a (μm) | 2.5 | 1.2 | 0.6 | 0.38 | 0.22 |
| D50b (μm) | 8 | 8 | 8 | 8 | 8 |
| D90c (μm) | 27.6 | 56 | 108.4 | 179.2 | 301.2 |
| Simulated Cmax (ng/mL) | 184 | 171 | 162 | 157 | 153 |
| Simulated AUCinf (ng h/mL) | 6,635 | 6,450 | 6,214 | 6,046 | 5,884 |
a10%,of the volume of drug material was measured as below the given diameter
b50% of the volume of drug material was measured as below the given diameter
c90% of the volume of drug material was measured as below the given diameter
Fig. 6.
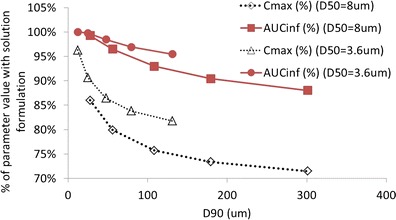
Simulated pharmacokinetic parameters for a single dose of 30 mg using particle size distributions with two different D50 values (3.6 and 8 μm) where for each D50, a range of D90 values is explored
Figure 6 shows that for a D50 of 3.6 μm, simulated Cmax is more affected by changes in D90 than AUC is. However, Cmax is less than 10% reduced as long as D90 remains below 24 μm and less than 20% reduced as long as D90 remains below 131 μm. For a D50 of 8 μm, simulated Cmax is still less than 20% reduced as long as D90 remains below 56 μm. The influence of dose on the simulated sensitivities was also explored, and very similar results were obtained for doses of 10 and 30 mg.
Linking In Vivo Absorption to In Vitro Dissolution
The PBPK absorption model has been verified by comparison of simulations to clinical pharmacokinetics in several studies with different formulations and is sensitive to changes affecting the dissolution rate. Therefore, it is reasonable to assume that simulated in vivo dissolution is realistic. An in vitro dissolution method has been developed to control the quality of bitopertin film-coated tablets. Dissolution data for the finely and coarsely milled 30-mg tablets used in relative bioavailability study REL_BA1 are provided in the Supplementary Material and Fig. 1, and the correlation of simulated in vivo dissolution with in vitro dissolution is shown in Fig. 7.
Fig. 7.
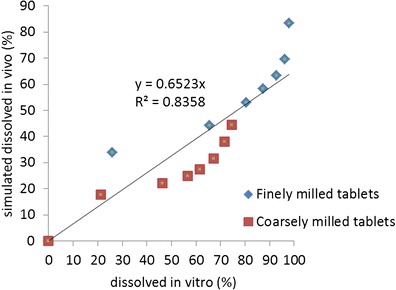
Correlation of in vivo and in vitro dissolution for a 30-mg dose of finely and coarsely milled tablets
The correlation of simulated in vivo dissolution to the in vitro data is reasonable with a correlation coefficient of 0.84 and supports the use of the dissolution test as a predictor for potential changes in in vivo performance.
DISCUSSION AND CONCLUSIONS
In 2002, the US Food and Drug Administration (FDA) introduced an initiative intended to modernize regulation of pharmaceutical quality (4). This initiative was based on quality by design (QbD) principles which have been used to advance product and process quality in other industries (10). Application of the QbD paradigm to biopharmaceutics involves building quality into the final product by understanding and controlling formulation and manufacturing variables and how they translate to in vivo performance of drug products (9). Physiologically based absorption models are increasingly replacing trial and error approaches as a part of a rational strategy for formulation development. This is evidenced by several recent publications from scientists working in the industry (12,11,18,15,3).
In this study, we have shown how the oral absorption of bitopertin, a poorly soluble BCSII molecule targeting the central nervous system, was modelled using GastroPlus, a commercially available PBPK absorption model. The absorption of bitopertin was first modelled in animal species where simulations of oral pharmacokinetics showed that sensitivity to formulation was probable and that low solubility was expected to lead to reduced bioavailability at higher doses (17). These expectations were confirmed in the first clinical study where a less than dose-proportional increase with dose was seen for both AUC and Cmax (Supplementary Material). The model also predicted a sensitivity of oral pharmacokinetics to the drug particle size, and this was in a range where it needed to be considered as a manufacturing variable. The model was therefore used to select particle sizes which would be expected to show significant differences in vivo. Tablets were produced incorporating drug powder with the targeted median particle sizes produced by different milling techniques which generated polydisperse distributions with different variances. Thus, finely milled material showed a mean particle size (D50) of 3.7 μm with few large particles (D90 = 12.2 μm) while coarser material with a larger mean (D50 = 27 μm) also included large particles (D90 = 109 μm). To increase confidence in the in vivo performance of these tablets prior to clinical study, a small study in monkeys was performed. This pre-clinical work confirmed that the simulated differences in monkey pharmacokinetics were realistic, and so a clinical relative bioavailability study proceeded. Clinical results further confirmed the predictions of the model regarding the influence of particle size and supported use of the model for interpolation and estimation of an appropriate particle size specification. While simulations assuming a monodisperse distribution broadly captured the impact of different D50 seen clinically (Fig. 5), the assumption of monodispersity was not realistic when compared to particles produced by milling. Thus, the impact of the presence of larger particles in the distribution was also explored with simulations. These indicated that Cmax might be reduced by up to 15% for a particle size distribution having the same D50 but with a much larger D90 (Fig. 6). Thus, it is important to pay attention also to the D90 parameter when assessing the possible impact of different milling techniques.
The model also predicted limited impact on clinical pharmacokinetics due to changes to the dosage form which was confirmed by a relative bioavailability study with an oral suspension. A further utility of the model-based approach was the possibility to verify the relevance of the in vitro dissolution tests for in vivo drug performance. While the dissolution test employed SDS in order to achieve sink conditions in vitro which was otherwise not possible due to the low solubility of bitopertin, a reasonable IVIVR was nonetheless achieved. This may be due to the good permeability of bitopertin which allows maintenance of a reasonable sink in vivo in spite of the limited solubility.
Overall, this study illustrates an efficient and effective strategy for development of a bitopertin market formulation and for the setting of biorelevant specifications for drug product testing.
Electronic Supplementary Material
(DOC 595 kb)
Acknowledgments
All authors were employees of F. Hoffmann-LaRoche when this work was carried out.
References
- 1.Agoram B, Woltosz WS, et al. Predicting the impact of physiological and biochemical processes on oral drug bioavailability. Adv Drug Deliv Rev. 2001;50(Supplement 1):S41–67. doi: 10.1016/S0169-409X(01)00179-X. [DOI] [PubMed] [Google Scholar]
- 2.Alberati D, Moreau J-L, et al. Glycine reuptake inhibitor RG1678: a pharmacologic characterization of an investigational agent for the treatment of schizophrenia. Neuropharmacology. 2012;62(2):1152–61. doi: 10.1016/j.neuropharm.2011.11.008. [DOI] [PubMed] [Google Scholar]
- 3.Cheeti S, Budha NR, et al. A physiologically based pharmacokinetic (PBPK) approach to evaluate pharmacokinetics in patients with cancer. Biopharm Drug Dispos. 2013;34:141–54. doi: 10.1002/bdd.1830. [DOI] [PubMed] [Google Scholar]
- 4.Department of Heath and Human Services, U. S. F. a. D. A. 2007 Pharmaceutical Quality for the 21st Century A Risk-Based Approach Progress Report. http://www.fda.gov/aboutfda/centersoffices/officeofmedicalproductsandtobacco/cder/ucm128080.htm. Accessed 12 Jan 2014
- 5.Galia E, Nicolaides E, et al. Evaluation of various dissolution media for predicting in vivo performance of class I and class II drugs. Pharm Res. 1998;15:698–705. doi: 10.1023/A:1011910801212. [DOI] [PubMed] [Google Scholar]
- 6.Hyman SE. A glimmer of light for neuropsychiatric disorders. Nature. 2008;455(7215):890–3. doi: 10.1038/nature07454. [DOI] [PubMed] [Google Scholar]
- 7.Javitt DC. Glycine transport inhibitors for the treatment of schizophrenia: symptom and disease modification. Current Opin Drug Discov Dev. 2009;12(4):468. [PubMed] [Google Scholar]
- 8.Javitt DC. Glutamate and Schizophrenia: phencyclidine, N-Methyl-d-Aspartate receptors, and dopamine–glutamate interactions. Int Rev Neurobiol. 2007;78:69–108. doi: 10.1016/S0074-7742(06)78003-5. [DOI] [PubMed] [Google Scholar]
- 9.Jiang W, Kim S, et al. The role of predictive biopharmaceutical modeling and simulation in drug development and regulatory evaluation. Int J Pharm. 2011;418(2):151–60. doi: 10.1016/j.ijpharm.2011.07.024. [DOI] [PubMed] [Google Scholar]
- 10.Juran JM. Juran on quality by design: the new steps for planning quality into goods and services: planning, setting and reaching quality goals the free press. A division of Simon and Schuster Inc; 1992.
- 11.Kuentz M. Drug absorption modeling as a tool to define the strategy in clinical formulation development. AAPS J. 2008;10(3). [DOI] [PMC free article] [PubMed]
- 12.Kuentz M, Nick S, et al. A strategy for preclinical formulation development using GastroPlusTM as pharmacokinetic simulation tool and a statistical screening design applied to a dog study. Eur J Pharm Sci. 2006;27:91–9. doi: 10.1016/j.ejps.2005.08.011. [DOI] [PubMed] [Google Scholar]
- 13.Lu ATK, Frisella ME, et al. Dissolution modeling: factors affecting the dissolution rates of polydisperse powders. Pharm Res. 1993;10(9). [DOI] [PubMed]
- 14.Malvern. Mastersizer 2000. http://www.malvern.com/en/products/product-range/mastersizer-range/mastersizer-2000/default.aspx. Accessed 27 Feb 2014
- 15.Mathias NR, Crison J. The use of modeling tools to drive efficient oral product design. Aaps Journal. 2012;14(3):591–600. doi: 10.1208/s12248-012-9372-3. [DOI] [PMC free article] [PubMed] [Google Scholar]
- 16.Noyes AS, Whitney WR. The rate of solution of solid substances in their own solutions. J Am Chem Soc. 1897;19:930–4. doi: 10.1021/ja02086a003. [DOI] [Google Scholar]
- 17.Parrott N, Hainzl D, et al. Physiologically based pharmacokinetic modelling to predict single and multiple dose human pharmacokinetics of bitopertin. Clin Pharmacokinet. 2013;52(8):673–83. doi: 10.1007/s40262-013-0061-x. [DOI] [PubMed] [Google Scholar]
- 18.Parrott N, Lave T. Applications of physiologically based absorption models in drug discovery and development. Mol Pharm. 2008;5(5):760–75. doi: 10.1021/mp8000155. [DOI] [PubMed] [Google Scholar]
- 19.Parrott N, Lave T. Computer models for predicting drug absorption. Oral Drug Absorption. J Dressman and C. Reppas, Informa. 2010.
- 20.Pinard E, Alanine A, et al. Selective GlyT1 inhibitors: discovery of [4-(3-fluoro-5-trifluoromethylpyridin-2-yl)piperazin-1-yl][5-methanesulfonyl-2-((S)-2,2,2-trifluoro-1-methylethoxy)phenyl]methanone (RG1678), a promising novel medicine to treat schizophrenia. J Med Chem. 2010;53(12):4603–14. doi: 10.1021/jm100210p. [DOI] [PubMed] [Google Scholar]
- 21.Rowland M, Peck C, et al. Physiologically-based pharmacokinetics in drug development and regulatory science. Annu Rev Pharmacol Toxicol. 2011;51(1):45–73. doi: 10.1146/annurev-pharmtox-010510-100540. [DOI] [PubMed] [Google Scholar]
- 22.Sympatec GmbH. “Sympatec HELOS” http://www.sympatec.com/EN/LaserDiffraction/HELOS.html. Accessed 1 Feb 2014
- 23.Yu LX. Pharmaceutical quality by design: product and process development, understanding, and control. Pharm Res. 2008;25(4):781–91. doi: 10.1007/s11095-007-9511-1. [DOI] [PubMed] [Google Scholar]
- 24.Zhang X, Lionberger RA, et al. Utility of physiologically based absorption modeling in implementing quality by design in drug development. AAPS J. 2011;13(1). [DOI] [PMC free article] [PubMed]
Associated Data
This section collects any data citations, data availability statements, or supplementary materials included in this article.
Supplementary Materials
(DOC 595 kb)


