

Abstract
The aim of this study was to investigate the effects of cold stress on oxidative indexes, immune function, and the expression levels of heat shock protein (Hsp90, Hsp70, Hsp60, Hsp40, and Hsp27) in immune organs of chickens. Two hundred forty 15-day-old male chickens were randomly divided into 12 groups and kept under the temperature of (12 ± 1) °C for acute and chronic cold stress. There were one control group and five treatment groups for acute cold stress and three control groups and three treatment groups for chronic cold stress. The results showed that cold stress influence the activities of antioxidant enzymes in the immune organs. The activities of SOD and GSH-Px were first increased then decreased, and activity of total antioxidation capacity (T-AOC) was significantly decreased (P < 0.05) at the acute cold stress in chicks; however, T-AOC activities were significantly increased (P < 0.05) at the chronic cold stress in these tissues. Cold stress induced higher level of malondialdehyde (MDA) in chicken immune organs. In addition, the cytokine contents were increased in cold stress groups. As one protective factor, the expression levels of Hsps were increased significantly (P < 0.05) in both cold stress groups. These results suggested that cold stress induced the oxidative stress in the three tissues and influenced immune function of chicks. Higher expression of Hsps (Hsp90, Hsp70, Hsp60, Hsp40, and Hsp27) may play a role in protecting immune organs against cold stress.
Keywords: Cold stress, Heat shock proteins, Oxidative stress, Chickens, Immune organs, Cytokines
Introduction
It is widely accepted that cold exposure can influence the function of neuroendocrine system, antioxidation system, and immune system (Hangalapura et al. 2006; Helmreich et al. 2005; Onderci et al. 2003; Hangalapura et al. 2004b; Fleshner et al. 1998). Some researchers demonstrated that cold stress could significantly influence the immune system in mice, human (Brenner et al. 1999; Jansky et al. 1996), and chicken (Hangalapura et al. 2004a). It was also reported that cold stress suppressed humoral immunity in rats (Rybakina et al. 1997) and decreased the cell-mediated immunity of chickens (Regnier and Kelley 1981). In addition, prior study also indicated that the effect of cold stress on immune responses may depend on stress time and stress intensity (Hangalapura et al. 2003). So, immune organ is one important target of cold stress.
During the cold stress, cytokines play an important role in bidirectional communication between the neuroendocrine and immune systems (Felten et al. 1998). It has been reported that interleukin (IL)-10 production was increased in chronic cold stress (4 °C/4 h daily for 7 days) in BALB/c mice (Sesti-Costa et al. 2012). In addition, in humans, cold stress was reported to enhance IL-2 cytokine levels (Jansky et al. 1996). In addition, several studies indicated that the antioxidant defense system was influenced by low-temperature exposure (Mujahid 2010; Lin et al. 2004; Bottje et al. 1998). Superoxide dismutase (SOD) and glutathione peroxidase (GSH-Px) activities were decreased, and malondialdehyde (MDA) content was increased in the masseter muscles in psychological stressed rats after 3 and 5 weeks (Li et al. 2011). Moreover, it was reported that low temperature induced the higher MDA levels in chickens’ brain and heart (Mujahid and Furuse 2009). However, the role of cold stress in the immune of chicks is unclear.
When living organisms are exposed to various stress conditions, the synthesis of most proteins is retarded, but a group of highly conserved proteins known as heat shock proteins (Hsps) is rapidly synthesized (Al-Aqil and Zulkifli 2009). Hsps are key components in modulating stress responses. They are highly conserved molecular chaperones, ubiquitously expressed, belonging to distinct multigenic families. It has been suggested that Hsps were associated with the function of immune systems (Tsan and Gao 2009). Hsps provide the link between innate and adaptive immune systems (Guo et al. 2007). The presence of Hsps in the circulation system serves as a danger signal to the host (Wu 1995; Jaattela 1999). In mammals, it indicated that Hsps reserved a protective role in the immune system (Habich and Burkart 2007; Ausiello et al. 2005).
Environmental stressors can alter the susceptibility of animals to temperature, it is important to learn how stressors affect the immune system of animals. Therefore, the present study is undertaken to analyze the effects of cold stress on the antioxidant responses (total antioxidant capacity (T-AOC), SOD, GSH-Px, and MDA), the levels of cytokine content (IL-2, IL-4, IL-10, and interferon gamma (IFN-γ)), and the expression of Hsps (Hsp90, Hsp70, Hsp60, Hsp40, and Hsp27) in the spleen, thymus, and bursa of Fabricius of chicks after cold treatment.
Materials and methods
Chickens and tissue collection
All procedures used in the present experiment were approved by the Institutional Animal Care and Use Committee of Northeast Agricultural University (Harbin, China). The chickens’ model of cold stress was developed as described in our previous studies (Wang and Xu 2008; Wang et al. 2009; Zhang et al. 2011) Briefly, 240 15-day-old male chickens were purchased from Weiwei Co. Ltd. (Harbin, China) and randomly allocated to 12 groups (six groups for the acute cold stress experiment and six groups for the chronic cold stress experiment; n = 20/group). The chickens were maintained in our animal facility, kept under a 16L:8D cycle and a temperature of 30 ± 2 °C, and given free access to standard food and water. During their second week of age, five groups were transferred to a cold environment 12 ± 1 °C and kept for 1, 3, 6, 12, and 24 h, respectively, for acute cold stress, and one group was maintained at 25 °C as control (0-h group). Three groups were transferred to the cold environment (12 ± 1 °C) and kept for 5, 10, and 20 days, respectively, for chronic cold stress, and three groups were maintained at 25 °C for 5, 10, and 20 days as controls. The chickens were euthanized by sodium pentobarbital after stress termination. The spleen, thymus, and bursa of Fabricius tissues from each chicken was collected, immediately frozen on dry ice and then stored at -80 °C for RNA isolation and protein extract. Animal care and treatment complied with the standards described in the guidelines for the care and use of laboratory animals of the Northeast Agriculture University.
Determination of antioxidant enzyme activities
The spleen, thymus, and bursa of Fabricius of chickens were homogenized on ice in physiological saline, centrifuged at 700×g, and supernatants were collected. Here, we detected T-AOC, free radical scavenging enzymes such as SOD, metabolizing enzymes such as GSH-Px, and MDA as an index of oxidative damage. Commercial assay kits for T-AOC, SOD, GSH-Px, and MDA were provided by the Nanjing Jiancheng Biotechnology Research Institute (Nanjing, China). Measurements were performed according the protocol provided by the manufacturer in the laboratory of the Science and Technology Experiment Centre, Shanghai University of Traditional Chinese Medicine.
The T-AOC in digestive organs was determined by Opara et al. (1999). In commercial kits, a color reaction of tetramethylbenzidine (TMB) was used, and T-AOC was related with color change of TMB monitored spectrophotometrically at 450 nm. SOD activity in the homogenate was assayed by the inhibition at 25 °C of pyrogallol autoxidation by SOD (with and without sample) and was followed kinetically at 550 nm (Nanjing Jiancheng Bioengineering Institute, Nanjing, China). One unit of SOD is defined as the amount of enzyme that causes 50 % inhibition of pyrogallol autoxidation. GSH-Px activity was measured by using H2O2 as a substrate by applying the method of Rotruck et al. (1973). MDA level was determined by 2-thiobarbituric acid reactive substance (TBARS) chromometry (Zhang et al. 2011).
Determination of the IL-2, IL-4, IL-10, and IFN-γ contents in the spleen, thymus, and bursa of Fabricius of chickens
The tissues were taken at each time point during the experiment. IL-2, IL-4, IL-10, and IFN-γ contents were assayed in serum by radioimmunometricassay, as described by Zhang et al. (2011).
Primers’ design
To design primers, Primer Premier software (PREMIER Biosoft International, USA) was used to design specific primers for Hsp90, Hsp70, Hsp60, Hsp40, Hsp27, and β-actin based on known chicken sequences (Table 1). General PCRs were first performed to confirm the specificity of the primers.
Table 1.
Gene-special primers for Hsp90, Hsp70, Hsp60, Hsp40, Hsp27, and β-actin used in the qPCR
| Gene | Serial number | Primer sequence(5′ → 3′) | Primer length (bp) | Size of the products (bp) |
|---|---|---|---|---|
| Hsp90 | NM_001109785.1 | Forward: TCCTGTCCTGGCTTTAGTTT | 20 | 143 |
| Reverse: AGGTGGCATCTCCTCGGT | 18 | |||
| Hsp70 | NM_001006685.1 | Forward: CGGGCAAGTTTGACCTAA | 18 | 250 |
| Reverse: TTGGCTCCCACCCTATCTCT | 20 | |||
| Hsp60 | NM_001012916.1 | Forward: AGCCAAAGGGCAGAAATG | 18 | 208 |
| Reverse: TACAGCAACAACCTGAAGACC | 21 | |||
| Hsp40 | NM_001199325.1 | Forward: GGGCATTCAACAGCATAGA | 19 | 151 |
| Reverse: TTCACATCCCCAAGTTTAGG | 20 | |||
| Hsp27 | NM_205290.1 | Forward: ACACGAGGAGAAACAGGATGAG | 22 | 158 |
| Reverse: ACTGGATGGCTGGCTTGG | 18 | |||
| β-actin | L08165 | Forward: CCGCTCTATGAAGGCTACGC | 20 | 128 |
| Reverse: CTCTCGGCTGTGGTGGTGAA | 20 |
Total RNA isolation and reverse transcription reaction
Total RNA was isolated from the tissue samples (50-mg tissue) using TRIzol Reagent according to the manufacturer’s instructions (Invitrogen, China). The dried RNA pellets were resuspended in 50 μl of diethylpyrocarbonate-treated water. The concentration and purity of the total RNA were determined spectrophotometrically at 260/280 nm (Gene Quant 1300/100, USA). First-strand complementary DNA (cDNA) was synthesized from 5 μg of total RNA using oligo(dT)18 primers and SuperScript II reverse transcriptase according to the manufacturer’s instructions (Invitrogen, China). Synthesized cDNA was diluted five times with sterile water and stored at −80 °C before use.
Quantitative real-time PCR (qPCR)
The qPCR was performed on an ABI PRISM 7500 Detection System (Applied Biosystems, USA). Reactions were performed in a 20-μl reaction mixture containing 10 μl of 2× SYBR Green PCR Master Mix (Roche, Switzerland), 2 μl of diluted cDNA, 0.6 μl of each primer (10 μM), and 6.8 μl of PCR-grade water. The PCR procedure for Hsp90, Hsp70, Hsp60, Hsp40, Hsp27, and β-actin consisted of heating the reaction mixture to 52 °C for 2 min and 95 °C for 10 min followed by 40 cycles of 95 °C for 15 s and 60 °C for 1 min, 95 °C for 15 s and 60 °C for 20 s. The melting curve analysis showed only one peak for each PCR product. Electrophoresis was performed with the PCR products to verify primer specificity and product purity. A dissociation curve was run for each plate to confirm the production of a single product. The amplification efficiency for each gene was determined by using the DART-PCR program (Peirson et al. 2003). The messenger RNA (mRNA) relative abundance was calculated according to the method of Pfaffl (2001), accounting for gene-specific efficiencies and was normalized to the mean expression of β-actin.
Western blot analysis
Protein extracts were subjected to SDS-polyacrylamide gel electrophoresis under reducing conditions on 12 % gels. Separated proteins were then transferred to nitrocellulose membranes using a tank transfer for 2 h at 200 mA in Tris-glycine buffer containing 20 % methanol. Membranes were blocked with 5 % skim milk for 16–24 h and incubated overnight with diluted primary chicken antibody Hsp90 (1:500), Hsp70 (1:500), and Hsp60 (1:1,400) (Hsp90, Hsp70, and Hsp60 production of polyclonal antibody by our lab) followed by a horse radish peroxidase (HRP)-conjugated secondary antibody against rabbit IgG (1:1,500, Santa Cruz, USA). To verify equal loading of samples, the membrane was incubated with monoclonal β-actin antibody (1:1,000, Santa Cruz, USA), followed by a HRP-conjugated goat anti-mouse IgG (1:1,000). The signal was detected by X-ray films (TransGen Biotech Co., China). The optical density (OD) of each band was determined by Image VCD gel imaging system, and the Hsp90, Hsp70, and Hsp60 expressions were detected as the ratio of OD of Hsp90, Hsp70, Hsp60, and OD of β-actin, respectively.
Statistical analysis
Statistical analysis of all data was performed by using SPSS for Windows (version 13, SPSS Inc., Chicago, IL). When a significant value (P < 0.05) was obtained by one-way ANOVA, further analysis was carried out. All data showed a normal distribution and passed equal variance testing. Differences between means were assessed using Tukey’s honestly significant difference test for post hoc multiple comparisons. Data are expressed as the mean ± SD.
Results
Changes of the antioxidant enzyme activities
To examine whether cold stress exposure could cause oxidative stress, we detected T-AOC, GSH-Px, SOD activities, and MDA content in the spleen, thymus, and bursa of Fabricius of chickens. Antioxidant enzyme activity and MDA content in the spleen, thymus, and bursa of Fabricius of chickens are showed in Tables 2, 3, 4, and 5. The T-AOC activities of the spleen, thymus, and bursa of Fabricius of chickens were significantly decreased (P < 0.05) at the acute cold stress groups than in control group; however, at the chronic cold stress, T-AOC activities of these tissues were significantly increased (P < 0.05).
Table 2.
Effects of acute and chronic cold stress on the T-AOC activity of chicken spleen, thymus, and bursa of Fabricius
| Groups | Cold stress time | Sample | Spleen (μmol/mg prot) | Thymus (μmol/mg prot) | Bursa of Fabricius (μmol/mg prot) |
|---|---|---|---|---|---|
| Acute cold stress groups | 0 h | 5 | 0.974 ± 0.007a | 0.763 ± 0.037a | 0.665 ± 0.013a |
| 1 h | 5 | 0.662 ± 0.012b | 0.612 ± 0.023b | 0.595 ± 0.017b | |
| 3 h | 5 | 0.661 ± 0.009b | 0.611 ± 0.019b | 0.540 ± 0.012c | |
| 6 h | 5 | 0.659 ± 0.007b | 0.599 ± 0.019c | 0.503 ± 0.009d | |
| 12 h | 5 | 0.623 ± 0.008c | 0.579 ± 0.016d | 0.387 ± 0.007e | |
| 24 days | 5 | 0.580 ± 0.011d | 0.556 ± 0.012e | 0.291 ± 0.010f | |
| Control groups | 5 days | 5 | 0.448 ± 0.009 | 0.553 ± 0.025 | 0.650 ± 0.008 |
| 10 days | 5 | 0.442 ± 0.010 | 0.541 ± 0.011 | 0.654 ± 0.013 | |
| 20 days | 5 | 0.436 ± 0.009 | 0.533 ± 0.008 | 0.667 ± 0.012 | |
| Chronic cold stress groups | 5 days | 5 | 0.364 ± 0.009* | 0.504 ± 0.009* | 0.703 ± 0.016* |
| 10 days | 5 | 0.504 ± 0.014* | 0.468 ± 0.013* | 0.720 ± 0.004* | |
| 20 days | 5 | 0.459 ± 0.008* | 0.436 ± 0.015* | 0.698 ± 0.017* |
The different letters in acute cold stress groups indicated that there were significant differences (P < 0.05) between any two groups, the same letters in acute cold stress group indicated that there were no significant differences between any two groups. * in chronic cold stress groups indicated that there were significant differences (P < 0.05) between the control group and the stress group at the same time point, while without * in chronic cold stress groups indicated that there were no significant differences between the control group and the stress group at the same time point. Each value represented the mean ± SD of 5 individuals
Table 3.
Effects of acute and chronic cold stress on the GSH-Px activity of chicken spleen, thymus, and bursa of Fabricius
| Groups | Cold stress time | Sample | Spleen (μmol/mg prot) | Thymus (μmol/mg prot) | Bursa of Fabricius (μmol/mg prot) |
|---|---|---|---|---|---|
| Acute cold stress groups | 0 h | 5 | 15.450 ± 0.437a | 18.074 ± 0.167a | 21.945 ± 0.228a |
| 1 h | 5 | 18.036 ± 0.277b | 19.236 ± 0.277b | 22.235 ± 0.314a,b | |
| 3 h | 5 | 19.494 ± 0.009c | 19.494 ± 0.129b | 22.640 ± 0.012b | |
| 6 h | 5 | 20.928 ± 0.637d | 22.828 ± 0.537c | 23.548 ± 0.435c | |
| 12 h | 5 | 21.795 ± 0.411e | 24.749 ± 0.521d | 25.794 ± 0.348d | |
| 24 days | 5 | 23.380 ± 0.011f | 26.380 ± 0.451e | 27.741 ± 0.010e | |
| Control groups | 5 days | 5 | 27.171 ± 0.470 | 19.171 ± 0.279c | 4.071 ± 0.427 |
| 10 days | 5 | 27.358 ± 0.511 | 19.358 ± 0.381 | 4.058 ± 0.159 | |
| 20 days | 5 | 27.222 ± 0.334 | 19.262 ± 0.237 | 4.012 ± 0.223 | |
| Chronic cold stress groups | 5 days | 5 | 25.805 ± 0.550* | 24.875 ± 0.450* | 5.550 ± 0.394* |
| 10 days | 5 | 24.223 ± 0.537* | 26.223 ± 0.477* | 5.910 ± 0.252* | |
| 20 days | 5 | 22.070 ± 0.305* | 26.470 ± 0.405* | 8.650 ± 0.283* |
The different letters in acute cold stress groups indicated that there were significant differences (P < 0.05) between any two groups, the same letters in acute cold stress group indicated that there were no significant differences between any two groups. * in chronic cold stress groups indicated that there were significant differences (P < 0.05) between the control group and the stress group at the same time point, while without * in chronic cold stress groups indicated that there were no significant differences between the control group and the stress group at the same time point. Each value represented the mean ± SD of 5 individuals
Table 4.
Effects of acute and chronic cold stress on the SOD activity of chicken spleen, thymus, and bursa of Fabricius
| Groups | Cold stress time | Sample | Spleen (μmol/mg prot) | Thymus (μmol/mg prot) | Bursa of Fabricius (μmol/mg prot) |
|---|---|---|---|---|---|
| Acute cold stress groups | 0 h | 5 | 66.355 ± 0.319a | 73.345 ± 0.419a | 100.713 ± 0.368a |
| 1 h | 5 | 67.996 ± 0.449b | 75.996 ± 0.458b | 101.181 ± 0.520a | |
| 3 h | 5 | 69.494 ± 0.029c | 79.494 ± 0.012c | 101.640 ± 0.012a,b | |
| 6 h | 5 | 72.624 ± 0.448d | 79.624 ± 0.148c | 102.253 ± 0.460b,c | |
| 12 h | 5 | 72.107 ± 0.253d | 82.107 ± 0.155d | 103.484 ± 0.330c | |
| 24 d | 5 | 74.380 ± 0.011e | 82.380 ± 0.021d | 106.741 ± 0.010d | |
| Control groups | 5 days | 5 | 39.171 ± 0.409 | 39.171 ± 0.409 | 62.171 ± 0.402 |
| 10 days | 5 | 39.358 ± 0.373 | 39.358 ± 0.373 | 62.359 ± 0.345 | |
| 20 days | 5 | 39.661 ± 0.255 | 39.661 ± 0.255 | 62.201 ± 0.346 | |
| Chronic cold stress groups | 5 days | 5 | 38.912 ± 0.889* | 38.912 ± 0.889* | 66.427 ± 0.445* |
| 10 days | 5 | 41.398 ± 0.387* | 41.398 ± 0.387* | 87.253 ± 0.474* | |
| 20 days | 5 | 37.607 ± 0.491* | 37.607 ± 0.491* | 74.901 ± 0.554* |
The different letters in acute cold stress groups indicated that there were significant differences (P < 0.05) between any two groups, the same letters in acute cold stress group indicated that there were no significant differences between any two groups. * in chronic cold stress groups indicated that there were significant differences (P < 0.05) between the control group and the stress group at the same time point, while without * in chronic cold stress groups indicated that there were no significant differences between the control group and the stress group at the same time point. Each value represented the mean ± SD of 5 individuals
Table 5.
Effects of acute and chronic cold stress on the MDA content of chicken spleen, thymus, and bursa of Fabricius
| Groups | Cold stress time | Sample | Spleen (μmol/mg prot) | Thymus (μmol/mg prot) | Bursa of Fabricius (μmol/mg prot) |
|---|---|---|---|---|---|
| Acute cold stress groups | 0 h | 5 | 0.292 ± 0.011f | 0.359 ± 0.011a | 0.422 ± 0.007a |
| 1 h | 5 | 0.341 ± 0.008e | 0.436 ± 0.008b | 0.586 ± 0.006b | |
| 3 h | 5 | 0.494 ± 0.009b | 0.495 ± 0.009c | 0.640 ± 0.012c | |
| 6 h | 5 | 0.546 ± 0.011c | 0.536 ± 0.012d | 0.788 ± 0.008d | |
| 12 h | 5 | 0.639 ± 0.006b | 0.599 ± 0.006e | 0.874 ± 0.005e | |
| 24 days | 5 | 0.380 ± 0.011e | 0.680 ± 0.011f | 0.741 ± 0.010c | |
| Control groups | 5 days | 5 | 0.517 ± 0.008 | 0.517 ± 0.008 | 0.211 ± 0.007 |
| 10 days | 5 | 0.504 ± 0.007 | 0.504 ± 0.007 | 0.203 ± 0.009 | |
| 20 days | 5 | 0.515 ± 0.007 | 0.515 ± 0.007 | 0.205 ± 0.008 | |
| Chronic cold stress groups | 5 days | 5 | 0.348 ± 0.008* | 0.348 ± 0.008* | 0.186 ± 0.009* |
| 10 days | 5 | 0.417 ± 0.005* | 0.417 ± 0.005* | 0.243 ± 0.007* | |
| 20 days | 5 | 0.376 ± 0.021* | 0.376 ± 0.021* | 0.178 ± 0.008* |
The different letters in acute cold stress groups indicated that there were significant differences (P < 0.05) between any two groups, the same letters in acute cold stress group indicated that there were no significant differences between any two groups. * in chronic cold stress groups indicated that there were significant differences (P < 0.05) between the control group and the stress group at the same time point, while without * in chronic cold stress groups indicated that there were no significant differences between the control group and the stress group at the same time point. Each value represented the mean ± SD of 5 individuals
SOD activities of the spleen, thymus, and bursa of Fabricius tissues were significantly increased (P < 0.05) at the acute cold stress groups than at the control group. At the chronic cold stress groups, SOD activities of bursa of Fabricius were significantly increased (P < 0.05) (Table 3).
GSH-Px activity in the acute stress group was increased (P < 0.05) compared with that in the control group. In the chronic cold stress group, GSH-Px activity was increased in the bursa of Fabricius tissue compared with that of each corresponding control group. However, GSH-Px activity was significantly (P < 0.05) decreased in the spleen tissue (Table 4).
The MDA content in the examined tissues of the chickens’ acute stress group was significantly higher than that of the control group (P < 0.05). At the chronic cold stress, the MDA content in the spleen were significantly (P < 0.05) decreased than the corresponding control group (Table 5).
Effects of cold stress on the IL-2, IL-4, IL-10, and IFN-γ contents in the serum, spleen, thymus, and bursa of Fabricius of chickens
The effects of cold stress IL-2, IL-4, IL-10, and IFN-γ content in the serum, spleen, thymus, and bursa of Fabricius of chickens are shown in Tables 6, 7, 8, and 9. In the acute cold stress, IL-2 content first increased then decreased in the spleen and bursa of Fabricius of chickens, but in the thymus, IL-2 content first decreased then increased. In the chronic cold stress, IL-2 content increased in the spleen, but in the thymus, IL-2 content decreased. IL-2 content increased in the serum at the acute and chronic cold stress (Table 6). In the acute cold stress, IL-4 content was increased in the serum, spleen, and bursa of Fabricius of chickens, but in the thymus, IL-4 content was decreased. In the chronic cold stress, IL-4 content decreased in the spleen and thymus, but in the serum and bursa of Fabricius, IL-4 content increased (Table 7). In the acute cold stress, IL-10 content did not change in the thymus and bursa of Fabricius, but in the spleen, IL-10 content decreased. In the chronic cold stress, IL-10 content increased in the spleen. IL-10 content increased in the serum at the acute and chronic cold stress (Table 8). In the acute cold stress, IFN-γ content increased in the immune organs; in the chronic cold stress, that in the thymus decreased but the one in the bursa of Fabricius increased. IFN-γ content increased in the serum at acute cold stress, but in the chronic cold stress, IFN-γ content decreased (Table 9).
Table 6.
Effect of acute and chronic cold stress on IL-2 content in the spleen, thymus, and bursa of Fabricius of chickens
| Groups | Cold stress time | Sample | Serum (pg/ml) | Spleen (pg/ml) | Thymus (pg/ml) | Bursa of Fabricius (pg/ml) |
|---|---|---|---|---|---|---|
| Acute cold stress groups | 0 h | 5 | 5.528 ± 0.157d | 9.198 ± 0.248d | 15.21 ± 0.400a | 2.697 ± 0.173c |
| 1 h | 5 | 3.201 ± 0.189e | 9.385 ± 0.264c,d | 13.40 ± 0.280b | 3.663 ± 0.287b | |
| 3 h | 5 | 7.273 ± 0.258b | 9.923 ± 0.272b | 12.35 ± 0.343c | 3.503 ± 0.240b | |
| 6 h | 5 | 6.360 ± 0.215c | 10.51 ± 0.354a | 12.21 ± 0.299c | 4.562 ± 0.226a | |
| 12 h | 5 | 6.844 ± 0.305b,c | 9.695 ± 0.283b,c | 15.65 ± 0.315a | 3.005 ± 0.183c | |
| 24 h | 5 | 11.22 ± 0.640a | 9.852 ± 0.247b | 13.15 ± 0.223b | 2.778 ± 0.191c | |
| Control groups | 5 days | 5 | 4.197 ± 0.374 | 4.763 ± 0.222 | 14.74 ± 0.389 | 5.857 ± 0.207 |
| 10 days | 5 | 3.823 ± 0.195 | 5.763 ± 0.235 | 14.56 ± 0.265 | 6.703 ± 0.261 | |
| 20 days | 5 | 5.228 ± 0.175 | 5.827 ± 0.184 | 12.52 ± 0.228 | 5.434 ± 0.242 | |
| Chronic cold stress groups | 5 days | 5 | 4.426 ± 0.243 | 5.150 ± 0.244* | 12.17 ± 0.293* | 6.443 ± 0.211* |
| 10 days | 5 | 4.512 ± 0.192* | 6.823 ± 0.214* | 11.13 ± 0.338* | 5.575 ± 0.291* | |
| 20 days | 5 | 5.206 ± 0.296 | 6.938 ± 0.263* | 11.68 ± 0.292* | 4.979 ± 0.286* |
The different letters in acute cold stress groups indicated that there were significant differences (P < 0.05) between any two groups, the same letters in acute cold stress group indicated that there were no significant differences between any two groups. * in chronic cold stress groups indicated that there were significant differences (P < 0.05) between the control group and the stress group at the same time point, while without * in chronic cold stress groups indicated that there were no significant differences between the control group and the stress group at the same time point. Each value represented the mean ± SD of 5 individuals
Table 7.
Effect of acute and chronic cold stress on IL-4 content in the spleen, thymus, and bursa of Fabricius of chickens
| Groups | Cold stress time | Sample | Serum (pg/ml) | Spleen (pg/ml) | Thymus (pg/ml) | Bursa of Fabricius (pg/ml) |
|---|---|---|---|---|---|---|
| Acute cold stress groups | 0 h | 5 | 38.86 ± 0.380c | 22.61 ± 0.418c | 27.71 ± 0.464b | 7.100 ± 0.343b |
| 1 h | 5 | 28.18 ± 0.384d | 22.74 ± 0.370b,c | 23.59 ± 0.448d | 6.059 ± 0.310c | |
| 3 h | 5 | 44.34 ± 0.623a | 23.03 ± 0.381b,c | 30.74 ± 0.534a | 9.229 ± 0.394a | |
| 6 h | 5 | 43.27 ± 0.804b | 23.92 ± 0.370a | 24.44 ± 0.536c | 8.946 ± 0.331a | |
| 12 h | 5 | 43.27 ± 0.669b | 20.16 ± 0.348d | 21.38 ± 0.422e | 7.479 ± 0.295b | |
| 24 h | 5 | 43.31 ± 0.488b | 23.28 ± 0.411b | 24.47 ± 0.463c | 8.804 ± 0.317a | |
| Control groups | 5 days | 5 | 31.78 ± .0641 | 12.24 ± 0.448 | 19.60 ± 0.413 | 6.269 ± 0.311 |
| 10 days | 5 | 23.17 ± 0.290 | 16.74 ± 0.338 | 14.39 ± 0.404 | 5.978 ± 0.329 | |
| 20 days | 5 | 36.14 ± 0.256b | 9.957 ± 0.324 | 14.89 ± 0.409 | 6.906 ± 0.283 | |
| Chronic cold stress groups | 5 days | 5 | 24.87 ± 0.382* | 11.09 ± 0.343* | 17.69 ± 0.370* | 10.25 ± 0.335* |
| 10 days | 5 | 23.28 ± 0.284 | 13.63 ± 0.610* | 11.51 ± 0.391* | 5.710 ± 0.308 | |
| 20 days | 5 | 39.54 ± 0.320* | 11.09 ± 0.348* | 12.55 ± 0.404* | 8.448 ± 0.318* |
The different letters in acute cold stress groups indicated that there were significant differences (P < 0.05) between any two groups, the same letters in acute cold stress group indicated that there were no significant differences between any two groups. * in chronic cold stress groups indicated that there were significant differences (P < 0.05) between the control group and the stress group at the same time point, while without * in chronic cold stress groups indicated that there were no significant differences between the control group and the stress group at the same time point. Each value represented the mean ± SD of 5 individuals
Table 8.
Effect of acute and chronic cold stress on IL-10 content in the spleen, thymus, and bursa of Fabricius of chickens
| Groups | Cold stress time | Sample | Serum (pg/ml) | Spleen (pg/ml) | Thymus (pg/ml) | Bursa of Fabricius (pg/ml) |
|---|---|---|---|---|---|---|
| Acute cold stress groups | 0 h | 5 | 61.11 ± 1.062e | 37.78 ± 0.585b | 37.33 ± 0.488c | 25.86 ± 0.601c |
| 1 h | 5 | 60.83 ± 0.879e | 33.96 ± 0.716c | 34.49 ± 0.727d | 27.04 ± 0.650b | |
| 3 h | 5 | 85.42 ± 0.909c | 42.64 ± 0.593a | 38.93 ± 0.573b | 29.56 ± 0.530a | |
| 6 h | 5 | 66.11 ± 0.776d | 30.00 ± 0.817e | 37.43 ± 0.541c | 25.97 ± 0.635c | |
| 12 h | 5 | 88.06 ± 0.903b | 30.83 ± 0.567e | 43.73 ± 0.616a | 25.97 ± 0.499c | |
| 24 h | 5 | 104.7 ± 0.953a | 32.08 ± 0.693d | 37.05 ± 0.546c | 24.82 ± 0.539d | |
| Control groups | 5 days | 5 | 26.49 ± 0.793 | 93.68 ± 0.814 | 63.71 ± 0.931 | 17.78 ± 0.707 |
| 10 days | 5 | 26.43 ± 0.749 | 86.08 ± 0.657 | 56.14 ± 0.765 | 23.21 ± 0.713 | |
| 20 days | 5 | 25.80 ± 0.766 | 70.09 ± 0.648 | 56.95 ± 0.780 | 16.78 ± 0.620 | |
| Chronic cold stress groups | 5 days | 5 | 22.21 ± 0.730* | 100.5 ± 0.954* | 76.49 ± 0.763* | 17.93 ± 0.843 |
| 10 days | 5 | 35.08 ± 0.828* | 86.45 ± 0.749 | 67.26 ± 0.736* | 22.67 ± 0.442 | |
| 20 days | 5 | 28.67 ± 0.875* | 79.97 ± 0.672* | 69.15 ± 0.619* | 19.08 ± 0.620* |
The different letters in acute cold stress groups indicated that there were significant differences (P < 0.05) between any two groups, the same letters in acute cold stress group indicated that there were no significant differences between any two groups. * in chronic cold stress groups indicated that there were significant differences (P < 0.05) between the control group and the stress group at the same time point, while without * in chronic cold stress groups indicated that there were no significant differences between the control group and the stress group at the same time point. Each value represented the mean ± SD of 5 individuals
Table 9.
Effect of acute and chronic cold stress on IFN-γ content in the spleen, thymus, and bursa of Fabricius of chickens
| Groups | Cold stress time | Sample | Serum (pg/ml) | Spleen (pg/ml) | Thymus (pg/ml) | Bursa of Fabricius (pg/ml) |
|---|---|---|---|---|---|---|
| Acute cold stress groups | 0 h | 5 | 6.762 ± 0.257e | 23.12 ± 0.322d | 12.71 ± 0.217b | 4.754 ± 0.216d |
| 1 h | 5 | 7.725 ± 0.212d | 28.67 ± 0.279c | 11.70 ± 0.233c | 7.498 ± 0.285a | |
| 3 h | 5 | 12.96 ± 0.370a | 31.56 ± 0.212b | 13.77 ± 0.187a | 5.008 ± 0.218c,d | |
| 6 h | 5 | 7.555 ± 0.246d | 32.29 ± 0.294b | 12.65 ± 0.155b | 4.838 ± 0.178d | |
| 12 h | 5 | 10.02 ± 0.180b | 41.51 ± 0.316a | 13.56 ± 0.149a | 6.791 ± 0.236b | |
| 24 h | 5 | 8.956 ± 0.188c | 40.79 ± 0.369a | 11.09 ± 0.195d | 5.206 ± 0.262c | |
| Control groups | 5 days | 5 | 6.876 ± 0.195 | 13.68 ± 0.390 | 11.01 ± 0.263 | 5.093 ± 0.23 |
| 10 days | 5 | 7.088 ± 0.180 | 17.66 ± 0.662 | 11.56 ± 0.167 | 5.178 ± 0.215 | |
| 20 days | 5 | 7.725 ± 0.216 | 17.48 ± 0.360 | 8.859 ± 0.157 | 5.206 ± 0.247 | |
| Chronic cold stress groups | 5 days | 5 | 5.114 ± 0.207* | 13.60 ± 0.341 | 8.877 ± 0.187* | 5.574 ± 0.245 |
| 10 days | 5 | 6.027 ± 0.230* | 11.18 ± 0.390* | 7.527 ± 0.157* | 6.027 ± 0.234* | |
| 20 days | 5 | 4.966 ± 0.220* | 12.50 ± 0.273* | 7.998 ± 0.156* | 8.036 ± 0.200* |
The different letters in acute cold stress groups indicated that there were significant differences (P < 0.05) between any two groups, the same letters in acute cold stress group indicated that there were no significant differences between any two groups. * in chronic cold stress groups indicated that there were significant differences (P < 0.05) between the control group and the stress group at the same time point, while without * in chronic cold stress groups indicated that there were no significant differences between the control group and the stress group at the same time point. Each value represented the mean ± SD of 5 individuals
Effects of cold stress on the mRNA and protein levels of Hsp90 in the spleen, thymus, and bursa of Fabricius of chickens
As shown in Figs. 1 and 6a, b, the results showed that acute cold stress significantly decreased (P < 0.05) the mRNA levels of the Hsp90 gene of spleen in all treatment groups and significantly increased (P < 0.05) the mRNA levels of the Hsp90 gene of thymus in all treatment groups. However, the mRNA expression of the Hsp90 gene was not significant (P > 0.05) in the thymus treatment groups. Compared with the corresponding control groups, chronic cold stress resulted in a significant increase (P < 0.05) of the mRNA levels of the Hsp90 gene in the spleen, thymus and bursa of Fabricius. Simultaneously, Western blot of Hsp90 results was consistent with Hsp90 mRNA response to cold stress (Fig. 6).
Fig. 1.
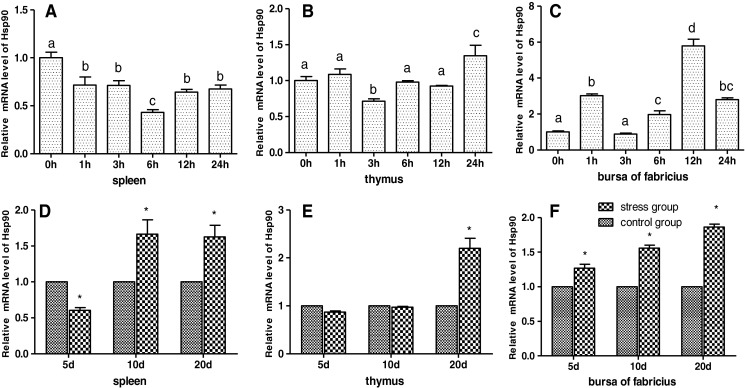
Effects of cold stress on the mRNA expression of the Hsp90 gene in the spleen, thymus, and bursa of Fabricius in chickens. Relative mRNA levels of the Hsp90 gene were detected by qPCR. In the acute cold stress experiment, the relative mRNA levels from the 0-h control group were used as the reference values in panels a to c. The different letters in panels a to c indicate that there are significant differences (P < 0.05) between any two groups. In the chronic cold stress experiment, the relative mRNA levels from the 5-, 10-, and 20-day control group were used as the reference values in panels d to f. Each value represented the mean ± SD of five individuals. *Significant differences (P < 0.05) between the control group and the stress group at the same time point
Fig. 6.
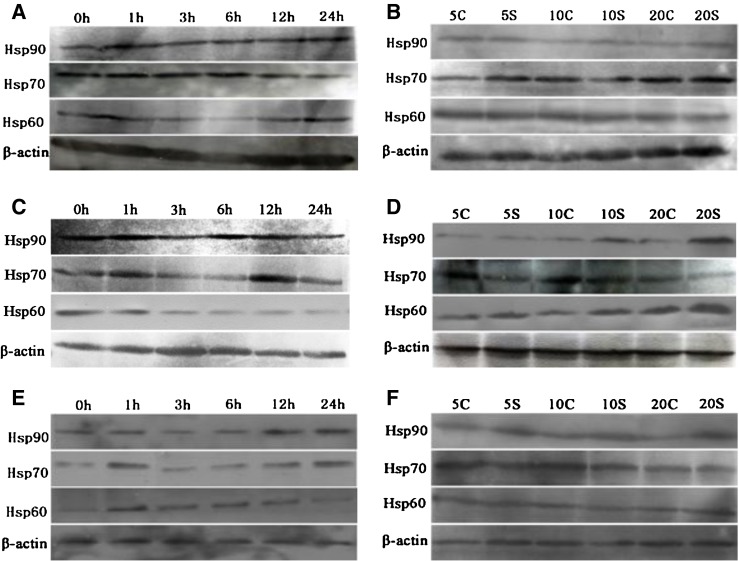
Effects of cold stress on the protein expression of Hsp90, Hsp70, and Hsp60 in the spleen, thymus, and bursa of Fabricius in chickens. Panels a to f represent the spleen, thymus, and bursa of Fabricius Hsp90, Hsp70, and Hsp60 protein expressions at acute and chronic cold stress groups, respectively. Acute cold stress groups (1 h, 3 h, 6 h, 12 h, and 24 h) and acute cold stress control group (0 h); chronic cold stress groups (5S, 10S, and 20S) and chronic corresponding control groups (5C, 10C, and 20C)
Effects of cold stress on the mRNA and protein levels of Hsp70 in the spleen, thymus, and bursa of Fabricius of chickens
As shown in Figs. 2 and 6c, d, the results showed that acute cold stress significantly decreased (P < 0.05) the mRNA levels of the Hsp70 gene of spleen and thymus in all treatment groups and significantly increased (P < 0.05) the mRNA levels of the Hsp70 gene of bursa of Fabricius in all treatment groups. Compared with the corresponding control groups, chronic cold stress resulted in a significant increase (P < 0.05) of the mRNA levels of the Hsp70 gene in the spleen and a significant decrease (P < 0.05) of the mRNA levels of the Hsp70 gene in the thymus and bursa of Fabricius. Simultaneously, Western blot of Hsp70 results was consistent with Hsp70 mRNA response to cold stress (Fig. 6).
Fig. 2.
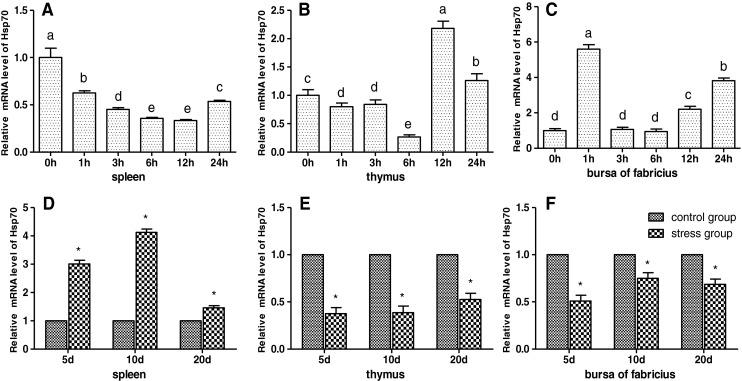
Effects of cold stress on the mRNA expression of the Hsp70 gene in the spleen, thymus, and bursa of Fabricius in chickens. Relative mRNA levels of the Hsp90 gene were detected by qPCR. In the acute cold stress experiment, the relative mRNA levels from the 0-h control group were used as the reference values in panels a to c. The different letters in panels a to c indicate that there are significant differences (P < 0.05) between any two groups. In the chronic cold stress experiment, the relative mRNA levels from the 5-, 10-, and 20-day control group were used as the reference values in panels d to f. Each value represented the mean ± SD of five individuals. *Significant differences (P < 0.05) between the control group and the stress group at the same time point
Effects of cold stress on the mRNA and protein levels of Hsp60 in the spleen, thymus, and bursa of Fabricius of chickens
As shown in Figs. 3 and 6e, f, the results showed that acute cold stress significantly decreased (P < 0.05) the mRNA levels of the Hsp60 gene of the spleen and thymus in all treatment groups and significantly increased (P < 0.05) the mRNA levels of the Hsp60 gene of bursa of Fabricius in all treatment groups. Compared with the corresponding control groups, chronic cold stress resulted in a significant increase (P < 0.05) of the mRNA levels of the Hsp60 gene in the spleen and thymus and a significant decrease (P < 0.05) of the mRNA levels of the Hsp60 gene in bursa of Fabricius. Simultaneously, Western blot of Hsp60 results was consistent with Hsp60 mRNA response to cold stress (Fig. 6).
Fig. 3.
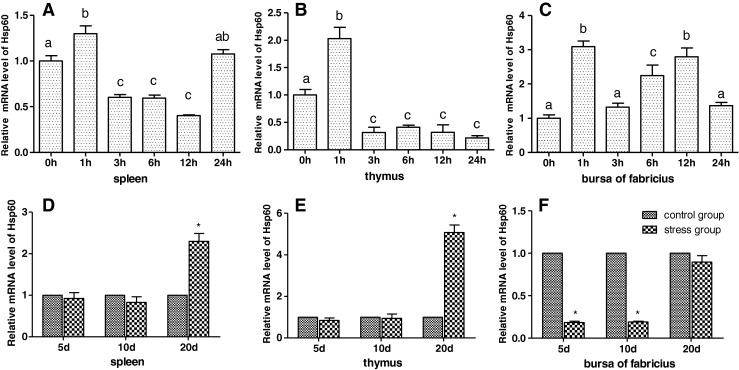
Effects of cold stress on the mRNA expression of the Hsp60 gene in the spleen, thymus, and bursa of Fabricius in chickens. In the acute cold stress experiment, the relative mRNA levels from the 0-h control group were used as the reference values in panels a to c. The different letters in panels a to c indicate that there are significant differences (P < 0.05) between any two groups. In the chronic cold stress experiment, the relative mRNA levels from the 5-, 10-, and 20-day control group were used as the reference values in panels d to f. Each value represented the mean ± SD of five individuals. *Significant differences (P < 0.05) between the control group and the stress group at the same time point
Effects of cold stress on the mRNA levels of Hsp40 in spleen, thymus, and bursa of Fabricius of chickens
As shown in Fig. 4, the results showed that acute cold stress significantly decreased (P < 0.05) the mRNA levels of the Hsp40 gene of the spleen and thymus in all treatment groups and significantly increased (P < 0.05) the mRNA levels of the Hsp40 gene of bursa of Fabricius in all treatment groups. Compared with the corresponding control groups, chronic cold stress resulted in a significant increase (P < 0.05) of the mRNA levels of the Hsp40 gene in the spleen and thymus and a significant decrease (P < 0.05) of the mRNA levels of the Hsp40 gene in bursa of Fabricius.
Fig. 4.
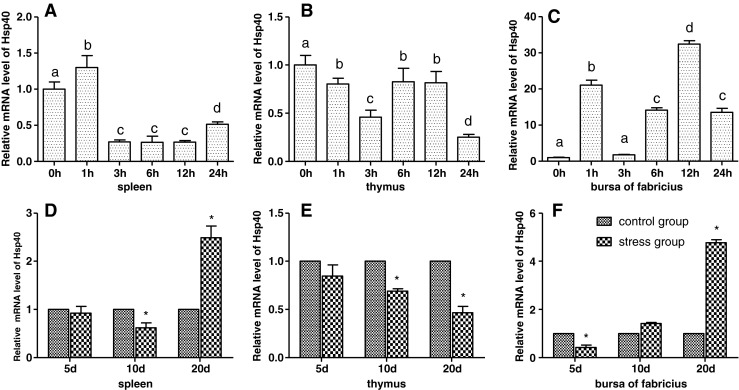
Effects of cold stress on the mRNA expression of the Hsp40 gene in the spleen, thymus, and bursa of Fabricius in chickens. Relative mRNA levels of the Hsp90 gene were detected by qPCR. In the acute cold stress experiment, the relative mRNA levels from the 0-h control group were used as the reference values in panels a to c. The different letters in panels a to c indicate that there are significant differences (P < 0.05) between any two groups. In the chronic cold stress experiment, the relative mRNA levels from the 5-, 10-, and 20-day control group were used as the reference values in panels d to f. Each value represented the mean ± SD of five individuals. *Significant differences (P < 0.05) between the control group and the stress group at the same time point
Effects of cold stress on the mRNA levels of Hsp27 in the spleen, thymus, and bursa of Fabricius of chickens
As shown in Figs. 5 and 6, the results showed that acute cold stress significantly increased (P < 0.05) the mRNA levels of the Hsp27 gene of the spleen, thymus, and bursa of Fabricius in all treatment groups. However, the mRNA expression of the Hsp27 gene was not significant (P > 0.05) in other treatment groups. Compared with the corresponding control groups, 5-day chronic cold stress resulted in a significant increase (P < 0.05) of the mRNA levels of the Hsp27 in the spleen and bursa of Fabricius and a significant decrease (P < 0.05) of the mRNA levels of the Hsp27 gene in the spleen and thymus of 20 days.
Fig. 5.
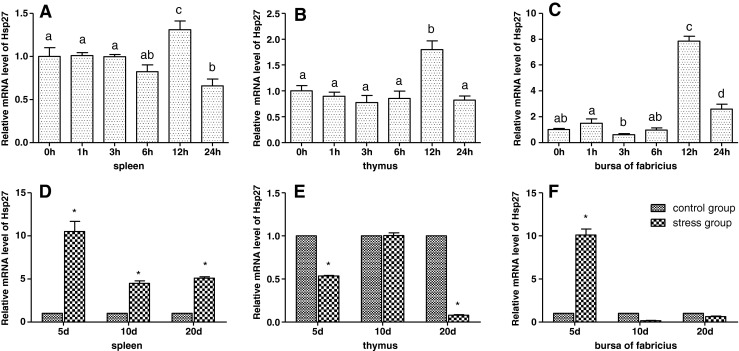
Effects of cold stress on the mRNA expression of the Hsp27 gene in the spleen, thymus, and bursa of Fabricius in chickens. Relative mRNA levels of the Hsp90 gene were detected by qPCR. In the acute cold stress experiment, the relative mRNA levels from the 0-h control group were used as the reference values in panels a to c. The different letters in panels a to c indicate that there are significant differences (P < 0.05) between any 2 groups. In the chronic cold stress experiment, the relative mRNA levels from the 5-, 10-, and 20-day control group were used as the reference values in panels d to f. Each value represented the mean ± SD of five individuals. *Significant differences (P < 0.05) between the control group and the stress group at the same time point
Discussion
Cold stress can disrupt the balance of the oxidant/antioxidant system and cause oxidative damage to several tissues by altering the enzymatic and nonenzymatic antioxidant status (Sahin and Gumuslu 2004). The misbalance of oxidant and antioxidant systems leads to oxidative damage and influences tissue function (Moller et al. 1996; Lucca et al. 2009). GSH-Px is considered to be the first line of cellular defense against oxidative damage (Ferreccio et al. 1998). And MDA can be used as general biomarker for biological oxidative stress (Kadiiska et al. 2005). Prior study indicated that cold stress induced the destruction of oxidant–antioxidant balance in the lung tissue of chicks, and caused the oxidation damage of DNA (Jia et al. 2009). Additionally, in our previous study, we found that acute and chronic cold exposure induced the oxidative damage in the intestine of chicks (Zhang et al. 2011). In the present study, T-AOC, GSH-Px, and SOD activities were significantly decreased accompanied with the increased MDA contents in the immune organs. It indicated that the balance of oxidant and antioxidant systems was disrupted, and cold stress induced the oxidative damage in immune organs. It has been known that oxidative stress can cause molecular damage to the vital structure and function of immune tissue via abnormalities in antioxidant enzyme metabolism (Chang et al. 2007; Allen et al. 2008). So similarly, our results suggest that oxidative stress may play a role in the immune injury induced by cold stress.
Several studies reported that cold exposure influenced the function of the immune system (Hangalapura et al. 2006; Helmreich et al. 2005; Onderci et al. 2003; Hangalapura et al. 2004b; Fleshner et al. 1998). Cytokines play an important role in immune systems. Expression of IL-2 and IFN-γ were decreased in cold water stress (5 min/day) in mice during 10 days of exposure and increased after 20 days of exposure (Monroy et al. 1999). Cold stress induced mRNA expression of T helper type 1 (Th1) (IFN-γ and IL-2) and T helper type 2 (Th2) (IL-4 and IL-10) in the small intestine of broilers (Zhao et al. 2013a, b). Similarly, it was reported that cold stress upregulated expression of Th1 (IFN-γ and IL-2) and Th2 (IL-4 and IL-10) cytokine genes in chickens (Hangalapura et al. 2003). Consistent with these prior studies, our results indicated that the IL-2 and IFN-γ content first increased then decreased in the spleen and bursa of Fabricius of chicks at acute cold stress. IL-4 content was increased in the spleen and bursa of Fabricius of chicks in the acute and chronic cold stress (Table 7). In the chronic cold stress, IL-2 and IL-10 contents were increased in the spleen and bursa of Fabricius and decreased in thymus. Due to the important roles of cytokines in immune systems, it may indicate that cold stress influenced the normal function of immune organs by the way of influencing the content of cytokines.
The cytoprotective roles of Hsps have been observed in a wide variety of animals and human. Hsps are highly conserved and expressed as a result of stressful environmental, pathological, or physiological stimuli (Young 1990), including ischemia, metabolic disorders, inflammation, and infection heat stress, ischemic stress, and other stress (Sreedhar and Csermely 2004). Hsps are a group of stress proteins that are synthesized universally by living organisms in response to environmental changes such as elevated temperature (Lindquist and Craig 1988; Lee et al. 1991), exposure to oxidative stresses (Liao et al. 1994). The present study focuses on the expression of various Hsps involved in control of oxidative stress in the immune systems of chickens at cold stress. Hsps act as an antioxidant in maintaining cellular redox homeostasis. Moreover, the protective effects of Hsp70 are associated with its interactions with cellular proteins that are involved in redox homeostasis, which might ultimately prevent oxidative stress. Previous studies have demonstrated that overexpression of Hsp70 by gene transfection in the animal could preserve the activity and content of Mn-SOD (Tupling et al. 2008). And the overexpression of Hsp70 was observed in physical and chemical stress of Chamelea gallina (Monari et al. 2011). Consistent with these prior studies, mRNA and protein levels of Hsp70 in immune organs were upregulated in the present study. Moreover, our results showed that Hsp expression generally had an increased trend in immune tissues. Combining with the decreased cytokines and the increased expression of Hsps in immune organs, it suggested that immune function may be reduced in the acute cold stress. In the acute cold stress groups, Hsp60 and Hsp40 were increased in the 1-h group. It indicated that at the early stage, Hsp60 and Hsp40 may have a compensatory increase in response to environmental stress. In chronic cold stress groups, the expression of Hsps was increased. The results showed that effect of stress on animal immune system is complicated. Generally, the acute stress suppressed the function of the immune, and chronic stress caused immune enhancement to some extent (Sima et al. 1998). In addition, the increased expression of Hsps induced by cold stress may indicate that Hsps play important roles in the immune organs to resist the cold stress in chicks. In addition, this is consistent with the prior studies indicating the important roles of Hsp in the immune system (Ellis 1990; Lindquist and Craig 1988; Morimoto 1993). Hsps are upregulated in response to various forms of stress, like oxidative, heat, and inflammatory stress (Hartl et al. 1992). Hsp40 cooperates with Hsp70 to facilitate protein folding (Li et al. 2009). Moreover, the increase of Hsp70 was linked to the protection of key protein sensitivity to thermal variations (Hamdoun et al. 2003). So, it also suggested that increased Hsp expression was an important protective protein to regulate the immune function of chicks in cold stress conditions.
Many studies have shown that Hsps play an important role during and after exposure to oxidative stress. A study of Li et al. (2011) indicated that psychological stress induces oxidative damage and upregulates the expression of Hsp70 in masseter muscles in rats. Others results suggested that intestinal oxidative stress induced high expression of Hsp70, and findings provide that evidence Hsp70 is capable of protecting the intestinal mucosa from stress injury by improving antioxidant capacity of broilers (Hao et al. 2012; Gu et al. 2012). In addition, it has been previously reported that oxidative stress induced the accumulation of Hsp70 within the nucleolus (Tu et al. 2005). Our previous study results suggested that Hsp expression increases in the heart from oxidative damage after cold stress (Zhao et al. 2013a, b). Similar to these prior studies, this paper suggested that cold stress could induce oxidative damage and upregulates Hsp expression in the chicken immune organs. Our results suggested that Hsps may confer protection from oxidative stress induced by cold stress by improving antioxidant capacity of immune organs.
In conclusion, these results suggested that cold stress induced the oxidative stress in the three tissues and influenced the immune function of chicks. Higher expression of Hsps may play a role in protecting oxidative stress in immune organs against cold stress.
Acknowledgments
This work was supported by technological innovation projects special funds of Harbin, China (no. 2010RFXXN041). The authors thank the members in the veterinary internal medicine laboratory, especially the members of the cold stress group, at College of Veterinary Medicine, Northeast Agricultural University (Harbin, China) for the help in feeding the chicks and analyzing the data.
Footnotes
All authors have read the manuscript and have agreed to submit it in its current form for consideration for publication in the Journal.
Contributor Information
Shu Li, Phone: +86-451-55190407, Email: lishu@neau.edu.cn.
Shi Wen Xu, Phone: +86-451-55190407, Email: shiwenxu@neau.edu.cn.
References
- Al-Aqil A, Zulkifli I. Changes in heat shock protein 70 expression and blood characteristics in transported broiler chickens as affected by housing and early age feed restriction. Poult Sci. 2009;88(7):1358–1364. doi: 10.3382/ps.2008-00554. [DOI] [PubMed] [Google Scholar]
- Allen DG, Lamb GD, Westerblad H. Skeletal muscle fatigue: cellular mechanisms. Physiol Rev. 2008;88(1):287–332. doi: 10.1152/physrev.00015.2007. [DOI] [PubMed] [Google Scholar]
- Ausiello CM, Palazzo R, Spensieri F, Fedele G, Lande R, Ciervo A, Fioroni G, Cassone A. 60-kDa heat shock protein of Chlamydia pneumoniae is a target of T-cell immune response. J Biol Regul Homeost Agents. 2005;19(3–4):136–140. [PubMed] [Google Scholar]
- Bottje WG, Wang S, Beers KW, Cawthon D. Lung lining fluid antioxidants in male broilers: age-related changes under thermoneutral and cold temperature conditions. Poult Sci. 1998;77(12):1905–1912. doi: 10.1093/ps/77.12.1905. [DOI] [PubMed] [Google Scholar]
- Brenner IK, Castellani JW, Gabaree C, Young AJ, Zamecnik J, Shephard RJ, Shek PN. Immune changes in humans during cold exposure: effects of prior heating and exercise. J Appl Physiol (1985) 1999;87(2):699–710. doi: 10.1152/jappl.1999.87.2.699. [DOI] [PubMed] [Google Scholar]
- Chang CK, Huang HY, Tseng HF, Hsuuw YD, Tso TK. Interaction of vitamin E and exercise training on oxidative stress and antioxidant enzyme activities in rat skeletal muscles. J Nutr Biochem. 2007;18(1):39–45. doi: 10.1016/j.jnutbio.2006.02.007. [DOI] [PubMed] [Google Scholar]
- Ellis RJ. The molecular chaperone concept. Semin Cell Biol. 1990;1(1):1–9. [PubMed] [Google Scholar]
- Felten SY, Madden KS, Bellinger DL, Kruszewska B, Moynihan JA, Felten DL. The role of the sympathetic nervous system in the modulation of immune responses. Adv Pharmacol. 1998;42:583–587. doi: 10.1016/S1054-3589(08)60818-2. [DOI] [PubMed] [Google Scholar]
- Ferreccio C, Gonzalez Psych C, Milosavjlevic Stat V, Marshall Gredis G, Sancha AM. Lung cancer and arsenic exposure in drinking water: a case–control study in northern Chile. Cad Saude Publica. 1998;14(Suppl 3):193–198. doi: 10.1590/S0102-311X1998000700021. [DOI] [PubMed] [Google Scholar]
- Fleshner M, Nguyen KT, Cotter CS, Watkins LR, Maier SF. Acute stressor exposure both suppresses acquired immunity and potentiates innate immunity. Am J Physiol. 1998;275(3 Pt 2):R870–R878. doi: 10.1152/ajpregu.1998.275.3.R870. [DOI] [PubMed] [Google Scholar]
- Gu XH, Hao Y, Wang XL. Overexpression of heat shock protein 70 and its relationship to intestine under acute heat stress in broilers: 2. Intestinal oxidative stress. Poult Sci. 2012;91:790–799. doi: 10.3382/ps.2011-01628. [DOI] [PubMed] [Google Scholar]
- Guo S, Wharton W, Moseley P, Shi H. Heat shock protein 70 regulates cellular redox status by modulating glutathione-related enzyme activities. Cell Stress Chaperones. 2007;12(3):245–254. doi: 10.1379/CSC-265.1. [DOI] [PMC free article] [PubMed] [Google Scholar]
- Habich C, Burkart V. Heat shock protein 60: regulatory role on innate immune cells. Cell Mol Life Sci. 2007;64(6):742–751. doi: 10.1007/s00018-007-6413-7. [DOI] [PMC free article] [PubMed] [Google Scholar]
- Hamdoun AM, Cheney DP, Cherr GN. Phenotypic plasticity of HSP70 and HSP70 gene expression in the Pacific oyster (Crassostrea gigas): implications for thermal limits and induction of thermal tolerance. Biol Bull. 2003;205(2):160–169. doi: 10.2307/1543236. [DOI] [PubMed] [Google Scholar]
- Hangalapura BN, Nieuwland MG, de Vries RG, Heetkamp MJ, van den Brand H, Kemp B, Parmentier HK. Effects of cold stress on immune responses and body weight of chicken lines divergently selected for antibody responses to sheep red blood cells. Poult Sci. 2003;82(11):1692–1700. doi: 10.1093/ps/82.11.1692. [DOI] [PubMed] [Google Scholar]
- Hangalapura BN, Nieuwland MG, Buyse J, Kemp B, Parmentier HK. Effect of duration of cold stress on plasma adrenal and thyroid hormone levels and immune responses in chicken lines divergently selected for antibody responses. Poult Sci. 2004;83(10):1644–1649. doi: 10.1093/ps/83.10.1644. [DOI] [PubMed] [Google Scholar]
- Hangalapura BN, Nieuwland MG, de Vries RG, van den Brand H, Kemp B, Parmentier HK. Durations of cold stress modulates overall immunity of chicken lines divergently selected for antibody responses. Poult Sci. 2004;83(5):765–775. doi: 10.1093/ps/83.5.765. [DOI] [PubMed] [Google Scholar]
- Hangalapura BN, Kaiser MG, Poel JJ, Parmentier HK, Lamont SJ. Cold stress equally enhances in vivo pro-inflammatory cytokine gene expression in chicken lines divergently selected for antibody responses. Dev Comp Immunol. 2006;30(5):503–511. doi: 10.1016/j.dci.2005.07.001. [DOI] [PubMed] [Google Scholar]
- Hao Y, Gu XH, Wang XL. Overexpression of heat shock protein 70 and its relationship to intestine under acute heat stress in broilers: 1. Intestinal structure and digestive function. Poult Sci. 2012;91:781–789. doi: 10.3382/ps.2011-01627. [DOI] [PubMed] [Google Scholar]
- Hartl FU, Martin J, Neupert W. Protein folding in the cell: the role of molecular chaperones Hsp70 and Hsp60. Annu Rev Biophys Biomol Struct. 1992;21:293–322. doi: 10.1146/annurev.bb.21.060192.001453. [DOI] [PubMed] [Google Scholar]
- Helmreich DL, Parfitt DB, Lu XY, Akil H, Watson SJ. Relation between the hypothalamic-pituitary-thyroid (HPT) axis and the hypothalamic-pituitary-adrenal (HPA) axis during repeated stress. Neuroendocrinology. 2005;81(3):183–192. doi: 10.1159/000087001. [DOI] [PubMed] [Google Scholar]
- Jaattela M. Escaping cell death: survival proteins in cancer. Exp Cell Res. 1999;248(1):30–43. doi: 10.1006/excr.1999.4455. [DOI] [PubMed] [Google Scholar]
- Jansky L, Pospisilova D, Honzova S, Ulicny B, Sramek P, Zeman V, Kaminkova J. Immune system of cold-exposed and cold-adapted humans. Eur J Appl Physiol Occup Physiol. 1996;72(5–6):445–450. doi: 10.1007/BF00242274. [DOI] [PubMed] [Google Scholar]
- Jia HY, Li JM, Yu Q, Wang JJ, Li S. The effect of cold stress on DNA oxidative damage of lung in chicken. Zhongguo Ying Yong Sheng Li Xue Za Zhi. 2009;25(3):373–376. [PubMed] [Google Scholar]
- Kadiiska MB, Gladen BC, Baird DD, Germolec D, Graham LB, Parker CE, Nyska A, Wachsman JT, Ames BN, Basu S, Brot N, Fitzgerald GA, Floyd RA, George M, Heinecke JW, Hatch GE, Hensley K, Lawson JA, Marnett LJ, Morrow JD, Murray DM, Plastaras J, Roberts LJ, 2nd, Rokach J, Shigenaga MK, Sohal RS, Sun J, Tice RR, Van Thiel DH, Wellner D, Walter PB, Tomer KB, Mason RP, Barrett JC. Biomarkers of oxidative stress study II: are oxidation products of lipids, proteins, and DNA markers of CCl4 poisoning? Free Radic Biol Med. 2005;38(6):698–710. doi: 10.1016/j.freeradbiomed.2004.09.017. [DOI] [PubMed] [Google Scholar]
- Lee YJ, Curetty L, Corry PM (1991) Differences in preferential synthesis and redistribution of HSP70 and HSP28 families by heat or sodium arsenite in Chinese hamster ovary cells. J Cell Physiol 149(1):77-87. [DOI] [PubMed]
- Li J, Qian X, Sha B. Heat shock protein 40: structural studies and their functional implications. Protein Pept Lett. 2009;16(6):606–612. doi: 10.2174/092986609788490159. [DOI] [PMC free article] [PubMed] [Google Scholar]
- Li Q, Zhang M, Chen YJ, Wang YJ, Huang F, Liu J. Oxidative damage and HSP70 expression in masseter muscle induced by psychological stress in rats. Physiol Behav. 2011;104(3):365–372. doi: 10.1016/j.physbeh.2011.04.012. [DOI] [PubMed] [Google Scholar]
- Liao F, Andalibi A, Qiao JH, Allayee H, Fogelman AM, Lusis AJ. Genetic evidence for a common pathway mediating oxidative stress, inflammatory gene induction, and aortic fatty streak formation in mice. J Clin Invest. 1994;94(2):877–884. doi: 10.1172/JCI117409. [DOI] [PMC free article] [PubMed] [Google Scholar]
- Lin H, Decuypere E, Buyse J. Oxidative stress induced by corticosterone administration in broiler chickens (Gallus gallus domesticus) Comp Biochem Physiol B: Biochem Mol Biol. 2004;139(4):745–751. doi: 10.1016/j.cbpc.2004.09.014. [DOI] [PubMed] [Google Scholar]
- Lindquist S, Craig EA. The heat-shock proteins. Annu Rev Genet. 1988;22:631–677. doi: 10.1146/annurev.ge.22.120188.003215. [DOI] [PubMed] [Google Scholar]
- Lucca G, Comim CM, Valvassori SS, Reus GZ, Vuolo F, Petronilho F, Dal-Pizzol F, Gavioli EC, Quevedo J. Effects of chronic mild stress on the oxidative parameters in the rat brain. Neurochem Int. 2009;54(5–6):358–362. doi: 10.1016/j.neuint.2009.01.001. [DOI] [PubMed] [Google Scholar]
- Moller P, Wallin H, Knudsen LE. Oxidative stress associated with exercise, psychological stress and life-style factors. Chem Biol Interact. 1996;102(1):17–36. doi: 10.1016/0009-2797(96)03729-5. [DOI] [PubMed] [Google Scholar]
- Monari M, Foschi J, Rosmini R, Marin MG, Serrazanetti GP. Heat shock protein 70 response to physical and chemical stress in Chamelea gallina. J Exp Mar Biol Ecol. 2011;397(2):71–78. doi: 10.1016/j.jembe.2010.11.016. [DOI] [Google Scholar]
- Monroy FP, Banerjee SK, Duong T, Aviles H. Cold stress-induced modulation of inflammatory responses and intracerebral cytokine mRNA expression in acute murine toxoplasmosis. J Parasitol. 1999;85(5):878–886. doi: 10.2307/3285825. [DOI] [PubMed] [Google Scholar]
- Morimoto RI. Cells in stress: transcriptional activation of heat shock genes. Science. 1993;259(5100):1409–1410. doi: 10.1126/science.8451637. [DOI] [PubMed] [Google Scholar]
- Mujahid A. Acute cold-induced thermogenesis in neonatal chicks (Gallus gallus) Comp Biochem Physiol A Mol Integr Physiol. 2010;156(1):34–41. doi: 10.1016/j.cbpa.2009.12.004. [DOI] [PubMed] [Google Scholar]
- Mujahid A, Furuse M. Oxidative damage in different tissues of neonatal chicks exposed to low environmental temperature. Comp Biochem Physiol A Mol Integr Physiol. 2009;152(4):604–608. doi: 10.1016/j.cbpa.2009.01.011. [DOI] [PubMed] [Google Scholar]
- Onderci M, Sahin N, Sahin K, Kilic N. Antioxidant properties of chromium and zinc: in vivo effects on digestibility, lipid peroxidation, antioxidant vitamins, and some minerals under a low ambient temperature. Biol Trace Elem Res. 2003;92(2):139–150. doi: 10.1385/BTER:92:2:139. [DOI] [PubMed] [Google Scholar]
- Opara EC, Abdel-Rahman E, Soliman S, Kamel WA, Souka S, Lowe JE, Abdel-Aleem S. Depletion of total antioxidant capacity in type 2 diabetes. Metabolism. 1999;48(11):1414–1417. doi: 10.1016/S0026-0495(99)90152-X. [DOI] [PubMed] [Google Scholar]
- Peirson SN, Butler JN, Foster RG. Experimental validation of novel and conventional approaches to quantitative real-time PCR data analysis. Nucleic Acids Res. 2003;31(14):e73. doi: 10.1093/nar/gng073. [DOI] [PMC free article] [PubMed] [Google Scholar]
- Pfaffl MW. A new mathematical model for relative quantification in real-time RT-PCR. Nucleic Acids Res. 2001;29(9):e45. doi: 10.1093/nar/29.9.e45. [DOI] [PMC free article] [PubMed] [Google Scholar]
- Regnier JA, Kelley KW. Heat- and cold-stress suppresses in vivo and in vitro cellular immune responses of chickens. Am J Vet Res. 1981;42(2):294–299. [PubMed] [Google Scholar]
- Rotruck JT, Pope AL, Ganther HE, Swanson AB, Hafeman DG, Hoekstra WG. Selenium: biochemical role as a component of glutathione peroxidase. Science. 1973;179(4073):588–590. doi: 10.1126/science.179.4073.588. [DOI] [PubMed] [Google Scholar]
- Rybakina EG, Shanin SN, Kozinets IA, Fomicheva EE, Korneva EA. Cellular mechanisms of cold stress-related immunosuppression and the action of interleukin 1. Int J Tissue React. 1997;19(3–4):135–140. [PubMed] [Google Scholar]
- Sahin E, Gumuslu S. Cold-stress-induced modulation of antioxidant defence: role of stressed conditions in tissue injury followed by protein oxidation and lipid peroxidation. Int J Biometeorol. 2004;48(4):165–171. doi: 10.1007/s00484-004-0205-7. [DOI] [PubMed] [Google Scholar]
- Sesti-Costa R, Ignacchiti MD, Chedraoui-Silva S, Marchi LF, Mantovani B. Chronic cold stress in mice induces a regulatory phenotype in macrophages: correlation with increased 11beta-hydroxysteroid dehydrogenase expression. Brain Behav Immun. 2012;26(1):50–60. doi: 10.1016/j.bbi.2011.07.234. [DOI] [PubMed] [Google Scholar]
- Sima P, Cervinkova M, Funda DP, Holub M. Enhancement by mild cold stress of the antibody forming capacity in euthymic and athymic hairless mice. Folia Microbiol (Praha) 1998;43(5):521–523. doi: 10.1007/BF02820811. [DOI] [PubMed] [Google Scholar]
- Sreedhar AS, Csermely P. Heat shock proteins in the regulation of apoptosis: new strategies in tumor therapy: a comprehensive review. Pharmacol Ther. 2004;101(3):227–257. doi: 10.1016/j.pharmthera.2003.11.004. [DOI] [PubMed] [Google Scholar]
- Tsan MF, Gao B. Heat shock proteins and immune system. J Leukoc Biol. 2009;85(6):905–910. doi: 10.1189/jlb.0109005. [DOI] [PubMed] [Google Scholar]
- Tu ZZ, Wang KK, Zou J, Liu K, Deng GH, Xiao XZ. Oxidative stress-induced accumulation of heat shock protein 70 within nucleolus. Zhong Nan Da Xue Xue Bao Yi Xue Ban. 2005;30:384–389. [PubMed] [Google Scholar]
- Tupling AR, Bombardier E, Vigna C, Quadrilatero J, Fu M. Interaction between Hsp70 and the SR Ca2+ pump: a potential mechanism for cytoprotection in heart and skeletal muscle. Appl Physiol Nutr Metab. 2008;33(5):1023–1032. doi: 10.1139/H08-067. [DOI] [PubMed] [Google Scholar]
- Wang JW, Xu SW. Effects of Cold Stress on the Messenger Ribonucleic Acid Levels of Corticotrophin-Releasing Hormone and Thyrotropin-Releasing Hormone in Hypothalami of Broilers. Poult Sci. 2008;87(5):973–978. doi: 10.3382/ps.2007-00281. [DOI] [PubMed] [Google Scholar]
- Wang JT, Li S, Li JL, Zhang JW, Xu SW. Effects of cold stress on the messenger ribonucleic acid levels of peroxisome proliferator-activated receptor- in spleen, thymus, and bursa of Fabricius of chickens. Poult Sci. 2009;88(12):2549–2554. doi: 10.3382/ps.2009-00404. [DOI] [PubMed] [Google Scholar]
- Wu C. Heat shock transcription factors: structure and regulation. Annu Rev Cell Dev Biol. 1995;11:441–469. doi: 10.1146/annurev.cb.11.110195.002301. [DOI] [PubMed] [Google Scholar]
- Young RA. Stress proteins and immunology. Annu Rev Immunol. 1990;8:401–420. doi: 10.1146/annurev.iy.08.040190.002153. [DOI] [PubMed] [Google Scholar]
- Zhang ZW, Lv ZH, Li JL, Li S, Xu SW, Wang XL. Effects of cold stress on nitric oxide in duodenum of chicks. Poult Sci. 2011;90(7):1555–1561. doi: 10.3382/ps.2010-01333. [DOI] [PubMed] [Google Scholar]
- Zhao FQ, Zhang ZW, Yao HD, Wang LL, Liu T, Yu XY, Li S, Xu SW. Effects of cold stress on mRNA expression of immunoglobulin and cytokine in the small intestine of broilers. Res Vet Sci. 2013;95(1):146–155. doi: 10.1016/j.rvsc.2013.01.021. [DOI] [PubMed] [Google Scholar]
- Zhao FQ, Zhang ZW, Wang C, Zhang B, Yao HD, Li S, Xu SW. The role of heat shock proteins in inflammatory injury induced by cold stress in chicken hearts. Cell Stress Chaperones. 2013;18:773–783. doi: 10.1007/s12192-013-0429-8. [DOI] [PMC free article] [PubMed] [Google Scholar]