

Abstract
Objective
Pathology reports are rich in narrative statements that encode a complex web of relations among medical concepts. These relations are routinely used by doctors to reason on diagnoses, but often require hand-crafted rules or supervised learning to extract into prespecified forms for computational disease modeling. We aim to automatically capture relations from narrative text without supervision.
Methods
We design a novel framework that translates sentences into graph representations, automatically mines sentence subgraphs, reduces redundancy in mined subgraphs, and automatically generates subgraph features for subsequent classification tasks. To ensure meaningful interpretations over the sentence graphs, we use the Unified Medical Language System Metathesaurus to map token subsequences to concepts, and in turn sentence graph nodes. We test our system with multiple lymphoma classification tasks that together mimic the differential diagnosis by a pathologist. To this end, we prevent our classifiers from looking at explicit mentions or synonyms of lymphomas in the text.
Results and Conclusions
We compare our system with three baseline classifiers using standard n-grams, full MetaMap concepts, and filtered MetaMap concepts. Our system achieves high F-measures on multiple binary classifications of lymphoma (Burkitt lymphoma, 0.8; diffuse large B-cell lymphoma, 0.909; follicular lymphoma, 0.84; Hodgkin lymphoma, 0.912). Significance tests show that our system outperforms all three baselines. Moreover, feature analysis identifies subgraph features that contribute to improved performance; these features agree with the state-of-the-art knowledge about lymphoma classification. We also highlight how these unsupervised relation features may provide meaningful insights into lymphoma classification.
Keywords: Automatic lymphoma classification, Sentence subgraph mining, Pathology reports, Natural language processing
Introduction
The differential diagnosis of lymphoid malignancies has long been a difficult task and a source of debates for pathologists and clinicians.1–4 To standardize knowledge into a widely accepted guideline, the WHO published a consensus lymphoma classification in 2001,5 which was revised in 2008.6 Even with the full spectrum of clinical and genetic features used in this guideline, uncertainty persists in pathologists’ daily practice.7 8 Since its original publication, several case series and reviews of lymphoma have suggested refinements to the current classification scheme and additional lymphoma subtypes.9–13 Facing this ongoing need for periodic revision, the current approach to revise the WHO classification presents several challenges. First, the review process took more than 1 year, involving an eight-member steering committee and over 130 pathologists and hematologists worldwide6; hence it is a time-consuming and labor-intensive task. Moreover, the cases covered for revision considerations are subject to selection bias from different studies. These challenges motivated us to build an interpretable lymphoma classification model to automate the case review process in a systematic way.
Many medical natural language processing (NLP) systems aim to extract medical problems from text to identify patient cohorts for clinical studies.14–19 They rely heavily on mentions and synonyms of the targeted problems. In contrast, we exclude all mentions and synonyms of lymphomas. The aim is to prevent oracles from telling the system the true lymphoma type and to mimic the differential diagnosis, with the pathology reports as proxies for related laboratory results and tests. The automatically built diagnostic models are intended to assist with expert review, and thus it is necessary not only to achieve high accuracy, but also to retain interpretable features.
Related work
Some of the advances in the state-of-the-art specialized clinical NLP systems for identifying medical problems have been documented in challenge workshops such as the yearly i2b2 (Informatics for Integrating Biology to the Bedside) workshops, which have attracted international teams to address successive shared classification tasks. The first such challenge focused in part on identifying the smoking status of patients.17 Features used by the successful teams included mentioned medical entities, n-grams (up to trigrams), part-of-speech (POS) tags, and challenge-specific regular expressions, dictionaries, and assertion classification rules. Feature-engineering details contributed significantly among the best performing systems.20–22 In a later challenge, recognizing obesity and its 15 comorbidities,19 the top four systems employed heavier feature engineering on hand-crafted rules which integrated ‘disease-specific, non-preventive medications and their brand names’,23 disease-related procedures,24 and disease-specific symptoms.25 26 However, task-specific rules and regular expressions to capture medical concepts and relations are usually subdomain-specific and hard to generalize. In contrast, standard linguistic features such as n-grams are difficult to interpret—the selected n-grams may not be meaningful.
General clinical NLP systems such as cTAKES15 and MetaMap16 can extract negation-classified27 medical concepts. Besides negations, they specify few additional relations. Other systems apply hand-crafted rules to extract prespecified semantic relations, such as MedLEE,28 MedEx,29 and SemRep,30 or require supervised learning on prespecified semantic relations, such as those stated by Uzuner et al,31 and thus are hard to adapt to new subdomains. The value of syntactic parsing in concept and relation extraction has also been explored, such as phrase chunking in cTAKES,15 shallow parsing with the Stanford Parser,32 short syntactic link chain extraction in Sibanda et al,33 and Treebank building such as in the MiPACQ corpus.34 Our work features unsupervised extraction of relations among a flexible number of medical concepts, which produces features that both improve performance over baselines and are more interpretable.
Problem definition
Pathology reports typically record four general categories of patient information: clinical presentation, morphology, immunophenotype, and cytogenetics. Our corpus is rich in narrative sentences that specify complex relations among medical concepts. We accordingly design a sentence subgraph mining framework that is suitable for capturing such relations. Using the features generated from this framework, we performed the following tasks.
We tested the hypothesis that an automated lymphoma classifier with sentence subgraph features can outperform the baseline classifier with standard n-gram features.
We tested the hypothesis that sentence subgraph features can outperform the baselines with full or filtered medical concept features extracted by the latest MetaMap.
We showed that sentence subgraph features are friendly to interpretation and provide insights into the diagnosis of lymphoma.
To prevent classifiers from using the explicit mentions and synonyms of the lymphoma types, we exclude phrases overlapping with a Medical Subject Heading (MeSH)35 of ‘lymphoma’ or ‘leukemia’. We also exclude phrases that match a set of manually constructed patterns aiming to catch abbreviations and synonyms of the target lymphomas that may be missed by MeSH. Please refer to the online supplement for more details.
Data collection
Our corpus consists of Massachusetts General Hospital (MGH) pathology reports in the Research Patient Data Registry (RPDR)36 database. An MGH pathology report consists of standard and semi-standard sections as shown in figure 1.
Figure 1.

Massachusetts General Hospital pathology reports usually contain four sections with almost all information retained as narrative text. Clinical data, the first section, include patient age, medical history, and ongoing treatment procedures, etc. The second section, morphology and immunohistochemistry, describes cellular structural alterations appearing under a light microscope aided by a variety of dyes, some of which are conjugated to cell-specific antibodies. The third section is on flow cytometry, which describes the characteristic expression of various surface antigens on cells. The individual or combined percentages of antigens (eg, CD20, CD5 and CD10) are reported. Also reported are pathologists’ interpretations, which characterize these numbers (eg, + (ie, positive) or − (ie, negative)) relative to reference values. The fourth section is on cytogenetics, which records the presence of chromosomal aberrations such as translocations, insertions, and deletions, in the form of a ‘karyotype’ using a standardized nomenclature55 that is not natural language processing friendly. However, the accompanying ‘interpretation’ section describes these aberrations in narrative text. Dates and age etc are replaced with realistic surrogates for deidentification.
For this project, we focused on the following four lymphomas: diffuse large B-cell lymphoma (DLBCL; the most common lymphoma), Burkitt lymphoma (the most aggressive lymphoma), follicular lymphoma (the second most common lymphoma), and Hodgkin lymphoma (the most common lymphoma in young patients). We obtained our patient cases by having two MGH medical oncologists and one hematopathologist review pathology reports of patients diagnosed between 2000 and 2010, and collected 1038 cases in which the written diagnosis (in the final diagnoses section) has one or more of the four lymphomas.
Methods
We first preprocessed our corpus using sentence breaking, tokenization, and POS tagging, with customizations to medical corpora. We then performed a two-phase sentence-parsing step, grouping token subsequences that match concept unique identifiers (CUIs) in the Unified Medical Language System (UMLS) Metathesaurus16 as parsing units to Stanford Parser instead of individual tokens. For the UMLS CUI matching, we experimented with the entire set or subsets of CUIs and chose the following approach, which balances the coverage and accuracy on our data. If the token subsequence had only one CUI match, this CUI was used. If the token subsequence had multiple CUI matches, we selected the one supported by the most sources. If there was a tie, we preferred the CUI supported by Systematized Nomenclature of Medicine—Clinical Terms (SNOMED CT)37 if there was one, or flipped a coin otherwise. For Stanford Parser, we chose the lexicalized parser. We refer the reader to the online supplement for more details, and focus on the sentence subgraph framework.
Intuition on relations among concepts
In a corpus of pathology reports focusing on a specific disease, certain relations among medical concepts occur frequently. For example, figure 2 shows variations of immunohistochemistry interpretations, which describe ‘what kind of staining’ (bold-outline blocks) is observed with regard to ‘antibodies’ to ‘what type of antigens’ (dash-outline blocks). The relations among those concepts are what characterize the immunohistochemistry results. For example, in one pathology report, ‘B lineage antigens’ associate with ‘staining of most large atypical cells’, and ‘T lineage associated antigens’ associate with ‘staining of most small cells’. If we use only individual findings, it is difficult to exclude the other possibilities of association. For daily pathology practice, important relations are likely to be repeated in similar syntactic and semantic constructs. This motivated us to use a graph representation to capture concepts and relations expressed in a sentence, as well as to use frequent subgraph mining to identify important relations encoded by sentence subgraphs.
Figure 2.

A variety of sentences frequently occurring in our corpus describe the relations among cells, staining, and antigens/antibodies. Dash-outline blocks indicate ‘what type of antigens’; bold-outline blocks indicate ‘what kind of staining’.
Representing sentence-dependency parses as graphs
In natural language, the syntactic structure of a statement often corresponds at least approximately to the ways in which the semantic parts may be combined to aggregate the meaning of the overall statement.38 The two-phase sentence parsing (described in the online supplement) produces the dependency linkage structure of a sentence. This translates naturally to a graph representation of the relations, where the nodes are concepts, and the edges are syntactic dependencies among the concepts. We experimented with multiple parsers, including the augmented Stanford Parser (described in the online supplement),39 the Link Parser40 41 and the ClearParser.42 We chose the Stanford Parser because it produced fewer systemic errors on our corpus.
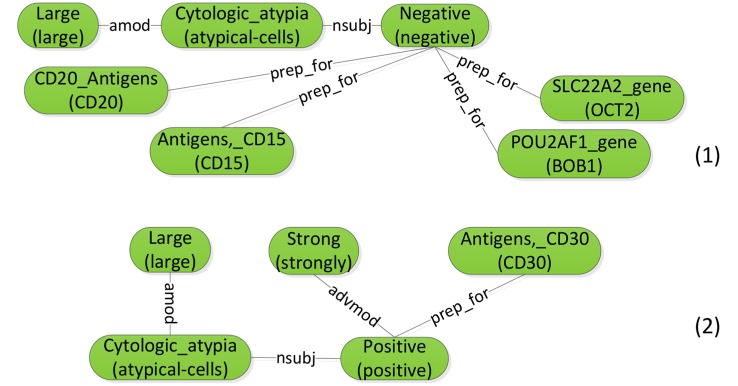
Figure 3 shows the graph representation for the example sentence ‘Immunostains show the large atypical cells are strongly positive for CD30 and negative for CD15, CD20, BOB1, OCT2 and CD3.’ Syntactic dependencies are denoted using line segments with labels (eg, prep_for). For each parse node (round-corner rectangle), the text in parentheses includes the tokens in the original sentence, connected by hyphens (eg, ‘atypical-cells’). The text above the parentheses displays the preferred name of the node's CUI (eg, CD20_Antigens for C0054946). For determiners, we exclude common functional determiners such as ‘a’, ‘an’ and ‘the’, but keep the semantically meaningful ones such as ‘no’ and ‘all’.
Figure 3.

Constructing the sentence graph from the results of two-phase dependency parsing.
The Stanford Parser supports various parsing modes. We also chose the mode with ‘collapsed dependencies with propagation of conjunct dependencies’,43 which has the most compact graph translations. With this mode, possible cyclic graphs can arise in the dependency linkages, such as the cycle in the middle of figure 3.
In order to increase the accuracy of the sentence graph representations, we performed post-processing on the Stanford dependency parsing results. The main observation is that a list of immunologic factors often poses a parsing challenge as in the sentence, ‘Most interstitial lymphocytes are CD3 positive T-cells with fewer CD20 and PAX5 positive B-cells’. Even if all the POS tags are correctly assigned, the parser still has difficulty in determining that ‘CD20’ and ‘PAX5’ are both connected to ‘positive’. The key idea is to treat such a list as one token in the parsing. We refer the reader to the online supplement for details and discussions on parse post-processing.
Frequent subgraph mining
Frequent subgraph mining is based on the notion of graph subisomorphism. Intuitively, one graph is subisomorphic to another graph if it is part of the other. Formally, let Gs=(Vs, Es, ls) and G=(V, E, l) be two graphs, where V (Vs) is the set of nodes, E (Es) is the set of edges, and l (ls) is the labeling function for nodes and edges. For Gs to be subisomorphic to G, the following conditions must be met: there exists a one-to-one mapping f such that:

∀v1, v2∈Vs, if (v1, v2)∈Es, then (f (v1), f (v2))∈E and ls (v1, v2)=l (f(v1), f(v2))
Condition 1 says that there exists a mapping from nodes in Gs to a subset of nodes in G, such that corresponding nodes agree on their labels. Condition 2 says that each edge in Gs should also have a counterpart in G that shares the same label. Figure 4 shows two example subgraphs of the sentence graph in figure 3.
Figure 4.
Example subgraphs for the sentence graph in figure 3.
We say that a subgraph occurs once in a corpus every time it is subisomorphic to a graph in that corpus. The frequency of a subgraph is the total number of its occurrences within the corpus. Frequent subgraph mining tries to identify those subgraphs whose frequencies are above a given threshold. Various graph encodings, enumeration strategies, and search pruning policies have been proposed to improve the efficiency of the mining algorithms.44 45 In this work, we used the open-source frequent subgraph miner, Gaston,46 which has state-of-the-art speed.
Pruning redundant subgraphs
We ran Gaston on our training dataset with 17 186 sentences, with a frequency threshold of 5, and obtained 180 863 frequent subgraphs. Analyzing these subgraphs, we found that many smaller subgraphs are subisomorphic to other larger frequent subgraphs. Many of these larger subgraphs have the same frequencies as their subisomorphic smaller subgraphs. This arises when a larger subgraph is frequent; all of its subgraphs also become frequent. Furthermore, if the smaller subgraph is so unique that it is not subisomorphic to any other larger subgraph, then this pair of larger and smaller subgraphs shares identical frequency. Therefore, we only kept the larger subgraphs in such pairs. Note that it is cost prohibitive to perform a full pairwise check because the subisomorphism comparison between two subgraphs is already nondeterministic polynomial time (NP)-complete,46 and a pairwise approach would ask for around 16 billion such comparisons for our dataset. We developed an efficient algorithm using hierarchical hash partitioning that reduces the number of subgraph pairs to compare by several orders of magnitude. The key idea is that we only need to compare subgraphs that differ in size by one, and we can further partition the subgraphs so that only those within the same partition need be compared. We refer the reader to the online supplement for technical details of this algorithm. After pruning redundant subgraphs, we are left with 9935 subgraphs.
Single-node frequent subgraph collection
Gaston only collects frequent subgraphs with two or more nodes. Because our token subsequence grouping may group all tokens within a short sentence into one node if they are covered by one CUI, such nodes would be ignored by Gaston. We do not want to exclude the possibility that sometimes the presence of a meaningful medical concept in the text can be informative. We thus also collected single-node subgraphs using the same frequency threshold 5 as for multinode frequent subgraphs, adding 1602 single-node subgraphs (11 537total).
Experiments and results
For each patient case, we used the written diagnosis (in the final diagnoses section of the pathology reports) as the ground truth label. A patient may have multiple lymphomas at the same time, or the diagnosis may be an intermediate case between multiple lymphomas. Given the relatively small numbers of multiple-hit/intermediate cases as shown in table 1, we modeled the classification task as multiple binary classification problems, one for each lymphoma. For the ground truth, the positive cases for one lymphoma type also include the multiple-hit/intermediate cases involving this type. The negative cases of one lymphoma type include positive cases of the other three types, except for multiple-hit/intermediate cases involving this type. Our task resembles the differential diagnosis of four lymphomas, assuming that every patient in the selected population has at least one lymphoma. By splitting the dataset randomly into halves, stratified by type of lymphoma, we obtained a training set and a testing set, whose statistics are in table 2.
Table 1.
Multiple-hit or intermediate lymphoma cases
| Type | No of cases | Percentage* |
|---|---|---|
| Intermediate between Burkitt and DLBCL | 18 | 1.7 |
| Intermediate between Burkitt and follicular | 2 | 0.2 |
| Double-hit of DLBCL and follicular | 42 | 4.0 |
| Intermediate between DLBCL and Hodgkin | 7 | 0.7 |
*Out of a total of 1038 cases.
DLBCL, diffuse large B-cell lymphoma.
Table 2.
Distribution of lymphoma cases in full corpus, training corpus, and testing corpus
| Full corpus | Training corpus | Testing corpus | |||||||
|---|---|---|---|---|---|---|---|---|---|
| Lymphoma | N | P | P % | N | P | P % | N | P | P % |
| Burkitt | 946 | 93 | 9.0 | 500 | 55 | 9.9 | 446 | 38 | 7.9 |
| DLBCL | 383 | 656 | 63.2 | 210 | 345 | 62.2 | 173 | 311 | 64.4 |
| Follicular | 811 | 228 | 22.0 | 425 | 130 | 23.4 | 386 | 98 | 20.3 |
| Hodgkin | 908 | 131 | 12.6 | 486 | 69 | 12.4 | 422 | 62 | 12.8 |
Note that in the full corpus, the number of positive cases does not add up to 1038 (the total number of patients); this is because there are patients with diagnoses for multiple/intermediate lymphomas.
DLBCL, diffuse large B-cell lymphoma; N, number of the negative patients; P, number of positive patients; P %, percentage of the positive patients.
In our experiments, we trained three baseline classifiers on different feature types. Baseline 1 uses negation-classified medical concepts extracted by the latest Metamap.16 Baseline 2 further filters the concepts in baseline 1 based on UMLS semantic types reported in previous studies to show good performance for medical problem extraction.47 48 In addition to previously used semantic categories of diseases and symptoms, we also included semantic types that fall under the hierarchy of ‘Chemical’ and ‘Anatomical Structure’ as our pathology reports largely concern the immunological factors and various types of lymphocytes. Baseline 3 uses the standard n-gram features,49 including unigrams, bigrams, and trigrams, which have been reported to be most useful for document classification.50 We experimented with multiple machine learning algorithms including support vector machine (SVM), decision trees, and Bayesian networks. We chose SVM for its better performance on our training data and its widely acknowledged generalizability. We experimented with polynomials up to degree five and radial basis functions as candidate kernels. We performed tenfold cross-validation on training data for parameter selection and evaluated the trained model on the held-out test dataset. Of note, cross-validation favored a linear kernel for all the settings in our experiment.
Table 3 shows the evaluation results on the subgraph features for each of the four lymphoma categories in comparison with the three baselines. The evaluation metrics include standard precision, recall, F-measure, and area under the receiver operating characteristic curve. It is clear that full MetaMap features outperform filtered MetaMap features. Thus we performed significance tests comparing the subgraph features with the full MetaMap features and with the n-gram features. We used the approximate randomization test51 to assess whether two system outputs were significantly different from each other (p=0.05), and the statistically significant changes in table 3 are marked. We see improvements on precision, recall, and F-measure across all four lymphomas compared with either baseline. For Burkitt lymphoma, all improvements are significant. For DLBCL, the improvement in recall over n-grams is not significant. For follicular lymphoma, all improvements over n-gram are significant; the improvement in recall over MetaMap is significant. For Hodgkin lymphoma, all improvements are significant except for the recall compared with n-gram features. Overall, the sentence subgraph features significantly outperform all three baselines.
Table 3.
Held-out test results on different feature groups
| Lymphoma | Full MetaMap* (3112) | Filtered MetaMap (1600) | n-gram† (16 326) | Sentence subgraph (11 537) | ||||||||||||
|---|---|---|---|---|---|---|---|---|---|---|---|---|---|---|---|---|
| class | P | R | F | AUC | P | R | F | AUC | P | R | F | AUC | P | R | F | AUC |
| Burkitt-N | 0.965 | 0.978 | 0.971 | 0.778 | 0.959 | 0.989 | 0.973 | 0.744 | 0.969 | 0.984 | 0.977 | 0.808 | 0.978 | 0.991 | 0.984 | 0.864 |
| Burkitt-P | 0.688 | 0.579 | 0.629 | 0.778 | 0.792 | 0.5 | 0.613 | 0.744 | 0.774 | 0.632 | 0.696 | 0.808 | 0.875*† | 0.737*† | 0.8*† | 0.864 |
| DLBCL-N | 0.703 | 0.634 | 0.667 | 0.743 | 0.714 | 0.523 | 0.604 | 0.704 | 0.829 | 0.703 | 0.761 | 0.812 | 0.87 | 0.779 | 0.822 | 0.857 |
| DLBCL-P | 0.808 | 0.852 | 0.829 | 0.743 | 0.77 | 0.884 | 0.823 | 0.704 | 0.849 | 0.92 | 0.883 | 0.812 | 0.884*† | 0.936* | 0.909*† | 0.857 |
| Follicular-N | 0.933 | 0.974 | 0.953 | 0.849 | 0.939 | 0.953 | 0.946 | 0.854 | 0.932 | 0.958 | 0.945 | 0.841 | 0.952 | 0.971 | 0.961 | 0.889 |
| Follicular-P | 0.877 | 0.724 | 0.793 | 0.849 | 0.804 | 0.755 | 0.779 | 0.854 | 0.816 | 0.724 | 0.768 | 0.841 | 0.878† | 0.806*† | 0.84† | 0.889 |
| Hodgkin-N | 0.963 | 0.995 | 0.979 | 0.869 | 0.952 | 0.988 | 0.97 | 0.825 | 0.97 | 0.988 | 0.979 | 0.889 | 0.977 | 1 | 0.988 | 0.919 |
| Hodgkin-P | 0.958 | 0.742 | 0.836 | 0.869 | 0.891 | 0.661 | 0.759 | 0.825 | 0.907 | 0.79 | 0.845 | 0.889 | 1*† | 0.839* | 0.912*† | 0.919 |
In the lymphoma class column, suffix ‘-N’ denotes negative cases and ‘-P’ denotes positive cases. P, precision; R, recall; F, F-measure; AUC, area under the receiver operating characteristic curve. Numbers in parentheses next to each feature group indicate the number of features in that group. Evaluation metrics for each positive class are in bold if they show significant improvements over baselines. Markers (*†) are used to indicate specific baselines.
DLBCL, diffuse large B-cell lymphoma.
We also assessed the effect of parse post-processing and the effect of detailed dependency types on the performance of sentence subgraph features. Table 4 shows different configurations in separate panels, in which ‘untyped dependency’ means that all dependencies are treated equally. Vertical comparisons show that post-processing in general helps to improve classification performance, with the exception of Burkitt lymphoma classification when the system uses typed dependencies. Horizontal comparisons show that distinguishing dependency types in general does not improve classification performance. In particular, with post-processing, untyped dependencies even help to improve the F-measures for Burkitt, DLBCL, and follicular lymphoma classifications. There are two possible reasons. First, the Stanford Parser dependency types may distinguish relations between concepts in unnecessary detail. For example, the partial sentences ‘B-cells with CD10 expression’ (B-cells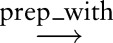 expression
 CD10) and ‘B-cells expressing CD10’ (B-cells
 expressing
 CD10) have different syntactic parses but convey almost the same information to pathologists. In addition, parser errors during dependency type assignment could introduce noise, which diminishes the usefulness of the dependency types.
Table 4.
Held-out test results on different settings of sentence subgraph feature groups
| Lymphoma | No post-processing, typed dependency (7491) | No post-processing, untyped dependency (8548) | ||||||
|---|---|---|---|---|---|---|---|---|
| class | P | R | F | AUC | P | R | F | AUC |
| Burkitt-N | 0.978 | 0.984 | 0.981 | 0.861 | 0.978 | 0.984 | 0.981 | 0.861 |
| Burkitt-P | 0.8 | 0.737 | 0.767 | 0.861 | 0.8 | 0.737 | 0.767 | 0.861 |
| DLBCL-N | 0.819 | 0.762 | 0.789 | 0.834 | 0.868 | 0.767 | 0.815 | 0.852 |
| DLBCL-P | 0.873 | 0.907 | 0.890 | 0.834 | 0.879 | 0.936 | 0.907 | 0.852 |
| Follicular-N | 0.942 | 0.971 | 0.957 | 0.868 | 0.937 | 0.971 | 0.954 | 0.858 |
| Follicular-P | 0.872 | 0.765 | 0.815 | 0.868 | 0.869 | 0.745 | 0.802 | 0.858 |
| Hodgkin-N | 0.977 | 0.990 | 0.983 | 0.915 | 0.974 | 0.993 | 0.984 | 0.908 |
| Hodgkin-P | 0.929 | 0.829 | 0.881 | 0.915 | 0.944 | 0.823 | 0.879 | 0.908 |
| Lymphoma | Post-processing, typed dependency (9488) | Post-processing, untyped dependency (11 537) | ||||||
| class | P | R | F | AUC | P | R | F | AUC |
| Burkitt-N | 0.969 | 0.989 | 0.979 | 0.810 | 0.978 | 0.991 | 0.984 | 0.864 |
| Burkitt-P | 0.828 | 0.632 | 0.716 | 0.810 | 0.875 | 0.737 | 0.8 | 0.864 |
| DLBCL-N | 0.86 | 0.75 | 0.801 | 0.841 | 0.87 | 0.779 | 0.822 | 0.857 |
| DLBCL-P | 0.871 | 0.932 | 0.901 | 0.841 | 0.884 | 0.936 | 0.909 | 0.857 |
| Follicular-N | 0.943 | 0.979 | 0.961 | 0.872 | 0.952 | 0.971 | 0.961 | 0.889 |
| Follicular-P | 0.904 | 0.765 | 0.829 | 0.872 | 0.878 | 0.806 | 0.84 | 0.889 |
| Hodgkin-N | 0.979 | 0.998 | 0.988 | 0.926 | 0.977 | 1 | 0.988 | 0.919 |
| Hodgkin-P | 0.981 | 0.855 | 0.914 | 0.926 | 1 | 0.839 | 0.912 | 0.919 |
In the lymphoma class column, suffix ‘-N’ denotes negative cases and ‘-P’ denotes positive cases. P, precision; R, recall; F, F-measure; AUC, area under the receiver operating characteristic curve. Numbers in parentheses next to each feature group indicate the number of features in that group.
DLBCL, diffuse large B-cell lymphoma.
Feature and error analysis
This section investigates the ability of a sentence subgraph to assist with human review by providing insightful relations over a flexible number of medical concepts. The sentence subgraph features outperform all three baselines, and n-gram seems to be the best baseline overall. A closer look at the MetaMap baseline shows that the program did not identify some important immunologic factors, such as CD30, CD15 etc. By contrast, n-gram features cover the entire text, but often do not map to medical concepts. To compare subgraph features with the baselines, we identified in the training corpus cases that are false negatives for the n-gram baseline and the MetaMap baseline but not for the sentence subgraph features during cross-validation. We then identified the big subgraphs (≥3 nodes), which contribute to the improved recognition of the three minority lymphomas, by choosing those with a normalized weight above 0.01 as assigned by a linear kernel SVM. For Burkitt lymphoma, examples of interesting positive factors include:
| bf1 ‘… with antibodies to immunoglobulin, … there is monotypic … kappa staining of most tumor cells … ’ |
| bf2 ‘… b-cells … negative for BCL2 … positive for BCL6 …’ |
| bf3 ‘… CD19+, CD20+, CD10+, CD5−, CD23−, CD43+ … B cells with monotypic expression of kappa light chain … ’ |
| bf4 ‘ … tumor cell is positive for CD10 …’ |
For readability, we translated each subgraph into a partial sentence. Note that in bf3, although we have listed ‘CD19+, CD20+, CD10+, CD5−, CD23−, CD43+’ in order, when viewed in the subgraph, individual immunologic factors are all adjective modifiers of ‘B cells’, hence the subgraph is order ignorant. The factors bf1, bf2, bf3, and bf4 are consistent with immunophenotypic characteristics of Burkitt lymphoma in the WHO classification,6 which states that the tumor cells are light-chain-restricted with moderate to strong expression of pan-B-cell (CD19, CD20) and germinal center (BCL6 and CD10) antigens, and are negative for CD5 and CD23.
For follicular lymphoma, examples of positive factors that are exclusively discovered by sentence subgraph features are as follows. The factors ff1, ff2, and ff3 are consistent with table 8.01 in Swerdlow et al,6 as CD10 is usually positive and CD23 is intermittently positive on B cells in follicular lymphoma.
| ff1 ‘… CD20+, CD10dim, CD5−, CD23− … B cells ...’ |
| ff2 ‘… CD20+, CD10dim, CD5−, CD43− … B cells ...’ |
| ff3 ‘… CD19+, CD20+, CD23+ … B cells with … expression of lambda light chain …’ |
One might think that Hodgkin lymphoma cases should be easy to classify because of the presence of Reed–Sternberg cells as a well-recognized diagnostic feature. However, our analysis shows that the paucity of neoplastic Reed–Sternberg cells and the predominance of non-neoplastic cells lead to interesting associations between sentence subgraphs and Hodgkin lymphoma. In particular, we found the following positive factors discovered by sentence subgraph features.
| hf1 ‘… atypical large cells … positive for … CD30 …’ |
| hf2 ‘… with antibodies to B lineage … antigens … there is staining of many … cells …’ |
| hf3 ‘… with antibodies to T lineage associated antigen … there is staining of … cells …’ |
The factor hf1 links CD30-expressing atypical large cells to Hodgkin lymphoma and conforms to conventional knowledge.6 The factors hf2 and hf3 refer to staining patterns of background T and B cells. Although hf2 and hf3 are seen to some extent in other lymphoma subtypes, Hodgkin lymphoma is particularly rich in background non-neoplastic T cells, as well as B cells to a lesser extent, and these non-neoplastic cells vastly outnumber the neoplastic Reed–Sternberg cells.6 Together with other Hodgkin-related subgraph features such as hf1 or Reed–Sternberg cells, hf2 and hf3 appear to account for these non-neoplastic cells. Our classifier placed higher weight on hf3 than on hf2, agreeing with the aforementioned T-cell dominance. Of note, some work has shown varying patterns of morphology and immunophenotype in background non-neoplastic cells associated with a certain subtype of Hodgkin lymphoma,52–54 pointing to the potential utility of our analysis in identifying variant patterns of lymphoma.
Of the four lymphomas, follicular lymphoma has a moderate number of cases but a lower F-measure than DLBCL and Hodgkin lymphoma. We thus delved into false negative cases of follicular lymphoma in the training data and selected common features that have top negative weights as assigned by the linear kernel SVM. Investigating those common features, we highlighted the following:
| fnf1 ‘… large …’ |
| fnf2 ‘… erythroid maturation is normal …’ |
| fnf3 ‘… myeloid maturation is normal …’ |
The factor fnf1 incorrectly associates the single-node subgraph ‘large’ with negative classification of follicular lymphoma. In the description of a morphological study, ‘large’ often describes the cell size. Although the keyword corresponds to the name of DLBCL (diffuse large B cell lymphoma), it is, however, not a distinguishing feature, because a Hodgkin Reed–Sternberg cell can be large, and centroblasts in follicular lymphoma can be large. Similarly the keyword ‘diffuse’ and ‘follicular’ are also not special to DLBCL and follicular lymphoma, respectively. Although our model successfully excluded ‘diffuse’ from the top negative features for follicular lymphoma, it incorrectly included ‘large’. We reason that this is because we have a majority of DLBCL cases, which do frequently have the keyword ‘large’, and the imbalanced ratio between DLBCL and follicular lymphoma confused our model. The factors fnf2 and fnf3 refer to erythroid and myeloid maturation, respectively, which in reality are neither positively nor negatively associated with the likelihood of follicular lymphoma. We think this is identified by the classifier because lymphoma patients often undergo a staging bone marrow biopsy in which myeloid and erythroid maturation are routinely assessed during the process of determining whether the marrow is involved by lymphoma. As a result, normal myeloid and erythroid maturation is frequently associated with most cases. Because there are more follicular lymphoma cases with uninvolved staging bone marrow biopsies than those with involved biopsies, such association could be regarded by the classifier as favoring negative classification of follicular lymphoma.
Discussion and future work
Some clinical reports are template based. In fact, our pathology reports also have template-based sections. For example, there are disclaimers such as ‘By his/her signature below, the pathologist listed as making the Final Diagnosis certifies that he/she has personally reviewed this case and confirmed or corrected the diagnoses.’ We exclude these sentences from being processed as they do not offer clinical insights. Recognition of these sections is based on knowledge from electronic medical record vendors about prespecified templates.
Patient demographics such as gender and age are usually mentioned in the clinical presentation section. They are also part of the features captured by subgraphs. For the age features, expressions such as ‘year-old’ are connected to the integers that we discretize by every 10 years. However, we did not find demographics ranked as top-weighted features in our experiments. This is likely due to the presence of more specific predictors such as morphologic, immunophenotypic, and genetic features, although we do not exclude the possibility that a better customized discretization can yield a different outcome.
In addition, we note that different institutions may have different clinical documentation systems and styles, which may bring challenges to generalizing our framework to multiple institutions. We expect that the untyped dependencies will help mitigate some style (eg, syntactic) differences between institutions. We also expect that the UMLS concept mapping will lessen the impact of the terminology differences between institutions. We are in fact expanding the lymphoma classification project across institutions, and generalizability analysis is part of our future work.
Our work is predicated on the assumption that pathology reports provide a comprehensive statement of measurements, observations, and interpretations made by pathologists. This seems to be true of current practice, but future programs may have access to digital images of immunohistochemical slides and raw flow cytometry counts directly from instruments. Nevertheless, we expect that, for the foreseeable future, pathologists’ observations and interpretations will continue to be expressed in natural language, hence the techniques we report here will continue to be helpful.
We expect to scale up our tool to assist with human expert reviews and more systematically identify unique variants and new subcategories of lymphoma, whose recognition, diagnosis, and acceptance into the widely used classification system is important for patients to receive appropriate treatment and follow-up and to further our understanding of lymphoma biology.
Conclusions
We have narrowed the gap between automatic unsupervised feature generation and interpretable feature generation from clinical narrative text by building a framework that can perform unsupervised extraction of relations among a flexible number of medical concepts. Our framework represents narrative sentences in pathology reports as graphs, and automatically mines sentence subgraphs for feature generation. We performed a lymphoma classification task resembling differential diagnosis, in which no explicit mentions or synonyms of the targeted lymphomas are available to the classifier. Evaluation shows that the classifier with unsupervised sentence subgraph features significantly outperforms the baselines using standard n-grams, full MetaMap concepts, or filtered MetaMap concepts. With detailed feature analysis, we highlight that our system generates meaningful features and medical insights into lymphoma classification.
Supplementary Material
Footnotes
Contributors: YL is the primary author and was instrumental in designing and developing the work and performed data analyses. ARS reviewed most of the patient cases for ground truth, provided expertise in pathology, and reviewed and edited the manuscript. PS and EPH are the principal investigators for the grants involving the secondary use of clinical data. PS provided expertise in machine learning, data analysis, and reviewed and edited the manuscript. EPH also contributed to case review for ground truth, provided expertise in pathology and oncology, and edited the manuscript.
Funding: The work described was supported in part by Grant Number U54LM008748 from the National Library of Medicine and by the Scullen Center for Cancer Data Analysis. The content is solely the responsibility of the authors and does not necessarily represent the official views of the National Library of Medicine or the National Institutes of Health.
Competing interests: None.
Ethics approval: The institutional review boards governing oncology care at the Massachusetts General Hospital approved this study. A waiver of informed consent was obtained.
Provenance and peer review: Not commissioned; externally peer reviewed.
References
- 1.Robb-Smith A. US National Cancer Institute working formulation of non-Hodgkin's lymphomas for clinical use. Lancet 1982;320:432–4 [DOI] [PubMed] [Google Scholar]
- 2.Bennett M, Farrer-Brown G, Henry K, et al. Classification of non-Hodgkin's lymphomas. Lancet 1974;304:405–8 [Google Scholar]
- 3.Lukes RJ, Collins RD. Immunologic characterization of human malignant lymphomas. Cancer 1974;34:1488–503 [DOI] [PubMed] [Google Scholar]
- 4.Rappaport H. Tumors of the hematopoietic system. Armed Forces Institute of Pathology, 1966 [Google Scholar]
- 5.Jaffe ES, Harris NL, Stein H, Vardiman J, eds WHO classification of tumours. Pathology and genetics of tumours of haematopoietic and lymphoid tissues. IARC Press, 2001 [Google Scholar]
- 6.Swerdlow SH, Campo E, Harris NL, et al., eds WHO classification of tumours of haematopoietic and lymphoid tissues. IARC Press, 2008 [Google Scholar]
- 7.Turner J, Hughes A, Kricker A, et al. Use of the WHO lymphoma classification in a population-based epidemiological study. Ann Oncol 2004;15:631–7 [DOI] [PubMed] [Google Scholar]
- 8.Clarke CA, Glaser SL, Dorfman RF, et al. Expert review of non-Hodgkin's lymphomas in a population-based cancer registry reliability of diagnosis and subtype classifications. Cancer Epidemiol Biomarkers Prev 2004;13:138–43 [DOI] [PubMed] [Google Scholar]
- 9.Snuderl M, Kolman OK, Chen Y-B, et al. B-cell lymphomas with concurrent IGH-BCL2 and MYC rearrangements are aggressive neoplasms with clinical and pathologic features distinct from Burkitt lymphoma and diffuse large B-cell lymphoma. Am J Surg Pathol 2010;34:327–40 [DOI] [PMC free article] [PubMed] [Google Scholar]
- 10.Gruver AM, Huba MA, Dogan A, et al. Fibrin-associated large B-cell lymphoma: part of the spectrum of Cardiac lymphomas. Am J Surg Pathol 2012;36: 1527–37 [DOI] [PubMed] [Google Scholar]
- 11.Savage KJ, Harris NL, Vose JM, et al. ALK- anaplastic large-cell lymphoma is clinically and immunophenotypically different from both ALK+ ALCL and peripheral T-cell lymphoma, not otherwise specified: report from the International Peripheral T-Cell Lymphoma Project. Blood 2008;111:5496–504 [DOI] [PubMed] [Google Scholar]
- 12.Hsi E, Singleton T, Swinnen L, et al. Mucosa-associated lymphoid tissue-type lymphomas occurring in post-transplantation patients. Am J Surg Pathol 2000;24:100–6 [DOI] [PubMed] [Google Scholar]
- 13.Ferry JA, Sohani AR, Longtine JA, et al. HHV8-positive, EBV-positive Hodgkin lymphoma-like large B-cell lymphoma and HHV8-positive intravascular large B-cell lymphoma. Mod Pathol 2009;22:618–26 [DOI] [PubMed] [Google Scholar]
- 14.Liao KP, Cai T, Gainer V, et al. Electronic medical records for discovery research in rheumatoid arthritis. Arthritis Care Res 2010;62:1120–7 [DOI] [PMC free article] [PubMed] [Google Scholar]
- 15.Savova GK, Masanz JJ, Ogren PV, et al. Mayo clinical Text Analysis and Knowledge Extraction System (cTAKES): architecture, component evaluation and applications. J Am Med Inform Assoc 2010;17:507–13 [DOI] [PMC free article] [PubMed] [Google Scholar]
- 16. Aronson AR. Effective Mapping of Biomedical Text to the UMLS Metathesaurus: The MetaMap Program. AMIA Annu Symp Proc 2001;2001:17–21. [PMC free article] [PubMed]
- 17.Uzuner Ö, Goldstein I, Luo Y, et al. Identifying patient smoking status from medical discharge records. J Am Med Inform Assoc 2008;15:14–24 [DOI] [PMC free article] [PubMed] [Google Scholar]
- 18.Uzuner Ö, Luo Y, Szolovits P. Evaluating the state-of-the-art in automatic de-identification. J Am Med Inform Assoc 2007;14:550–63 [DOI] [PMC free article] [PubMed] [Google Scholar]
- 19.Uzuner Ö. Recognizing obesity and comorbidities in sparse data. J Am Med Inform Assoc 2009;16:561–70 [DOI] [PMC free article] [PubMed] [Google Scholar]
- 20.Cohen AM. Five-way smoking status classification using text hot-spot identification and error-correcting output codes. J Am Med Inform Assoc 2008;15:32–5 [DOI] [PMC free article] [PubMed] [Google Scholar]
- 21.Aramaki E, Imai T, Miyo K, et al. Patient status classification by using rule based sentence extraction and BM25 kNN-based classifier. i2b2 Workshop on Challenges in Natural Language Processing for Clinical Data, 2006 [Google Scholar]
- 22.Clark C, Good K, Jezierny L, et al. Identifying smokers with a medical extraction system. J Am Med Inform Assoc 2008;15:36–9 [DOI] [PMC free article] [PubMed] [Google Scholar]
- 23.Solt I, Tikk D, Gál V, et al. Semantic classification of diseases in discharge summaries using a context-aware rule-based classifier. J Am Med Inform Assoc 2009;16:580–4 [DOI] [PMC free article] [PubMed] [Google Scholar]
- 24.Farkas R, Szarvas G, Hegedűs I, et al. Semi-automated construction of decision rules to predict morbidities from clinical texts. J Am Med Inform Assoc 2009;16:601–5 [DOI] [PMC free article] [PubMed] [Google Scholar]
- 25.Childs LC, Enelow R, Simonsen L, et al. Description of a rule-based system for the i2b2 challenge in natural language processing for clinical data. J Am Med Inform Assoc 2009;16:571–5 [DOI] [PMC free article] [PubMed] [Google Scholar]
- 26.Ware H, Mullett CJ, Jagannathan V. Natural language processing framework to assess clinical conditions. J Am Med Inform Assoc 2009;16:585–9 [DOI] [PMC free article] [PubMed] [Google Scholar]
- 27.Chapman WW, Bridewell W, Hanbury P, et al. A simple algorithm for identifying negated findings and diseases in discharge summaries. J Biomed Inform 2001;34:301–10 [DOI] [PubMed] [Google Scholar]
- 28.Hristovski D, Friedman C, Rindflesch TC, et al. Exploiting semantic relations for literature-based discovery. AMIA Annu Symp Proc 2006;2006:349–53 [PMC free article] [PubMed] [Google Scholar]
- 29.Xu H, Stenner SP, Doan S, et al. MedEx: a medication information extraction system for clinical narratives. J Am Med Inform Assoc 2010;17:19–24 [DOI] [PMC free article] [PubMed] [Google Scholar]
- 30.Rindflesch TC, Fiszman M. The interaction of domain knowledge and linguistic structure in natural language processing: interpreting hypernymic propositions in biomedical text. J Biomed Inform 2003;36:462–77 [DOI] [PubMed] [Google Scholar]
- 31.Uzuner O, Mailoa J, Ryan R, et al. Semantic relations for problem-oriented medical records. Artif Intell Med 2010;50:63–73 [DOI] [PMC free article] [PubMed] [Google Scholar]
- 32.Huang Y, Lowe HJ, Klein D, et al. Improved identification of noun phrases in clinical radiology reports using a high-performance statistical natural language parser augmented with the UMLS specialist lexicon. J Am Med Inform Assoc 2005;12:275–85 [DOI] [PMC free article] [PubMed] [Google Scholar]
- 33.Sibanda T, He T, Szolovits P, et al. Syntactically-informed semantic category recognizer for discharge summaries. AMIA Annu Symp Proc 2006;2006: 714–18 [PMC free article] [PubMed] [Google Scholar]
- 34.Albright D, Lanfranchi A, Fredriksen A, et al. Towards comprehensive syntactic and semantic annotations of the clinical narrative. J Am Med Inform Assoc 2013;20:922–30 [DOI] [PMC free article] [PubMed] [Google Scholar]
- 35.National Library of Medicine. MeSH. http://www.ncbi.nlm.nih.gov/mesh [DOI] [PubMed]
- 36.Partners Healthcare. RPDR. http://rc.partners.org/rpdr
- 37.IHTSDO. SNOMED CT. http://www.ihtsdo.org/snomed-ct/
- 38.De Marneffe M-C, MacCartney B, Manning CD. Generating typed dependency parses from phrase structure parses. Proceedings of LREC, 2006, vol. 6, 449–54 [Google Scholar]
- 39.Stanford NLP. Stanford Parser. http://nlp.stanford.edu:8080/parser/
- 40.Sleator DD, Temperley D. “Parsing English with a link grammar,” arXiv preprint cmp-lg/9508004, 1995.
- 41.AbiWord. Link Parser. http://www.abisource.com/projects/link-grammar/
- 42.Choi JD, Palmer M. Getting the Most out of Transition-based Dependency Parsing. ACL (Short Papers), 2011:687–92
- 43.De Marneffe M-C, Manning CD. 2008 Stanford typed dependencies manual. [Google Scholar]
- 44.Chi Y, Muntz RR, Nijssen S, et al. Frequent subtree mining-an overview. Fundamenta Informaticae 2005;66:161–98 [Google Scholar]
- 45.Jiang C, Coenen F, Zito M. A Survey of Frequent Subgraph Mining Algorithms. Knowledge Engineering Review, vol. (To appear:), 2013;75–105
- 46.Nijssen S, Kok JN. The Gaston tool for frequent subgraph mining. Electron Notes Theor Comput Sci 2005;127:77–87 [Google Scholar]
- 47.Goldstein I, Uzuner Ö. Specializing for predicting obesity and its co-morbidities. J Biomed Inform 2009;42:873–86 [DOI] [PMC free article] [PubMed] [Google Scholar]
- 48.Long W. Extracting diagnoses from discharge summaries. AMIA Annu Symp Proc 2005;2005:470–4 [PMC free article] [PubMed] [Google Scholar]
- 49. Cavnar WB, Trenkle JM. N-Gram-Based Text Categorization. Proceedings of SDAIR-94, 3rd Annual Symposium on Document Analysis and Information Retrieval, 1994, pp 161–75.
- 50.Baeza-Yates R, Ribeiro-Neto B, et al. Modern information retrieval, vol. 463 1999 [Google Scholar]
- 51.Noreen EW. Computer-intensive methods for testing hypotheses: an introduction. Wiley, 1989 [Google Scholar]
- 52.Fan Z, Natkunam Y, Bair E. Characterization of variant patterns of nodular lymphocyte predominant Hodgkin lymphoma with immunohistologic and clinical correlation. Am J Surg Pathol 2003;27:1346–56 [DOI] [PubMed] [Google Scholar]
- 53.Rahemtullah A, Reichard KK, Preffer FI, et al. A double-positive CD4+ CD8+ T-cell population is commonly found in nodular lymphocyte predominant Hodgkin lymphoma. Am J Clin Pathol 2006;126:805–14 [DOI] [PubMed] [Google Scholar]
- 54.Sohani AR, Jaffe ES, Harris NL, et al. Nodular lymphocyte-predominant Hodgkin lymphoma with atypical T cells: a morphologic variant mimicking peripheral T-cell lymphoma. Am J Surg Pathol 2011;35:1666–78 [DOI] [PMC free article] [PubMed] [Google Scholar]
- 55.Shaffer LG, Tommerup N. ISCN 2013: an international system for human cytogenetic nomenclature (2013) : recommendations of the International Standing Committee on Human Cytogenetic Nomenclature. Karger, 2013
Associated Data
This section collects any data citations, data availability statements, or supplementary materials included in this article.