

Abstract
Importance
This study assessed whether stronger school meal nutrition standards may improve student weight status. Results have immediate implications because of the ongoing implementation of new nutrition standards for the National School Lunch Program.
Objective
To determine if state laws with stricter school meal nutrition standards are inversely associated with adolescent weight status, while controlling for unmeasured state-level confounders.
Design
Quasi-experiment.
Setting
Public schools.
Participants
Four thousand eight hundred seventy eighth-grade students in 40 states. Students were categorized by type of school lunch they usually obtained (free/reduced price, regular price, or none).
Interventions
State laws governing school meal nutrition standards. States with standards that exceeded US Department of Agriculture (USDA) school meal standards were compared with states that did not exceed USDA standards. The parameter of interest was the interaction between state laws and student lunch participant status, ie, whether disparities in weight status between school lunch participants and nonparticipants were smaller in states with stricter standards.
Main Outcome Measures
Body mass index percentile and obesity status.
Results
In states that exceeded USDA standards, the difference in obesity prevalence between students who obtained free/reduced-price lunches and students who did not obtain school lunches was 12.3 percentage points smaller (95% CI, −21.5 to −3.0) compared with states that did not exceed USDA standards. Likewise, differences in mean body mass index percentile between those student populations were 11 units smaller in states that exceeded USDA standards (95% CI, −17.7 to −4.3). There was little evidence that students compensated for school meal laws by purchasing more sweets, salty snacks, or sugar-sweetened beverages from other school venues (eg, vending machines) or other sources (eg, fast food).
Conclusions and Relevance
Stringent school meal standards that reflect the latest nutrition science may improve weight status among school lunch participants, particularly those eligible for free/reduced-price lunches.
The National School Lunch Program (NSLP) was established in 1946 to improve students’ nutritional intake by providing school meals in accordance with standards set by the US Department of Agriculture (USDA). Since then, the NSLP has grown to be an integral component of the diet of school-aged children throughout the United States. On an average day in the 2010-2011 school year, nearly 32 million children in the United States received NSLP lunches,1 and the program provides free and reduced-price lunches to students who qualify based on their household income.
The program has faced criticism, however, after several independent studies reported that NSLP lunches did not meet the USDA nutrient-based standards.2-6 Some studies also suggested that students’ participation in the NSLP was positively associated with weight gain or risk of obesity.7-10 The association between NSLP participation and obesity is likely due to selection bias11-13 because the NSLP is inherently designed to benefit low-income children, who are at a higher risk of becoming obese.14 Nonetheless, the NSLP may be a missed opportunity to improve participants’ weight status and reduce the health consequences of obesity.15
The USDA recently updated school meal nutrition standards, based on the most recent Dietary Guidelines for Americans, in accordance with the Child Nutrition and WIC Reauthorization Act of 2004.16 New standards were released in January 2012 and include increases in the number and variety of fruits, vegetables, and whole grains; reductions in trans fat content; and limits on calories per meal.17 Prior to these updates, some states had codified laws that exceeded previous USDA standards and included provisions similar to 2012 standards. Variation in state laws presents an opportunity to assess whether updated federal school meal standards have the potential to reduce childhood obesity or, conversely, if there are unintended consequences of which schools must be cognizant.
Estimating the causal effect of state laws is methodologically challenging because laws are not randomly assigned. As Harper et al18 illustrated in a recent study on state medical marijuana laws, states with varying laws differ with respect to unmeasured characteristics that may bias results if they are associated with the outcome of interest. An example would be states enacting school meal laws because they have higher obesity prevalence. Clinical epidemiology studies face a similar challenge when patients are prescribed a treatment because they are sicker, making it appear as though treatment is associated with poor health.19 It can create the appearance that interventions have a negative impact unless investigators design a study to control for such characteristics.
This observational study sought to assess whether state school meal laws that contained provisions similar to 2012 USDA standards were inversely associated with student weight status. We used a quasi-experimental design to control for state characteristics that would bias a conventional cross-sectional analysis. We also explored whether school meal laws were associated with increased consumption of foods and beverages in other venues (eg, school vending machines), as an unintended consequence. Such “competitive foods” are not currently subject to NSLP guidelines, tend to be unhealthy, and have been widely available in schools.5,6,20 Competitive foods are not targeted by school meal laws but may be indirectly affected if students compensate for school meal nutrition standards by obtaining unhealthy foods elsewhere.21,22
METHODS
STATE LAWS
Codified state statutory and administrative (ie, regulatory) laws governing school meals were compiled as part of the Bridging the Gap research program.23 Laws were obtained from the West-law and LexisNexis legal research databases using primary legal research methods, including a combination of Boolean key word searches of the full text and reviews of the tables of contents and indices of statutory and administrative codes.24 Laws were double-coded by 2 trained, master-level coders and verified against secondary-source state law data to ensure complete collection and coding interpretation.25-29 For these variables, the interrater agreement was 99% accurate; the 1% discrepancy is for a random miss by 1 reviewer.
For purposes of this study, states were classified based on whether laws applicable at the middle-school level for the 2006-2007 school year contained nutrition standards that exceeded USDA standards at the time (which had not been updated since 1995.) States that exceeded USDA standards did so by encouraging or requiring a specific number of fruits/vegetables; that at least half of all grains sold/served were whole grains; reductions in products that contain trans fats; and/or restrictions on milk to 1% or skim milk. These provisions were among the school meal provisions that the USDA announced in January 2012.17 Examples of laws are provided in the eAppendix (http://www.jamapeds.com).
STUDENT SAMPLE
Student data were obtained from the Early Childhood Longitudinal Study, Kindergarten Class (ECLS-K).30 The ECLS-K is a cohort study that began collecting data from a nationally representative sample of kindergarten students in fall 1998 and studied them through 7 rounds of data collection. The law data were merged to individual-level ECLS-K data based on state-level geocode identifiers obtained under special agreement. States cannot be listed because of data license restrictions. Analyses in this study used only student data collected in spring 2007, when most students were in eighth grade, because the law data represented the 2006-2007 school year. This study was approved by the institutional review board of the University of Illinois at Chicago.
Among the 7050 public school students who participated in ECLS-K in 2007, 2180 were excluded from this study because their principal reported that no students participated in lunch programs (n=40), they resided in a state with fewer than 5 observations (n=10), or they were missing data on school lunch programs (n=150), height or weight (n=440), lunch participation (n=770), or covariates (n=770). The study sample included 4870 students in 40 states. Missing data were equally common in states with different school meal laws but more common among boys, racial/ethnic minorities, and students who resided in urban areas, were of low socioeconomic status (SES), or were obese (P < .05).
The primary outcomes of interest were body mass index (BMI) percentile and obesity status. Body mass index percentile measures each student’s BMI relative to a reference population composed of children of the same age and sex in the United States to account for developmental differences between boys and girls of different ages.31 Body mass index was calculated from height and weight data obtained by ECLS-K staff using a Shorr board and digital scale, respectively (BMI was calculated as weight in kilograms divided by height in meters squared). Students were categorized as obese if their BMI was greater than or equal to the age- and sex-specific 95th percentile of the 2000 Centers for Disease Control and Prevention growth charts.31
SURVEY DATA
Other ECLS-K data used in this study were obtained through interviews with parents/guardians and questionnaires completed by students in class. Parents reported whether their child obtained lunch at school and, if so, whether they were eligible for a free/reduced-price lunch. Parents also reported their education, occupation, and household income and their child’s race/ethnicity. Students reported several diet behaviors including in-school purchasing of sweets, salty snacks, and sugar-sweetened beverages (SSBs); fast food consumption; and overall SSB consumption. Each dietary variable was measured by asking students to report how many times they purchased/consumed each food/beverage group in the past week. Several examples of sweets, salty snacks, and SSBs were provided in the questionnaire. Students also reported several measures of physical activity including hours of television watched per day and days of physical activity in the past week.
STATISTICAL ANALYSES
All analyses used generalized estimating equations with an exchangeable correlation matrix and identity link to control for state-level clustering. Analyses were conducted using Stata version 11 (StataCorp).
Generalized estimating equation models were designed to estimate the association between laws and differences in the outcomes of interest (eg, probability of obesity) between students who obtain lunch at school and those who do not, ie, the parameter of interest was the interaction between state law and student lunch participant status. We focused on this interaction, not the main effect of state law, for 2 reasons: (1) to assess whether stronger laws are associated with smaller disparities in weight status between school lunch participants and nonparticipants and (2) the interaction provides a less biased estimate of the effect of state laws. As discussed earlier, comparing states with laws to states without laws does not provide a valid estimate of the causal effect due to unmeasured differences between comparison groups. The interaction between laws and student lunch participant status, conversely, is less likely to be confounded by state characteristics such as obesity prevalence or competitive food laws that are common to all students. Students who do not obtain lunch at school essentially serve as a secondary control group, or a proxy of what students who are exposed to strong laws would have experienced had they not been exposed, because these 2 groups are otherwise exposed to many of the same state characteristics.32
Hours of television watched per day and days of physical activity were included as covariates to control for the possibility of selection bias, which could occur if healthier school meal standards attract students who generally engage in healthy weight-related behaviors. Models also controlled for race/ethnicity, sex, school locale (suburban vs nonsuburban), and an SES index that included data on parental education, parental occupation, and household income.30
As described earlier, a secondary objective was to assess whether students compensated for stringent school meal standards by purchasing more foods and beverages from other venues. All models were reestimated using fast food consumption, SSB consumption, and in-school purchasing of sweets, salty snacks, and SSBs as outcomes.
RESULTS
Students who received free/reduced-price lunches tended to be of lower SES, were less likely to be non-Hispanic white, and were less likely to live in suburban areas than students who purchased full-price lunches at school or those who did not obtain lunch at school (Table 1). The differences between the latter 2 groups were smaller, but the distribution of SES was slightly higher for students who did not obtain lunch at school (eg, 37.8% were in the upper SES quintile, compared with 24.9% of students who purchased lunch at school). Students in states that exceeded USDA standards were more likely to be Hispanic, of a lower SES, and located in suburban areas than students in states without such laws. States that exceeded USDA standards had slightly higher mean obesity prevalence (age 10-17 years) and poverty rate but also had higher median income and higher percentage of adults with a bachelor degree. The exact number of states in each category cannot be reported because of data license restrictions.
Table 1.
Descriptive Statistics by Students’ School Lunch Participant Status and State Law Regarding School Meal Nutrition Content
| Overall | Lunch Participant Status
|
State Law
|
||||
|---|---|---|---|---|---|---|
| None | Full-Price | Freea | Adhered to USDA Standards | Exceeded USDA Standards | ||
| Student variables | ||||||
| Sample size | 4870 | 950 | 2350 | 1570 | 4270 | 600 |
| Female, % | 50.6 | 59.0 | 47.1 | 50.7 | 51.0 | 47.4 |
| Race/ethnicity, % | ||||||
| Non-Hispanic white | 63.4 | 74.2 | 78.1 | 35.1 | 66.1 | 44.6 |
| Non-Hispanic black | 10.3 | 2.8 | 5.4 | 22.2 | 9.6 | 15.4 |
| Hispanic | 17.0 | 11.7 | 8.9 | 32.4 | 14.7 | 33.8 |
| Non-Hispanic other | 9.2 | 11.3 | 7.7 | 10.3 | 9.7 | 6.2 |
| Locale, % | ||||||
| Suburban | 42.6 | 59.3 | 45.2 | 28.6 | 41.0 | 53.9 |
| SES quintile,b (%) | ||||||
| 1 (low SES) | 17.1 | 5.5 | 3.5 | 44.5 | 16.0 | 24.8 |
| 2 | 22.1 | 15.0 | 18.6 | 31.6 | 22.0 | 22.6 |
| 3 | 21.3 | 17.4 | 27.2 | 14.9 | 21.8 | 18.1 |
| 4 | 19.4 | 24.3 | 25.8 | 6.8 | 20.0 | 15.4 |
| 5 (high SES) | 20.1 | 37.8 | 24.9 | 2.2 | 20.3 | 19.1 |
| State variables | ||||||
| Sample size | 40 | >30 | <10 | |||
| Obesity prevalence, age 10-17 y, meanc | 15.4 | 15.2 | 16.5 | |||
| Median household income, $, meand | 51 047 | 50 577 | 55 276 | |||
| Poverty rate, meand | 11.8 | 11.8 | 12.2 | |||
| Adults with bachelor degree, %, meand | 27.1 | 26.9 | 28.8 | |||
Abbreviations: SES, socioeconomic status; USDA, US Department of Agriculture.
Free or reduced price.
Measured using an index that combined data on parental education, parental occupation, and household income.
Based on 2007 National Survey of Children’s Health.
Based on 2007 American Community Survey.
Table 2 illustrates the differences between students of different lunch participant status in dietary behaviors, obesity prevalence, and mean BMI percentile. The unadjusted prevalence of obesity was 11 percentage points higher among students who obtained free/reduced-price lunches at school compared with students who did not obtain lunch at school. The prevalence remained 3.7 percentage points higher (95% CI, 0.0 to 7.5) after controlling for state fixed effects, race/ethnicity, sex, locale, and SES index. For each in-school purchasing behavior, the adjusted mean was highest among students who purchased full-price lunches at school, whereas adjusted means for overall consumption of fast food and SSBs were highest among students who obtained free/reduced-price lunches.
Table 2.
Mean In-School Purchases, Overall Consumption, and Weight Status by Students’ School Lunch Participant Status
| Outcome | School Lunch | Unadjusted | Adjusted Difference,a β (95% CI) |
|---|---|---|---|
| In-school purchasesb | |||
| Sweets | |||
| No lunch | 0.69 | ||
| Full price | 1.15 | 0.53 (0.29 to 0.78) | |
| Free/reduced price | 1.31 | 0.47 (0.04 to 0.91) | |
| Snacks | |||
| No lunch | 0.68 | ||
| Full price | 0.92 | 0.37 (0.24 to 0.51) | |
| Free/reduced price | 1.04 | 0.15 (−0.11 to 0.41) | |
| SSBs | |||
| No lunch | 0.52 | ||
| Full price | 0.87 | 0.31 (0.12 to 0.49) | |
| Free/reduced price | 1.03 | 0.10 (−0.23 to 0.42) | |
| Overall consumptionc | |||
| Fast food | |||
| No lunch | 1.68 | ||
| Full price | 2.12 | 0.23 (0.04 to 0.42) | |
| Free/reduced price | 3.19 | 0.34 (−0.05 to 0.72) | |
| SSBs | |||
| No lunch | 4.02 | ||
| Full price | 5.34 | 0.70 (0.18 to 1.22) | |
| Free/reduced price | 6.41 | 0.87 (0.18 to 1.57) | |
| Weight status | |||
| Obesity, % | |||
| No lunch | 14.3 | ||
| Full price | 16.3 | 0.6 (−3.0 to 4.1) | |
| Free/reduced price | 25.2 | 3.7 (0.0 to 7.5) | |
| BMI percentile, mean | |||
| No lunch | 63.0 | ||
| Full price | 65.0 | 1.1 (−1.6 to 3.8) | |
| Free/reduced price | 72.3 | 2.4 (−0.9 to 5.6) |
Abbreviations: BMI, body mass index (calculated as weight in kilograms divided by height in meters squared); SSB, sugar-sweetened beverage.
Adjusted for state (fixed effect), race/ethnicity, sex, locale, and socioeconomic status index.
Number of times purchased within school in the past week (mean).
Number of times consumed within the past week (mean).
The magnitude of differences in weight status between students of different lunch participant status varied considerably between states with different school meal laws (Figure). In states that did not exceed USDA standards, students who obtained free/reduced-price lunches were almost twice as likely to be obese than students who did not obtain school lunches (26.0% and 13.9%, respectively), whereas the disparity between groups was markedly reduced in states that exceeded USDA standards (21.1% and 17.4%, respectively). Negative coefficients in Table 3 likewise indicate that adjusted differences in weight status between school lunch participants and nonparticipants were smaller in states that exceeded USDA standards. For example, the adjusted difference in obesity prevalence between students who obtained free/reduced-price lunches and students who did not obtain lunch at school was 12.3 percentage points lower in states that exceeded USDA standards (95% CI, −21.5 to −3.0). Differences in adjusted mean BMI percentile between students who obtained free/reduced-price lunches and students who did not obtain school lunches were also lower in states that exceeded USDA standards (β = −11.0; 95% CI, −17.7 to −4.3). Results were similar when analyzing students who obtained regular-price lunches, but the interaction was not as large.
Figure.
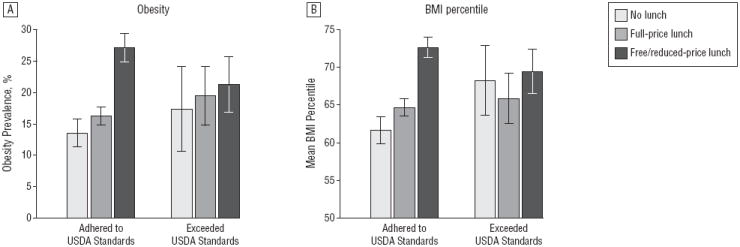
Unadjusted obesity prevalence and mean body mass index (BMI) percentile by student lunch participant status and strength of state school meal laws. USDA indicates US Department of Agriculture.
Table 3.
Adjusted Association Between State School Meal Laws and Student Weight Statusa
| Weight Measure | School Lunch | β (95% CI) |
|---|---|---|
| Obesity | ||
| None | ||
| Full price | −4.6 (−13.3 to 4.2) | |
| Free/reduced price | −12.3 (−21.5 to −3.0) | |
| BMI percentile | ||
| None | ||
| Full price | −6.0 (−12.7 to 0.6) | |
| Free/reduced price | −11.0 (−17.7 to −4.3) |
Abbreviation: BMI, body mass index (calculated as weight in kilograms divided by height in meters squared).
Association between state laws and differences in weight status between students who obtain school lunches and students who do not, adjusted for race/ethnicity, sex, locale, socioeconomic status index, hours of television watched per day, and days of physical activity in the past week.
Table 4 displays adjusted parameter estimates in analyses of dietary behaviors. Positive coefficients suggest that differences in purchasing/consumption between school lunch participants and nonparticipants were greater in states that exceeded USDA standards. Overall, there was little evidence that students in states that exceeded USDA standards purchased more foods or beverages from other school or nonschool venues. Estimates differed slightly between students who obtained free/reduced-price lunches vs those who obtained regular-price lunches, because their respective parameter estimates were in opposite directions from the null for both sweets and salty snacks. Estimates were relatively small and imprecise, however, and there was not enough evidence to attribute any differences in either category to school meal laws.
Table 4.
Adjusted Association Between State School Meal Laws and Student Dietary Purchasing and Consumptiona
| Outcome | School Lunch | β (95% CI) |
|---|---|---|
| In-school purchasingb | ||
| Sweets | ||
| None | ||
| Full price | 0.21 (−0.50 to 0.91) | |
| Free/reduced price | −0.06 (−0.77 to 0.66) | |
| Salty snacks | ||
| None | ||
| Full price | 0.23 (−0.40 to 0.87) | |
| Free/reduced price | −0.31 (−0.96 to 0.33) | |
| SSBs | ||
| None | ||
| Full price | 0.51 (−0.12 to1.14) | |
| Free/reduced price | 0.04 (−0.60 to 0.69) | |
| Overall consumptionc | ||
| Fast food | ||
| None | ||
| Full price | −0.10 (−0.98 to 0.77) | |
| Free/reduced price | −0.05 (−0.94 to 0.84) | |
| SSBs | ||
| None | ||
| Full price | −0.62 (−2.24 to 1.00) | |
| Free/reduced price | −0.77 (−2.44 to 0.89) |
Abbreviation: SSB, sugar-sweetened beverage.
Association between state laws and differences in mean purchases/consumption between students who obtain school lunches and students who do not, adjusted for race/ethnicity, sex, locale, socioeconomic status index, hours of television watched per day, and days of physical activity in the past week.
Number of times purchased within school in the past week (mean).
Number of times consumed within the past week (mean).
COMMENT
Several experts have pointed out the poor nutrition quality of NSLP meals2,3,5,6,33 and questioned if the program has contributed to the increase in childhood obesity.7-10,34 Critics have generally not considered how state policymakers can enhance the positive effect of federal school meal programs by implementing their own laws governing school meal nutrition content. The results of this study suggest that in states with laws that encouraged or required a specific number of fruits/vegetables, reductions in trans fats, 1% or skim milk, and/or a minimum proportion of whole grains, students who obtained school lunches had a more favorable weight status, particularly among participants eligible for a free/ reduced-price lunch. This quasi-experimental study cannot prove causality, but it was designed to control for unmeasured differences between states that are common to all students.
These results have direct implications for implementation of school meal standards that were recently released by the USDA.17 This study was modeled to compare students in states that adhered to previous USDA standards with students in states that exceeded previous federal requirements by incorporating provisions that were similar to 2012 USDA standards. None of the state laws used in this study were identical to 2012 USDA standards, but each included provisions that are currently being implemented in schools nationwide. The evidence in this study suggests that ongoing changes to school meal standards have the potential to reduce obesity, particularly among students who are eligible for free/reduced-price lunches, though additional longitudinal research is needed to confirm this. Longitudinal studies could also examine whether any effects of school meal reforms change over time as new standards are integrated.
This study also examined the possibility that students compensated for school meal laws by purchasing or consuming more foods and beverages from other venues. Policy resistance is a common phenomenon that occurs when policies trigger behavioral or environmental changes that negate the policy.35 Overall, there was little evidence of compensation, but even modest positive associations between laws and in-school purchasing among students who purchased a full-price lunch may explain why the association between state laws and weight status was weaker in this population. Such feedback mechanisms would be consistent with previous school nutrition policy evaluation studies.36 Purchasing and consumption are also vulnerable to measurement error,37 and questions did not include information on volume that was purchased. Future studies could use more precise instruments (eg, 24-hour recall) to assess whether stringent school meal standards are associated with increases in intake from other sources or lower participation in school lunch programs. Early media reports suggested that some students protested new USDA standards,38 but to our knowledge, this topic has not been studied rigorously.
Identifying compensatory mechanisms is particularly important because of the widespread availability of competitive foods in schools.5,6,20 Unless school meal laws are accompanied by nutrition education and initiatives to limit energy-dense competitive foods and beverages, then even the most stringent school meal standards may be undermined by competitive foods. Studying the comprehensive effect of school meal and competitive food laws is an important topic for future research. This study was unable to analyze school meal and competitive food laws in conjunction because of the small number of states that exceeded USDA standards, but there will be future opportunities to do so as policymakers continue to target both domains. States and districts have strengthened competitive food and school meal policies since 2006-200739 and the Healthy, Hunger-Free Kids Act of 2010 requires the development and implementation of nationwide nutrition standards for competitive foods in schools that participate in federal meal programs.40 Studying the comprehensive effect of policies across domains will require examining how different intervention targets interact with each other and with the broader environment.41
Results of this study should be interpreted cautiously because of several limitations. Foremost, the cross-sectional design makes it impossible to conclude whether differences in weight status were caused by school meal laws. The study design cannot account for state-level variables that affect students who obtain free/reduced-price lunches differently than students who do not obtain school lunches (eg, Supplemental Nutrition Assistance Program42). The small number of states in the intervention group further increases the risk of state-level confounding. The quantity of missing data may have biased results, as missing data were associated with several demographic characteristics and weight status. The lack of data on school meal content makes it further difficult to ascertain whether any differences in weight status were attributable to state laws, and implementation of state laws may have varied within the state because of district policies or varying degrees of adherence. Timing of implementation may have varied, too, as we do not have comparable data on laws prior to 2006-2007. Finally, laws that exceeded USDA standards included some, but not all, of the 2012 updates to USDA standards, and specific standards, eg, reduced trans fats or 1% or skim milk, varied from state to state, making it impossible to analyze whether one standard had more of an impact than another.
The evidence supporting stringent school meal standards is far from conclusive, but this study provides promising signs of the potential for the USDA updated standards to improve student weight status. Previous standards had not been updated since 1995 and did not include specific provisions that were consistent with the latest nutrition science. State laws that require schools to provide meals that are consistent with the Dietary Guidelines for Americans would complement the updated USDA school meal standards and enhance the potential of federal and state initiatives to reduce obesity.
Supplementary Material
Acknowledgments
Funding/Support: Support for this research was provided by The Robert Wood Johnson Foundation to the Bridging the Gap program located within the Health Policy Center at the University of Illinois at Chicago (principal investigator, Dr Chaloupka) and grant R01HL096664 from the National Heart, Lung, and Blood Institute (principal investigator, Dr Powell).
Additional Contributions: We gratefully acknowledge Linda Schneider, MS, Camille Gourdet, JD, MA, Kristen Ide, MPH, RD, LDN, Amy Bruursema, MS, and Steven Horvath, BA, for research support provided in compiling and analyzing the state-level laws and Tamkeen Khan, MA, for research assistance with cleaning the individual-level ECLS-K data. We also thank Whitney Robinson, PhD, for thoughtful comments on the manuscript.
Disclaimer: The views expressed herein are solely those of the authors and do not reflect the official views or positions of the Robert Wood Johnson Foundation, the National Heart, Lung, and Blood Institute, or the National Institutes of Health.
Footnotes
Author Contributions: Study concept and design: Taber, Chriqui, and Chaloupka. Acquisition of data: Chriqui, Powell, and Chaloupka. Analysis and interpretation of data: Taber, Chriqui, Powell, and Chaloupka. Drafting of the manuscript: Taber. Critical revision of the manuscript for important intellectual content: Chriqui, Powell, and Chaloupka. Statistical analysis: Taber and Chaloupka. Obtained funding: Chriqui, Powell, and Chaloupka. Study supervision: Chriqui and Powell.
Conflict of Interest Disclosures: None reported.
Online-Only Material: The eAppendix is available at http://www.jamapeds.com
References
- 1.US Department of Agriculture Food and Nutrition Service. National School Lunch Program: participation and lunches served. [December 8, 2011]; http://www.fns.usda.gov/pd/slsummar.htm.
- 2.Clark MA, Fox MK. Nutritional quality of the diets of US public school children and the role of the school meal programs. J Am Diet Assoc. 2009;109(2 suppl):S44–S56. doi: 10.1016/j.jada.2008.10.060. [DOI] [PubMed] [Google Scholar]
- 3.Crepinsek MK, Gordon AR, McKinney PM, Condon EM, Wilson A. Meals offered and served in US public schools: do they meet nutrient standards? J Am Diet Assoc. 2009;109(2 suppl):S31–S43. doi: 10.1016/j.jada.2008.10.061. [DOI] [PubMed] [Google Scholar]
- 4.Finkelstein DM, Hill EL, Whitaker RC. School food environments and policies in US public schools. Pediatrics. 2008;122(1):e251–e259. doi: 10.1542/peds.2007-2814. [DOI] [PubMed] [Google Scholar]
- 5.Johnston LD, O’Malley PM, Terry-McElrath YM, Freedman-Doan P, Brenner JS. School Policies and Practices to Improve Health and Prevent Obesity: National Secondary School Survey Results, School Years 2006-07 and 2007-08 Volume1 Executive Summary. Ann Arbor, MI: Bridging the Gap Program, Survey Research Center, Institute for Social Research; 2011. [Google Scholar]
- 6.Turner L, Chaloupka FJ, Chriqui JF, Sandoval A. School Policies and Practices to Improve Health and Prevent Obesity: National Elementary School Survey Results: School Years 2006-07 and 2007-08. Chicago, IL: Bridging the Gap Program, Health Policy Center, Institute for Health Research and Policy, University of Illinois at Chicago; 2010. [Google Scholar]
- 7.Miller DP. Associations between the home and school environments and child body mass index. Soc Sci Med. 2011;72(5):677–684. doi: 10.1016/j.socscimed.2010.12.003. [DOI] [PubMed] [Google Scholar]
- 8.Millimet D, Tchernis R, Husain M. School nutrition programs and the incidence of childhood obesity. J Hum Resour. 2010;45(3):640–654. [Google Scholar]
- 9.Schanzenbach D. Do school lunches contribute to childhood obesity? J Hum Resour. 2009;44(3):684–709. doi: 10.1353/jhr.2009.0021. [DOI] [Google Scholar]
- 10.Hernandez DC, Francis LA, Doyle EA. National School Lunch Program participation and sex differences in body mass index trajectories of children from low-income families. Arch Pediatr Adolesc Med. 2011;165(4):346–353. doi: 10.1001/archpediatrics.2010.253. [DOI] [PMC free article] [PubMed] [Google Scholar]
- 11.Gundersen C, Kreider B, Pepper J. The impact of the National School Lunch Program on child health: a nonparametric bounds analysis. J Econom. 2012;166(1):79–91. doi: 10.1016/j.jeconom.2011.06.007. [DOI] [Google Scholar]
- 12.Hofferth SL, Curtin S. Poverty, food programs, and childhood obesity. J Policy Anal Manage. 2005;24(4):703–726. doi: 10.1002/pam.20134. [DOI] [PubMed] [Google Scholar]
- 13.Mirtcheva DM, Powell LM. National school lunch program participation and child body weight. East Econ J. doi: 10.1057/eej.2012.14. [published online July 16, 2012] [DOI] [Google Scholar]
- 14.Wang Y, Beydoun MA. The obesity epidemic in the United States—gender, age, socioeconomic, racial/ethnic, and geographic characteristics: a systematic review and meta-regression analysis. Epidemiol Rev. 2007;29:6–28. doi: 10.1093/epirev/mxm007. [DOI] [PubMed] [Google Scholar]
- 15.Must A, Strauss RS. Risks and consequences of childhood and adolescent obesity. Int J Obes Relat Metab Disord. 1999;23(suppl 2):S2–S11. doi: 10.1038/sj.ijo.0800852. [DOI] [PubMed] [Google Scholar]
- 16.Child Nutrition and WIC Reauthorization Act of 2004. 2004 Pub L No. 108-265. [Google Scholar]
- 17.US Department of Agriculture. Nutrition standards in the National School Lunch and School Breakfast Programs: final rule. [February 1, 2012]; http://www.gpo.gov/fdsys/pkg/FR-2012-01 -26/pdf/2012-1010.pdf. [PubMed]
- 18.Harper S, Strumpf EC, Kaufman JS. Do medical marijuana laws increase marijuana use? replication study and extension. Ann Epidemiol. 2012;22(3):207–212. doi: 10.1016/j.annepidem.2011.12.002. [DOI] [PubMed] [Google Scholar]
- 19.Signorello LB, McLaughlin JK, Lipworth L, Friis S, Sørensen HT, Blot WJ. Confounding by indication in epidemiologic studies of commonly used analgesics. Am J Ther. 2002;9(3):199–205. doi: 10.1097/00045391-200205000-00005. [DOI] [PubMed] [Google Scholar]
- 20.Larson N, Story M. Are ‘competitive foods’ sold at school making our children fat? Health Aff (Millwood) 2010;29(3):430–435. doi: 10.1377/hlthaff.2009.0716. [DOI] [PubMed] [Google Scholar]
- 21.Taber DR, Chriqui JF, Powell LM, Chaloupka FJ. Banning all sugar-sweetened beverages in middle schools: reduction of in-school access and purchasing but not overall consumption. Arch Pediatr Adolesc Med. 2012;166(3):256–262. doi: 10.1001/archpediatrics.2011.200. [DOI] [PMC free article] [PubMed] [Google Scholar]
- 22.Cullen KW, Watson K, Zakeri I, Ralston K. Exploring changes in middle-school student lunch consumption after local school food service policy modifications. Public Health Nutr. 2006;9(6):814–820. doi: 10.1079/phn2005878. [DOI] [PubMed] [Google Scholar]
- 23.Chaloupka FJ, Johnston LD. Bridging the Gap: research informing practice and policy for healthy youth behavior. Am J Prev Med. 2007;33(4 suppl):S147–S161. doi: 10.1016/j.amepre.2007.07.016. [DOI] [PubMed] [Google Scholar]
- 24.Mersky RM, Dunn DJ. Fundamentals of Legal Research. 8. New York, NY: Foundation Press; 2002. [Google Scholar]
- 25.F as in Fat: How Obesity Policies are Failing America, 2006. Washington, DC: Trust for America’s Health; 2006. [Google Scholar]
- 26.F as in Fat: How Obesity Policies are Failing America, 2007. Washington, DC: Trust for America’s Health; 2007. [Google Scholar]
- 27.Center for Science in the Public Interest. State school foods report card 2007. [October 17, 2010]; http://www.cspinet.org/2007schoolreport.pdf Published November 2007.
- 28.State school health policy database. National Association of State Boards of Education website. [October 15, 2012]; http://www.nasbe.org/healthy_schools/hs/index.php.
- 29.Childhood obesity—2007 update of legislative policy options. National Conference of State Legislatures website; [October 15, 2012]. http://www.ncsl.org/issues-research/health/childhood-obesity-2007.aspx Updated December 2007. [Google Scholar]
- 30.Tourangeau K, Le T, Nord C, Sorongon AG. Early Childhood Longitudinal Study, Kindergarten Class of 1998-99 (ECLS-K): Eighth-Grade Methodology Report (NCES 2009-003) Washington, DC: National Center for Education Statistics, Institute of Education Sciences; 2009. [Google Scholar]
- 31.Kuczmarski RJ, Ogden CL, Grummer-Strawn LM, et al. CDC growth charts: United States. Adv Data. 2000;(314):1–27. [PubMed] [Google Scholar]
- 32.Meyer B. Natural and quasi-experiments in economics. J Bus Econ Stat. 1995;13(2):151–161. doi: 10.2307/1392369. [DOI] [Google Scholar]
- 33.Condon EM, Crepinsek MK, Fox MK. School meals: types of foods offered to and consumed by children at lunch and breakfast. J Am Diet Assoc. 2009;109(2 suppl):S67–S78. doi: 10.1016/j.jada.2008.10.062. [DOI] [PubMed] [Google Scholar]
- 34.Fox MK, Dodd AH, Wilson A, Gleason PM. Association between school food environment and practices and body mass index of US public school children. J Am Diet Assoc. 2009;109(2 suppl):S108–S117. doi: 10.1016/j.jada.2008.10.065. [DOI] [PubMed] [Google Scholar]
- 35.Ghaffarzadegan N, Lyneis J, Richardson GP. How small system dynamics models can help the public policy process. Syst Dyn Rev. 2011;27(1):22–44. doi: 10.1002/sdr.442. [DOI] [Google Scholar]
- 36.Cullen KW, Watson K, Zakeri I. Improvements in middle school student dietary intake after implementation of the Texas Public School Nutrition Policy. Am J Public Health. 2008;98(1):111–117. doi: 10.2105/AJPH.2007.111765. [DOI] [PMC free article] [PubMed] [Google Scholar]
- 37.Livingstone MB, Robson PJ. Measurement of dietary intake in children. Proc Nutr Soc. 2000;59(2):279–293. doi: 10.1017/s0029665100000318. [DOI] [PubMed] [Google Scholar]
- 38.Snacks: the USDA’s solution to student’s healthy lunch complaints. [March 4, 2013]; ABC News website. http://abcnews.go.com/Politics/OTUS/snacks-usdas-solution-healthy-school-lunch-protests/story?id=17324285 Published September 26, 2012.
- 39.Chriqui J, Schneider L, Chaloupka F, et al. School District Wellness Policies: Evaluating Progress and Potential for Improving Children’s Health Three Years After the Federal Mandate. School Years 2006-07, 2007-08 and 2008-09. Vol. 2. Chicago: Bridging the Gap, Healthy Policy Center, Institute for Health Research and Policy, University of Illinois at Chicago; 2010. [Google Scholar]
- 40.Healthy, Hunger-Free Kids Act. 2010 Pub L No. 111-296. [Google Scholar]
- 41.Institute of Medicine. Accelerating Progress in Obesity Prevention: Solving the Weight of the Nation. Washington, DC: The National Academies Press; 2012. [Google Scholar]
- 42.Supplemental Nutrition Assistance Program (SNAP) US Department of Agriculture Food and Nutrition Service website. [October 11, 2012]; http://www.fns.usda.gov/snap/
Associated Data
This section collects any data citations, data availability statements, or supplementary materials included in this article.