Abstract
Dual-energy contrast-enhanced breast tomosynthesis is a promising technique to obtain three-dimensional functional information from the breast with high resolution and speed. To optimize this new method, this study searched for the beam quality that maximized image quality in terms of mass detection performance. A digital tomosynthesis system was modeled using a fast ray-tracing algorithm, which created simulated projection images by tracking photons through a voxelized anatomical breast phantom containing iodinated lesions. The single-energy images were combined into dual-energy images through a weighted log subtraction process. The weighting factor was optimized to minimize anatomical noise, while the dose distribution was chosen to minimize quantum noise. The dual-energy images were analyzed for the signal difference to noise ratio (SdNR) of iodinated masses. The fast ray-tracing explored 523,776 dual-energy combinations to identify which yields optimum mass SdNR. The ray-tracing results were verified using a Monte Carlo model for a breast tomosynthesis system with a selenium-based flat-panel detector. The projection images from our voxelized breast phantom were obtained at a constant total glandular dose. The projections were combined using weighted log subtraction and reconstructed using commercial reconstruction software. The lesion SdNR was measured in the central reconstructed slice. The SdNR performance varied markedly across the kVp and filtration space. Ray-tracing results indicated that the mass SdNR was maximized with a high-energy tungsten beam at 49 kVp with 92.5 μm of copper filtration and a low-energy tungsten beam at 49 kVp with 95 μm of tin filtration. This result was consistent with Monte Carlo findings. This mammographic technique led to a mass SdNR of 0.92 ± 0.03 in the projections and 3.68 ± 0.19 in the reconstructed slices. These values were markedly higher than those for non-optimized techniques. Our findings indicate that dual-energy breast tomosynthesis can be performed optimally at 49 kVp with alternative copper and tin filters, with reconstruction following weighted subtraction. The optimum technique provides best visibility of iodine against structured breast background in dual-energy contrast-enhanced breast tomosynthesis.
Keywords: Monte Carlo, Dual-energy, Contrast Imaging, Breast Tomosynthesis, Molecular Imaging
I. INTRODUCTION
Women at high risk of breast cancer have been advised to begin mammographic screening early and to supplement mammography with breast MRI.1-4 However, neither standard mammography nor breast MRI are ideal screening tools. In mammography, cancers may be missed in women with dense breasts,5 while specificity and cost remain concerns with MRI.6 What is needed is a technology that combines functional three-dimensional data similar to MRI but with the low cost, high speed, and high resolution characteristics of mammography. One promising technology that may be of potential merit in that regard is dual-energy contrast-enhanced breast tomosynthesis.7-10
The breast tomosynthesis technology provides the ability for three-dimensional localization. Within the context of three-dimensional data provided by tomosynthesis, the contrast-enhanced technology provides functional data, the value of which has been demonstrated with contrast-enhanced mammography.11-14 Finally, the dual-energy technology allows for the ability to gather the functional data in two sequential scans as opposed to a pre-contrast and post-contrast imaging set, minimizing motion blur artifacts and contrast penetration problems associated with temporal subtraction contrast imaging techniques. However, while this three-way combined imaging method appears promising, there is no consensus on the optimal radiographic technique for this new imaging method.
The purpose of this study was to optimize the radiographic technique for dual-energy contrast-enhanced tomosynthesis. The optimization was based on mass conspicuity for iodinated lesions. A ray-tracing algorithm was used to examine the signal difference to noise ratio (SdNR) of iodinated masses imaged with a wide variety of beam energies, filter materials, and filter thicknesses. The results of the ray-tracing model were verified by a Monte Carlo model that simulated photon transport through a voxelized breast phantom. The mass SdNR was examined as a basis to optimize dual-energy contrast-enhanced tomosynthesis in both the tomosynthesis projections and reconstructed slices.
II. MATERIALS AND METHODS
Traditionally, dual-energy imaging has been used to decompose a radiographic image into two materials, such as bone and soft tissue. In this study, a different approach was used where the dual-energy technique was optimized to remove the contrast between adipose and glandular tissue and thereby minimize anatomical noise. Our optimization of dual-energy contrast-enhanced tomosynthesis proceeded in a three-stage process. First, the weighting factor for the weighted log subtraction was chosen to remove the contrast between adipose and glandular materials. Second, the distribution of dose between the two single-energy images were optimized to minimize quantum noise. Finally, the optimal beam quality was chosen to maximize the SdNR of the iodinated masses in the dual-energy images. The following describes the theoretical basis for these optimization stages followed by description of each of the components o the study.
A. Methodological Framework
1. Weighted Log Subtraction Optimization
As noted above, the first objective of our optimization was to minimize the contrast between adipose and glandular tissue and thereby minimize anatomical noise. For that objective, if a monoenergetic beam traveling through a two component breast containing only adipose and glandular tissue, Beer's law predicts the attenuated beam I to take the form
| (1) |
where I0 is the beam incident on the breast, μg and μa correspond to the attenuation coefficient of glandular and adipose tissue, respectively, gf is the glandular fraction, and tb is the breast thickness. The log of this signal is
| (2) |
where α is defined as the coefficient of gf, and β is a constant independent of glandular fraction. As this equation implies, the log-signal is linearly related to the glandular fraction.
Weighted log subtraction creates a dual-energy image as
| (3) |
where w corresponds to the weighting factor, and IH and IL represent the high and low energy images, respectively. IDE depends on glandular fraction as
| (4) |
As seen above, the dual-energy signal is also linearly related to the glandular fraction. To eliminate the dual-energy image's dependence on glandular fraction, and thereby minimizing the contrast between adipose and glandular tissues, the weighting factor w must equal
| (5) |
While these equations hold for a monoenergetic beam, where α's can be solved exactly, clinical beams are polyenergetic. For the polyenergetic case, the log of the single-energy signal is only approximately linear with respect to glandular fraction, gf. For a line as ln(I) = α gf + β, we will then have n sets of data points. To minimize the glandular-adipose contrast for polyenergetic beams, the image signal may be computed for various glandular fractions for both the low and high energy conditions. The optimal weighting parameter can then be found with a linear regression with an algebraic simplification as
| (6) |
where the I[gf] represents the signal value at a given glandular fraction and n is the number of glandular fractions at which the signal value was simulated (see Appendix). Please note that for an actual breast examination, given a particular breast thickness and granular fraction, an adaptable weighting parameter might be manually or semi-automatically adjusted by the radiologist for optimal reduction of glandular-adipose contrast.
2. Dose Distribution Optimization
The magnitude of glandular dose was estimated for the high and low energy beams using methods noted below based on prior simulations24 or Monte Carlo methods. The total exam dose to the breast was then computed as the summation of the dose from the low- and high-energy images. The dual-energy image being formed from the two image sets, one can rewrite Equation 3 as
| (7) |
where δ represents the total exam dose and ε, varying between 0 and 1, is the fractional contribution of the high-energy image to the total exam dose. The dose distribution factor ε may be selected to minimize the quantum noise in the dual-energy image. This was done by generating a dual-energy image of a homogeneous phantom (in this study, a 50% adipose/50% glandular slab), and finding the ε value that minimizes quantum noise. This minimization was performed using a golden section search and parabolic interpolation, which adjusted ε until it found the minimum standard deviation of the image.15, 16
3. Iodine SdNR Optimization
For the monoenergetic case, the ideal beams would bracket the k-edge of iodine (33.169 keV). At these beam energies, the dual-energy image would show strong signal values in iodine areas while minimal signal would occur in areas with other materials. However, clinical beams are polyenergetic. With polyenergetic beams, three factors must be considered: the magnitude of the beams on either side of the iodine k-edge, their spectral overlap, and the magnitude of glandular dose the beams impart to the breast. Due to the difficulty of balancing these three factors, optimization is performed empirically by measuring the iodinated mass SdNR in dual-energy subtracted images at a variety of different beam shapes. The optimal beam combination is chosen that maximizes the mass SdNR.
B. Breast Phantom
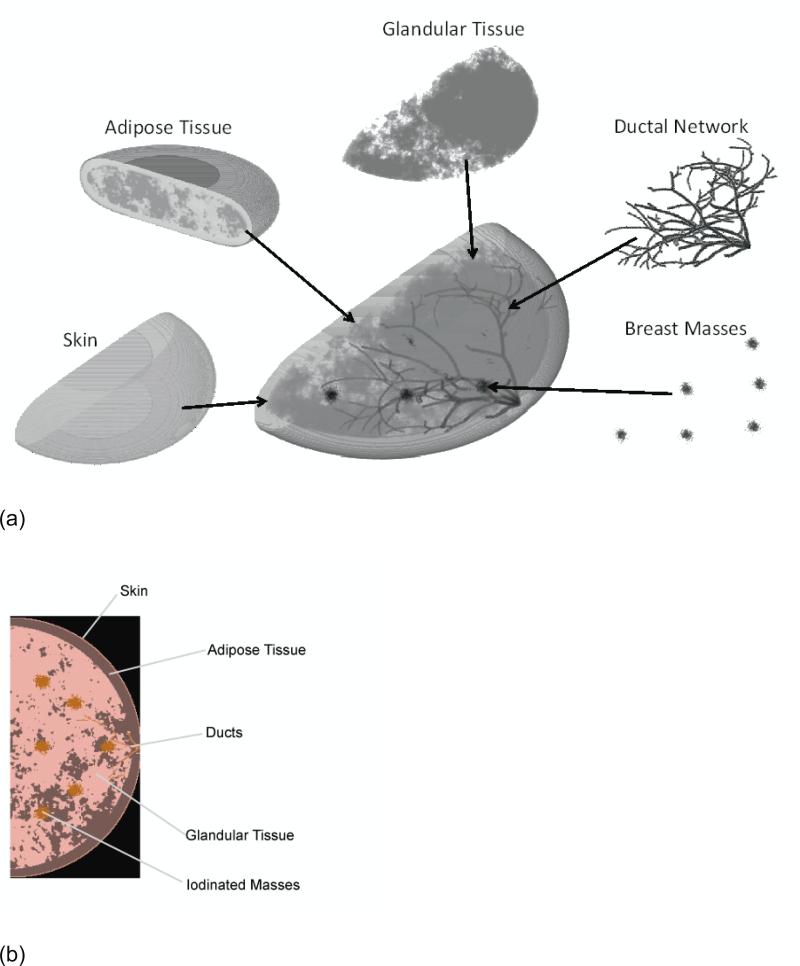
A new implementation of a previously developed breast simulation program was used in this study to create realistic breast phantoms in a voxelized format (see Figure 1).17 Each realization of the phantom differed in terms of the arrangement of adipose and glandular tissue and the layout of the ductal network. The phantom included six 5 mm breast masses created using a stochastic growth algorithm to mimic infiltration, and ability to have various compression realizations. The lesions were placed at the center plane of the phantom in a symmetrical pattern illustrated in Figure 1. Phantoms were produced with an 8 cm cross-sectional radius and compressed breast thickness of 4 cm, reflective of a typical breast size in the US population. Prior publications provided the elemental compositions of the phantom and system materials in the simulation model including the adipose tissue, ductal tissue, skin, pyrex, selenium,18 glandular tissue, and malignant masses infused with 1% iodine (Table I).19 The full phantom was used for the Monte Carlo simulations, while a reduced version that only incorporated the glandular tissue, adipose tissue, and iodinated mass was used for the ray-tracing algorithm. Based on previous research on the relationship between glandular fraction and compressed breast thickness for a 4 cm breast,20-22 an average glandular fraction of 60% was chosen.
Figure 1.
Major components of the three dimensional breast phantom model used in the study (a). A single cross sectional depiction of the phantom at the plane of the breast lesions (b).
Table I.
Elemental composition of phantom materials and other materials in the simulation model.
| No. | Material | Density (g/cm3) | Elements (atoms/molecule) |
|---|---|---|---|
| 1 | Adipose (ICRU-44) | 0.95 | H: 1.0 C: 0.44 N: 0.0044 O: 0.15 Na: 3.8E-4 S: 2.8E-4 Cl: 2.5E-4 |
| 2 | Glandular (ICRU-44) | 1.02 | H: 0.62 C: 0.12 N: 0. 021 O: 0.24 Na: 1.9E-5 Mg: 1.5E-5 P: 6.6E-5 S: 3.1E-4 Cl: 4.7E-4 K: 1.4E-4 Ca: 2.3E-5 Fe: 1.1E-6 Zn: 9.5E-7 |
| 3 | Skin (ICRP) | 1.1 | H: 0.62 C: 0.12 N: 0. 021 O: 0.24 Na: 1.9E-5 Mg: 1.5E-5 P: 6.6E-5 S: 3.1E-4 Cl: 4.7E-4 K: 1.4E-4 Ca: 2.3E-5 Fe: 1.1E-6 Zn: 9.5E-7 |
| 4 | Ductal Tissue (Soft Tissue ICRP) | 1.0 | H: 0.63 C: 0.12 N: 0. 011 O: 0.24 Na: 3.0E-4 Mg: 3.3E-5 P: 2.6E-4 S: 3.8E-4 |
| Cl: 2.3E-4 K: 3.1E-4 Ca: 3.5E-5 Fe: 5.4E-6 Zn: 2.8E-6 |
|||
| 5 | Striated Muscle (ICRP) | 1.04 | H: 0.63 C: 0.064 N: 0. 016 O: 0.29 Na: 2.2E-4 Mg: 5.1E-5 P: 4.0E-4 S: 9.8E-4 K: 4.8E-4 |
| 6 | Calcification | 3.3 | H: 2.0 O: 0.26 P: 6.0 Ca: 10 |
| 7 | Selenium | 4.5 | Se: 1.0 |
| 8 | Pyrex | 2.23 | B: 0.070 O: 0.64 Na: 0.023 Al: 0.0082 Si: 0.26 K: 0.0016 |
C. Ray Tracing Model
A ray-tracing model was used to analyze the mass SdNR in projection images. While not modeling scattered radiation and detector noise, the ray tracing method was used prior to Monte Carlo simulation as its simplicity enabled examination of a wide variety of parameters with manageable computational burden. The model began by creating xray photons according to a given radiographic beam profile. The x-ray photons were then tracked through a 4 cm voxelized breast phantom with a subtle iodinated mass. The x-ray attenuation coefficients of the phantom were based on previous measurements,23 while the absorbed glandular dose was based on simulation results.24 After traveling through the phantom, the photons were assumed to be absorbed by a perfect energy-integrating detector, forming a final two-dimensional projection image of the breast. Dual-energy projection images were formed from the single-energy image pairs using a weighted log subtraction. The optimal weighting factor was computed using equation (6) by measuring the log-signal at eleven glandular fractions equally spaced from zero to one, while the optimal dose distribution was optimized by the method of section II.A.2.
The ray tracing model examined 1024 clinical mammographic beams (32 kVp settings x 8 filter materials x 4 filter thicknesses. Each poly-energetic beam was from a tungsten tube operated at different kVp with different filter materials and filter thickness (see Table II). The tungsten spectra for 18-42 kVp were generated from published simulations,25 the higher energy spectra (43-49 kVp) were extrapolated from those published results using the same interpolation principles as that of the reference. 25 The attenuation characteristics for the added filtration were drawn from existing databases.23 The choice of the kVp range for the study was to reflect the range of the kVps currently applicable for mammographic imaging systems in the United States. Only filters with thicknesses less than the fiftieth-value layer were investigated to maintain attenuation levels consistent with those of standard added filtration in current mammography systems; thicker filters would lead to increased tube-loading and potential motion artifacts. The total dual-energy projection dose (the sum of the dose delivered by the high and low energy beams) was equivalent to that of one typical tomosynthesis projection at our institution (0.17 mGy). This dose was chosen such that the total exam dose would be less than a two-view mammogram.33-35 For dual-energy optimization, all possible combinations of low and high energy beams were investigated, leading to a search through 523,776 beam combinations.
Table II.
Beams investigated by the ray-tracing model.
| Parameter | Number of Values | Values |
|---|---|---|
| Beam Energy | 32 | 18-49 kVp |
| Filter Material | 8 | aluminum platinum silver tin copper iridium rhodium cerium |
| Filter Thickness | 4 | half-value-layer quarter-value-layer twentieth-value-layer fiftieth-value-layer |
D. Monte Carlo Model
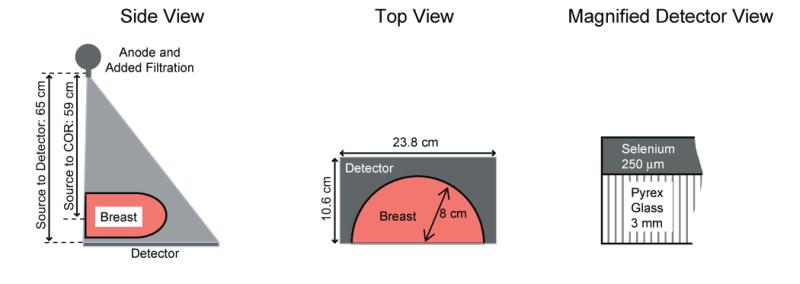
To verify that the ray-tracing results hold in the presence of scatter, detector noise, and tomosynthesis reconstruction, a tomosynthesis system was modeled using the Monte Carlo code Penelope.26 The Penelope package has been used to successfully simulated medical imaging systems in a number of previous studies.27-30 The Monte Carlo modeled a prototype flat-panel breast tomosynthesis system,31, 32 as shown in Figure 2 and summarized in Table III, using a custom tracking code for voxelized phantoms. The model consisted of an anode, our full voxelized breast phantom, and a selenium detector. To model a tomosynthesis system, the x-ray anode was rotated to generate 25 projection images over a 45° angular arc. Attenuation properties for all materials were supplied by the Penelope's databases.
Figure 2.
Schematic of simulated imaging system.
Table III.
Parameter values for simulation elements.
| Simulation Element | Parameter | Value |
|---|---|---|
| Detector | Pixel Size | 85 μm |
| Detector Material | Selenium (250 μm) | |
| Cross-Sectional Area | 10.6 cm × 23.8 cm | |
| Backing Material | Pyrex glass (3 mm) | |
| X-Ray Tube | Anode | Tungsten |
| Focal Spot Size | 0.3 mm | |
| Tomosynthesis Parameters | Angular Range | 45° |
| Number of Projections | 25 | |
The Monte Carlo model generated projection images for four different beam combinations, as listed in Table IV, including the incidence angle of the x-rays for different projections. These four combinations were chosen to bracket the range of the optimization space indicated by the earlier ray-tracing method (see Figure 5). The single-energy images were combined using weighted log subtraction to form dual-energy projections using the optimal weighting factor for removing the adipose-glandular contrast. For each beam combination, the distribution of dose between the two single-energy images was optimized to minimize quantum noise.
Table IV.
Summary of beam characteristics investigated with the Monte Carlo model. All beams modeled a tungsten anode operated at 49 kVp.
| High Energy Beam | Low Energy Beam | ||
|---|---|---|---|
| Filter Material | Thickness (mm) | Filter Material | Thickness (mm) |
| Copper | 0.0925 | Tin | 0.0950 |
| Copper | 0.0925 | Tin | 0.0055 |
| Tin | 0.0950 | Copper | 0.0080 |
| Copper | 0.0080 | Tin | 0.0055 |
Figure 5.
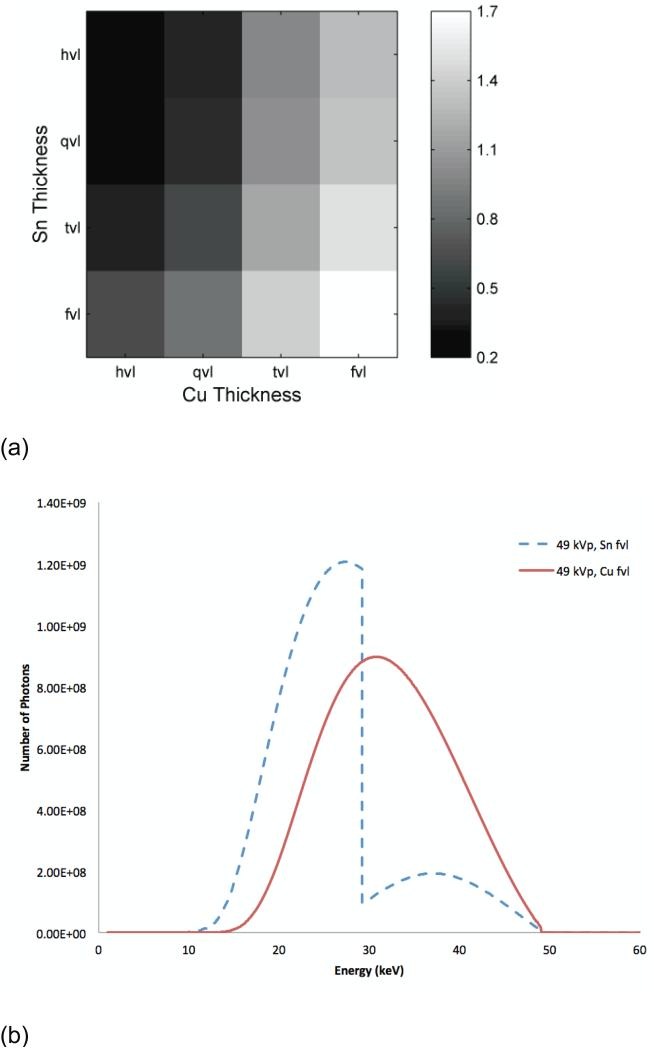
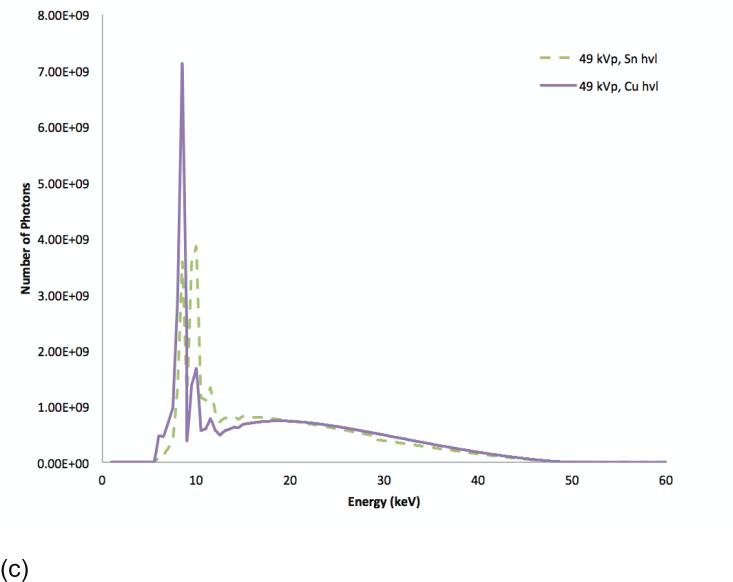
SdNR as a function of filter thickness at 49 kVp with two different filter materials. The filter thicknesses are indicated in value layers with half-value layer (hvl), quarter-value layer (qvl), twentieth-value layer (tvl), and fiftieth-value (fvl) at tomosynthesis projection dose (a). The spectra corresponding to the optimal (fvl) thicknesses of Sn and Cu filtration, the lower-right corner of (a) diagram (b), and those corresponding to the sub-optimal (fvl) thicknesses of Sn and Cu filtration, the upper-left corner of (a) diagram (c).
Using the Monte Carlo program, 200 projection images were produced (4 beam combinations x 2 single-energy beams per combination x 25 projections) using the same total dose for each dual-energy exam (4.3 mGy). This dose was similar to that for a two-view mammogram.33-35 Using the Duke Shared Cluster Resource, a grid computing cluster of 1300 Linux nodes with Intel processors, the Monte Carlo program required approximately 1000 processor days.
The single-energy projection images were combined using the same dual-energy subtraction as was employed by the ray-tracing algorithm. The resulting dual-energy projections were then reconstructed using a previously developed filtered back-projection reconstruction method.36 The reconstructed volume had a voxel size of 85 μm × 85 μm × 1 mm. Using a commercial PC, the reconstruction took approximately 10 minutes per case. The order of these operations (dual-energy subtraction then reconstruction) was chosen because pilot experiments showed this order minimizes artifacts in the reconstructed slices (see Discussion).
E. Mass Conspicuity Analysis
The mass conspicuity in the central reconstructed slice of the lesion was assessed based on the mass signal-difference-to-noise ratio (SdNR). An analysis algorithm measured the signal levels in the center of the masses (within a circle with a diameter of 3.4 mm), as the mass locations were known exactly in all projection images and reconstructed slices. The background signal and noise were measured within a ring of width 2.55 mm surrounding the mass. The SdNR was then calculated as the difference between the mass signal and background signal divided by the standard deviation of the background values. Importantly, in this assessment, the noise included both anatomical and quantum noise sources, as both limit mass conspicuity in clinical images. The standard error of the mass SdNR was found by bootstrapping over masses.
III. RESULTS
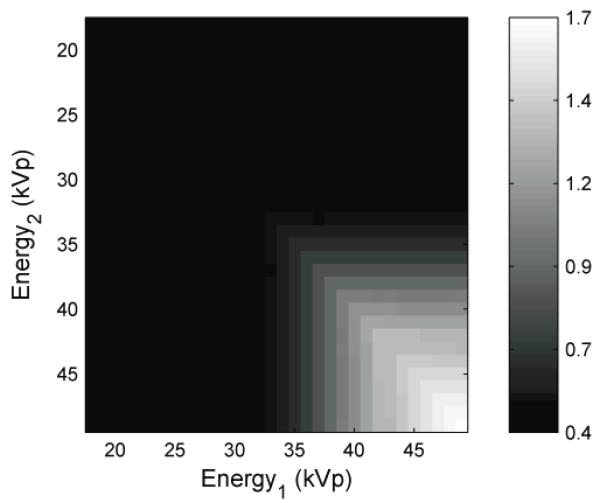
The ray-tracing algorithm tested 523,776 beam combinations allocated over six dimensions (beam energy, filter material, filter thickness for each low and high-energy beam). To visualize this data, the mass SdNR were viewed along maximum-intensity-projections in this parameter space. Figure 3 shows the mass SdNR as a function of beam energy by projecting through the filter material and filter thickness dimensions.
Figure 3.
The image is the maximum intensity projection display of SdNR over all filter materials and filter thicknesses as a function of beam energy at tomosynthesis projection dose.
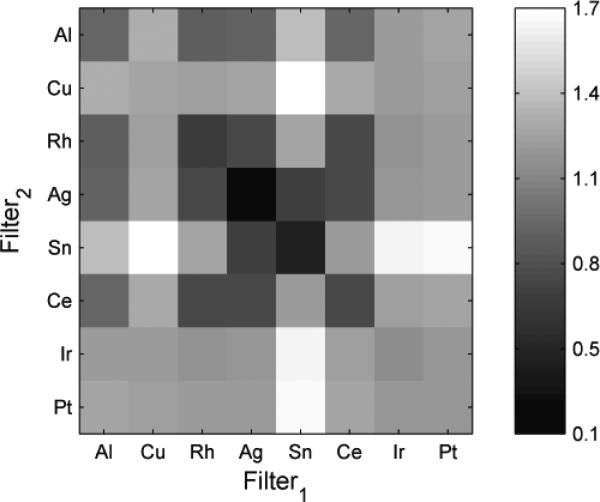
The results show monotonic and smooth trends indicating that an optimum solution is possible. This figure indicates that the optimal technique occurred when the low- and high-energy images were both acquired at 49 kVp. Fixing the beam energy dimensions to 49 kVp, Figure 4 shows the maximum SdNR as a function of filter material by projecting through the filter thickness dimension. The combinations of tin with platinum, iridium, and copper produced the best results, with the copper-tin pair giving the maximum SdNR.
Figure 4.
The image is the maximum intensity projection display of SdNR over all filter thicknesses for different filter materials at 49 kVp and tomosynthesis projection dose. The diagonal is not zero because each cell reflects the maximum intensity projection through the filter space such that two different thicknesses of a filter material might have been used.
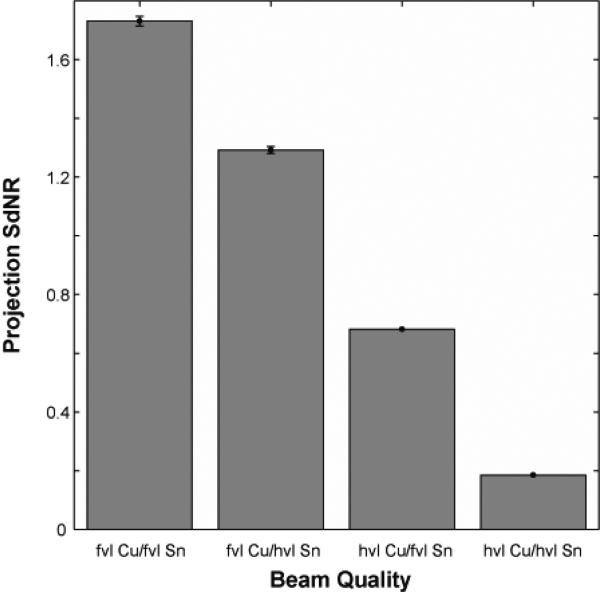
Fixing the beam energy dimension to 49 kVp and the filter material dimensions to copper and tin filtration, Figure 5 shows the effect of filter thickness. The optimal technique occurred with a high-energy tungsten beam at 49 kVp with a fiftieth-value layer of copper (92.5 μm) and a low-energy tungsten beam at 49 kVp with a fiftieth-value layer of tin (95 μm). Figures 5b shows the spectra corresponding to this optimum point indicating a good separation of the spectra bracketing the K-edge of iodine. For comparison, Figure 5c shows spectra corresponding a sub-optimal filtration condition where the spectra are not as distinct resulting in lower iodine contrast. Figure 6 plots the SdNR values for the thickest and thinnest filter layers of copper and tin calculated using the ray-tracing method, reflecting the four corners of Figure 5.
Figure 6.
Projection SdNR calculated with ray-tracing technique for four conditions corresponding to corners of Figure 5. The filter thicknesses are indicated in value layers with half-value layer (hvl) and fiftieth-value layer (fvl). The total glandular dose for each dual-energy projection pair was equal to one tomosynthesis projection.
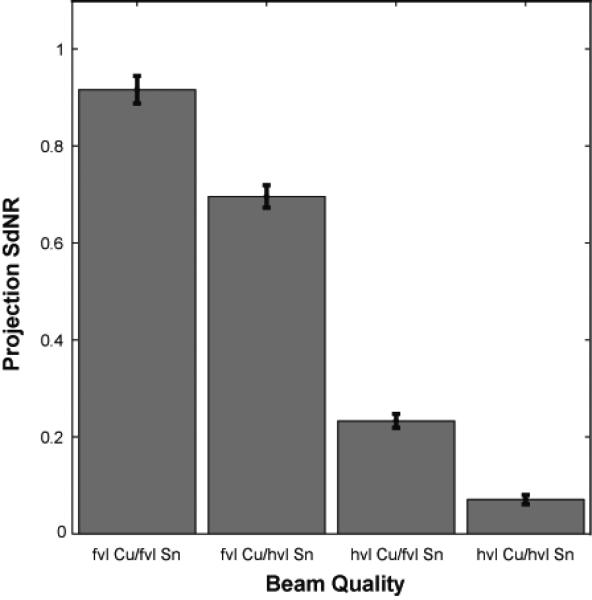
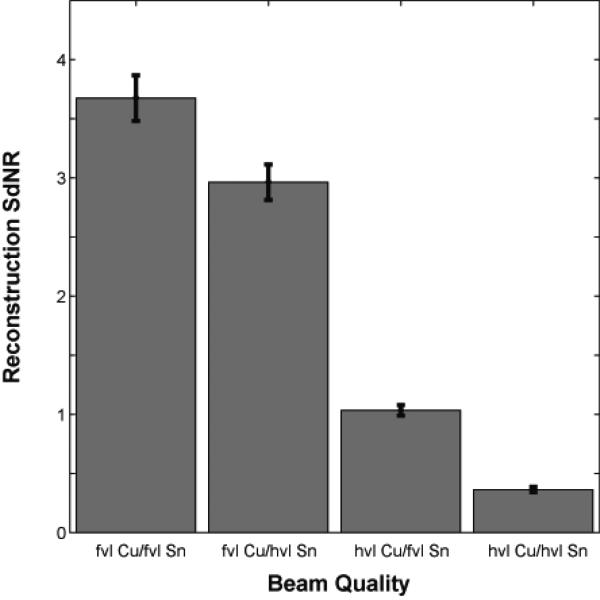
As noted, the performance of the system at the four technique corresponding to the four extreme corners of Figure 5 were verified by Monte Carlo modeling. Table V shows the weighting factorss and dose distribution parameters used in this portion of the simulation. Figure 7 shows the SdNR calculated from Monte Carlo projection images for the four beam qualities. The magnitude of the SdNRs were slightly lower than those from the ray-tracing method as expected due to the inclusion of scatter and detector noise in the Monte Carlo simulation. Nonetheless, the trends remaain identical between the two plots. Figure 8 shows the SdNR calculated from the central reconstructed slice generated from the Monte Carlo data. The absolute SdNR values are higher because the reconstruction is generated from 25 projection images, implying a higher overall dose in the formation of the image and less anatomical noise. Nevertheless, the trends remain identical to the Monte Carlo projection results and the ray-tracing results.
Figure 7.
Projection SdNR calculated with Monte Carlo for the four conditions of Figure 5. The filter thicknesses are indicated in value layers with half-value layer (hvl) and fiftieth-value layer (fvl). The total glandular dose for each dual-energy projection pair was equal to one tomosynthesis projection.
Figure 8.
Reconstruction SdNR calculated with Monte Carlo for the four conditions of Figure 5. The filter thicknesses are indicated in value layers with half-value layer (hvl) and fiftieth-value layer (fvl). The total glandular dose for each dual-energy acquisition was equal to one tomosynthesis scan (25 projections).
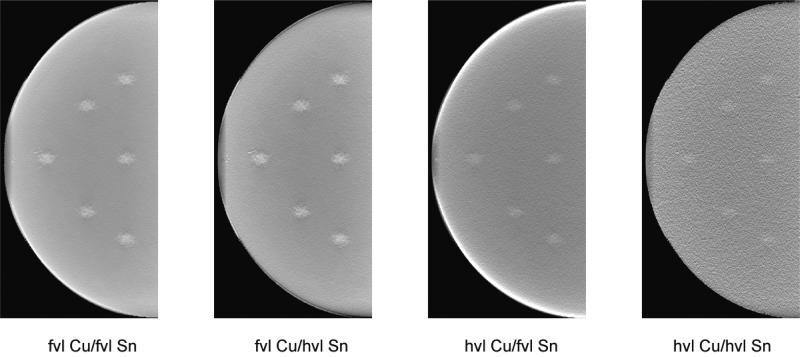
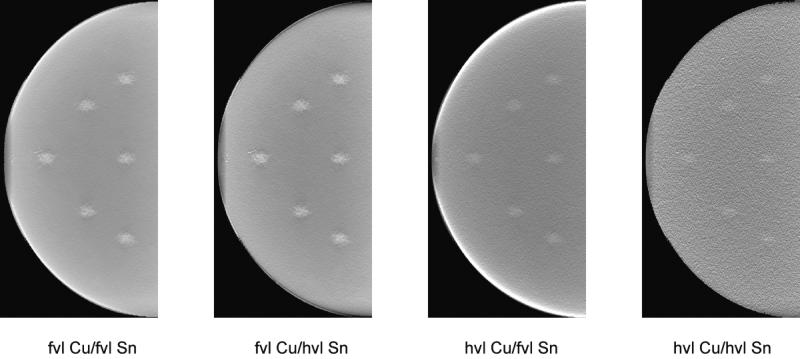
Figure 9 shows dual-energy subtracted tomosynthesis projections at each of the four techniques described above. For all four techniques, the dual-energy subtraction removed most of the anatomical noise with quantum noise remaining. The optimal technique shows the iodinated lesions much more clearly than the suboptimal techniques. Figure 10 illustrates the central reconstructed slice for the same four techniques. Again, the optimal technique provides the best conspicuity for the iodinated lesions, while the masses were more difficult to detect with the less optimal dual-energy techniques.
Figure 9.
Tomosynthesis projections obtained from Monte Carlo model for the four conditions of Figure 5. The filter thicknesses are indicated in value layers with half-value layer (hvl) and fiftieth-value layer (fvl). The breast compressed thickness was 4 cm and the lesions iodine density 1%.
Figure 10.
Tomosynthesis reconstructions obtained from Monte Carlo model for the four conditions of Figure 5. The filter thicknesses are indicated in value layers with half-value layer (hvl) and fiftieth-value layer (fvl). The breast compressed thickness was 4 cm and the lesions iodine density 1%.
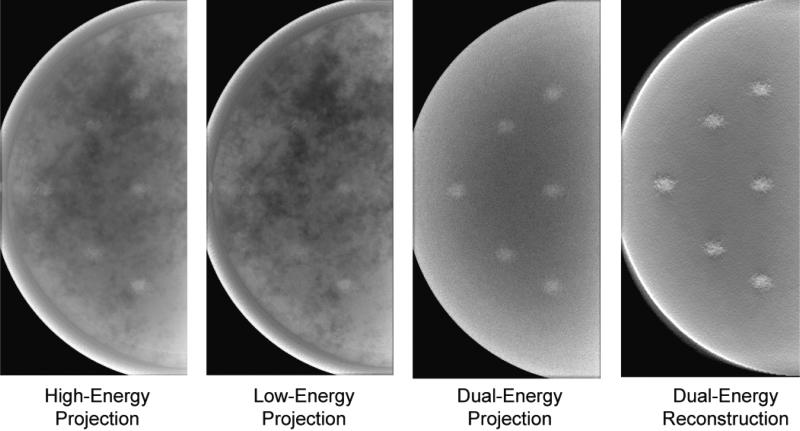
In order to visually demonstrate the impact of the dual-energy imaging, Figure 11 shows tomosynthesis projections and a reconstructed slice for the optimal beam quality identified above. The iodinated lesions are slightly obscured by anatomical noise in the single-energy images, but are more visible in the dual-energy projection as the obscuring anatomy is removed. The lesions are even more conspicuous in the dual-energy reconstructed slice.
Figure 11.
Projection and reconstructed slices for the optimal beam (high-energy tungsten beam at 49 kVp with 92.5 μm of copper filtration and low-energy tungsten beam at 49 kVp with 95 μm of tin filtration). The breast compressed thickness was 4 cm and the lesions iodine density 1%.
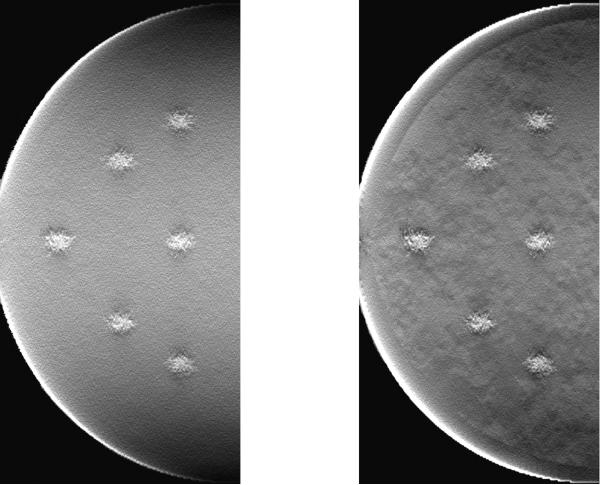
During the research, it was noted that different results were obtained depending on the order in which the dual-energy subtraction and reconstruction were performed. If the reconstruction was done first, substantial artifacts would be present after the dual-energy subtraction (see Figure 12). This likely occurred because of out-of-plane blur from the filtered back-projection reconstruction algorithm. However, if the dual-energy subtraction was performed before the reconstruction, the images were largely free of those artifacts. This finding suggested that in three-dimensional dual-energy imaging techniques, it is important to first apply the dual-energy subtraction and then reconstruct the volume to better minimize anatomical noise.
Figure 12.
Effect of the order in which reconstruction and dual-energy subtraction were performed. Either the image could be first subtracted and then reconstructed (left) or first reconstructed and then subtracted (right). The breast compressed thickness was 4 cm and the lesions iodine density 1%.
IV. DISCUSSION
Dual-energy contrast-enhanced breast tomosynthesis holds promise to provide new and supplemental diagnostic information for improved cancer diagnosis. However, as a new imaging method, its implementation requires careful attention to the acquisition and processing techniques to provide best image quality at lowest radiation dose. In that regard, optimization of beam quality is of paramount importance. This study searched for an optimal beam quality using a ray-tracing method followed by a full Monte Carlo simulation with anthropomorphic breast phantoms and reconstruction. The results indicated optimal SdNR for a high-energy tungsten beam at 49 kVp with a 92.5-μm-thick copper filtration and a low-energy tungsten beam at 49 kVp with 95-μm-thick tin filtration. The fact the optimal performance can be achieved at the same kVp provides a significant technical advantage as sequential images do not require kVp switching and the associated complexities.
There has been limited previous work examining the effect of beam quality on dual-energy contrast-enhanced breast tomosynthesis. Two studies considered the optimal spectra for a cesium-iodide based detector. One used a ray-tracing method and found the optimal high-energy spectra of 60 kVp tungsten filtered by 0.4 mm Ce and the low-energy of 60 kVp tungsten filtered by 0.6 mm Sn.7 Although the current study did not examine 60 kVp beams, this result is similar to the current study in highlighting the importance of using higher kVp beams. As the dual-energy subtraction removes the majority of the anatomical noise, the optimal technique needs to minimize the quantum noise per dose, which would encourage the use of higher energy beams. A second prior study used phantoms and only examined Mo/Mo, Mo/Rh, Rh/Rh, and Mo/Cu beams. It found the optimal beam pair consisted of a 27 kVp Rh/Rh beam and a 49 kVp Mo/Cu beam.9, 10 However, it is unclear which kVps were studied in the optimization parameter space and the theoretical optimization did not include anatomical noise.
Another prior study used ray-tracing and phantoms and examined the optimal beam spectra for a photon-counting detector system.8 That study considered tungsten beams at 45 and 49 kVp filtered with various thicknesses of copper, tin, and iodine. It found similar results between 45 and 49 kVp, but the optimal filter thicknesses depended on whether the background was a flat-field or structured background; acceptable results were obtained with 0.212 mm Cu filtration and 0.356 mm Sn filtration. That study agrees with this work in the choice of beam energy and filter material, but is slightly different in terms of filter thicknesses. This work considered filter thicknesses of only up to a fiftieth-value-layer due to tube loading concerns. In summary, the current study differed from previous work in that it searched a larger parameter space of beam energies, filter materials, and filter thicknesses. It also differed from other studies in that it included anatomical noise in its computational simulation, which increased the realism of the model. Nonetheless, the results largely agreed with the preliminary conclusions of Carton, et al,8 the one study which considered similar tungsten beam qualities, although the current study searched a larger parameter space to reach its conclusions.
This optimization study included both anatomical and quantum noise sources. This was critical as a dual-energy subtracted image will always have higher quantum noise than a single energy image, even though dual-energy imaging offers a reduction in the overall noise in the image because of the reduction in anatomical noise. Both noise sources impede mass detection, but several prior studies have indicated that anatomical noise can have a greater impact on lesion detection than quantum noise.37 This suggests that the figures of merits for future breast dual-energy optimizations must account for anatomical noise in order to provide more generalizable results.
Both dual-energy and tomosynthesis techniques offer advantages in terms of reduction in anatomical noise. As such it may be argued that their combination might not be necessary. Indeed if dual-energy can sufficiently remove anatomical clutter, the reason for tomosynthesis can be questioned. In fact, as seen in the optimized techniques shown in Figures 7 and 8, adjusting for dose differences, dual energy mammography provides an SDNR of 4.5 compared to 3.7 for tomosynthesis. However, the primary reason tomosynthesis was envisioned in this study was to provide a three dimensional framework within which a suspicious lesion may be located. As such, an optimized combination of the two techniques in the context of a dynamic contrast-enhanced examination protocol may provide the best advantages of the two methods in offering the desired temporal, spatial, and dose performance.
Notwithstanding the findings, this work has several limitations. This work relied on simulations assuming certain tissue composition, glandular density, and breast thickness. Further studies are needed to expand the scope of the simulation to different breast conditions and to further verify that these simulation results extend to clinical situations. Second, this work only examined one reconstruction algorithm. Different reconstruction algorithms may produce slightly different results even though there was concordance between projection and reconstruction findings. Third, this study used mass SdNR to estimate conspicuity. Future studies should investigate perceptually-based methods as different noise textures have different impact on the human visual system. Fourth, this study investigated one breast thickness. Thicker breasts would lead to greater levels of beam hardening. Even so, as this effect should be muted by the use of a higher energy beam, it is unlikely the results will change for thicker breasts. Fifth, the optimal results occurred for the maximum energies and thicknesses investigated. However, given the fact that mammography machines currently do not operate beyond 49 kVp, we limited our study to that kVp range. Furthermore, thicker filters will indeed harden the beam further and thus separate the mean energies of the two techniques further away from one another. That would lead to higher performance of the dual energy technique. However, thicknesses beyond what we examined in the study would render the imaging technique impractical, due to needed increased mAs and tube loading to achieve the desired detector signal. Notwithstanding these limitations, this work provides a framework for assessing the impact of beam quality on mass conspicuity in dual-energy contrast-enhanced breast tomosynthesis and offers an optimized acquisition technique.
V. CONCLUSIONS
Dual-energy contrast-enhanced tomosynthesis shows promise in enhancing subtle masses and revealing functional information about suspicious regions for high-risk women. This study simulated a breast tomosynthesis system using ray-tracing and Monte Carlo techniques with anthropomorphic phantoms to find the radiographic beam quality that optimizes mass SdNR. The results indicated optimal tungsten beam qualities at 49 kVp, with the high-energy beam filtered by 92.5 μm of copper and the low-energy tungsten beam filtered by 95 μm of tin.
Table V.
Summary of dual energy subtraction parameters for beams investigated with the Monte Carlo model. All beams modeled a tungsten anode operated at 49 kVp.
| High Energy Beam | Low Energy Beam | Combination Parameters | |||
|---|---|---|---|---|---|
| Filter Material | Thickness (mm) | Filter Material | Thickness (mm) | Weighting factor w | Dose Distribution ε |
| Copper | 0.0925 | Tin | 0.0950 | 0.61 | 0.54 |
| Copper | 0.0925 | Tin | 0.0055 | 0.64 | 0.50 |
| Tin | 0.0950 | Copper | 0.0080 | 1.12 | 0.46 |
| Copper | 0.0080 | Tin | 0.0055 | 0.94 | 0.50 |
ACKNOWLEDGMENTS
The authors wish to thank Brian Harrawood for computational support as well as Joseph Lo and Swatee Singh for their advice on tomosynthesis acquisition and reconstruction. This work was supported in part by grants from the Komen Foundation (PDF55806), the Prevent Cancer Foundation, and the NIH (NCI R21 CA124584-01).
APPENDIX
For a given line y = α χ + β, the linear regression for the parameters a and b is (Wolfram Mathworld)
| (8) |
Solving for the parameter in the line
| (9) |
leads to
| (10) |
Plugging the fitted into Equation 5 leads to
| (11) |
which is simplified to Equation 6:
| (12) |
Contributor Information
Ehsan Samei, Carl E. Ravin Advanced Imaging Laboratories Departments of Radiology, Biomedical Engineering, Physics, and Medical Physics Duke University Durham, NC 27705.
Robert S. Saunders, Jr., Carl E. Ravin Advanced Imaging Laboratories Department of Radiology Duke University Medical Center Durham, NC 27705
REFERENCES
- 1.Robson M, Offit K. Management of an Inherited Predisposition to Breast Cancer. N. Engl. J. Med. 2007;357:154–162. doi: 10.1056/NEJMcp071286. [DOI] [PubMed] [Google Scholar]
- 2.National Comprehensive Cancer Network [July 25, 2007];Clinical practice guidelines in oncology: genetic/familial high-risk assessment: breast and ovarian. 2007 Version 1.2007 Available at: http://www.nccn.org/professionals/physician_gls/PDF/genetics_screening.pdf.
- 3.National Institute for Health and Clinical Excellence [July 25, 2007];Familial breast cancer: the classification and care of women at risk of familial breast cancer in primary, secondary and tertiary care. CG 41. 2006 Available at: http://www.nice.org.uk/guidance/cg41.
- 4.Saslow D, Boetes C, Burke W, Harms S, Leach MO, Lehman CD, Morris E, Pisano E, Schnall M, Sener S, Smith RA, Warner E, Yaffe M, Andrews KS, Russell CA, G., for the American Cancer Society Breast Cancer Advisory American Cancer Society Guidelines for Breast Screening with MRI as an Adjunct to Mammography. CA. Cancer J. Clin. 2007;57:75–89. doi: 10.3322/canjclin.57.2.75. [DOI] [PubMed] [Google Scholar]
- 5.Buist DSM, Porter PL, Lehman C, Taplin SH, White E. Factors Contributing to Mammography Failure in Women Aged 40-49 Years. J. Natl. Cancer Inst. 2004;96:1432–1440. doi: 10.1093/jnci/djh269. [DOI] [PubMed] [Google Scholar]
- 6.MARIBS Study Group Screening with magnetic resonance imaging and mammography of a UK population at high familial risk of breast cancer: a prospective multicentre cohort study (MARIBS) The Lancet. 2005;365:1769–1778. doi: 10.1016/S0140-6736(05)66481-1. [DOI] [PubMed] [Google Scholar]
- 7.Glick SJ, Didier C. A computer simulation for evaluating dual-energy, contrast-enhanced breast tomosynthesis. Proc. SPIE. 2007;6510:65102V–65107. [Google Scholar]
- 8.Carton A-K, Lindman K, Ullberg C, Francke T, Maidment ADA. Dual-energy subtraction for contrast-enhanced digital breast tomosynthesis. Proc. SPIE. 2007;6510:651007–651012. [Google Scholar]
- 9.Puong S, Patoureaux F, Iordache R, Bouchevreau X, Muller S. Dual-energy contrast enhanced digital breast tomosynthesis: concept, method, and evaluation on phantoms. Proc. SPIE. 2007;6510:65100U–65112. [Google Scholar]
- 10.Puong S, Bouchevreau X, Duchateau N, Iordache R, Muller S. Optimization of beam parameters and iodine quantification in dual-energy contrast enhanced digital breast tomosynthesis. Proc. SPIE. 2008;6913:69130Z–69111. [Google Scholar]
- 11.Nock ML, Kempston MP, Mainprize JG, Yaffe MJ. Quantitative flow phantom for contrast-enhanced breast tomosynthesis. Proc. SPIE. 2007;6510:65102W–65111. [Google Scholar]
- 12.Carton A-K, Li J, Albert M, Chen S, Maidment ADA. Quantification for contrast-enhanced digital breast tomosynthesis. Proc. SPIE. 2006;6142:61420D–61411. [Google Scholar]
- 13.Chen SC, Carton A, Albert M, Conant EF, Schnall MD, Maidment AD. Initial Clinical Experience With Contrast-Enhanced Digital Breast Tomosynthesis. Acad. Radiol. 2007;14:229. doi: 10.1016/j.acra.2006.10.022. [DOI] [PMC free article] [PubMed] [Google Scholar]
- 14.Saunders R, Samei E, Badea C, Yuan H, Ghaghada K, Qi Y, Hedlund LW, Mukundan S. Optimization of dual energy contrast enhanced breast tomosynthesis for improved mammographic lesion detection and diagnosis. Proc. SPIE. 2008;6913:69130Y–69111. [Google Scholar]
- 15.Forsythe GE, Malcolm MA, Moler CB. Computer methods for mathematical computations. Prentice-Hall; Englewood Cliffs, N.J.: 1977. [Google Scholar]
- 16.Brent RP. Algorithms for minimization without derivatives. Prentice-Hall; Englewood Cliffs, N.J.: 1972. [Google Scholar]
- 17.Chen B B, Shorey J, Nolte L, Saunders RS, Thompson J, Richard S, Samei E. An anthropomorphic breast model for breast imaging simulation and optimization. Academic Radiology. 2011 doi: 10.1016/j.acra.2010.11.009. in press. [DOI] [PubMed] [Google Scholar]
- 18.National Institute of Standards and Technology . Protons, and Helium Ions. Washington, DC: 1992. ESTAR, PSTAR, and ASTAR: Computer Programs for Calculating Stopping-Power and Ranges for Electrons. NISTIR-4999. [Google Scholar]
- 19.Bender JE, Kapadia AJ, Sharma AC, Tourassi GD, Harrawood BP, Floyd JCE. Breast cancer detection using neutron stimulated emission computed tomography: Prominent elements and dose requirements. Med. Phys. 2007;34:3866–3871. doi: 10.1118/1.2775669. [DOI] [PubMed] [Google Scholar]
- 20.Beckett JR, Kotre CJ. Dosimetric implications of age related glandular changes in screening mammography. Phys. Med. Biol. 2000;45:801–813. doi: 10.1088/0031-9155/45/3/316. [DOI] [PubMed] [Google Scholar]
- 21.Dance DR, Skinner CL, Young KC, Beckett JR, Kotre CJ. Additional factors for the estimation of mean glandular breast dose using the UK mammography dosimetry protocol. Phys. Med. Biol. 2000;45:3225–3240. doi: 10.1088/0031-9155/45/11/308. [DOI] [PubMed] [Google Scholar]
- 22.Klein R, Aichinger H, Dierker J, Jansen JT, Joite-Barfuss S, Sabel M, Schulz-Wendtland R, Zoetelief J. Determination of average glandular dose with modern mammography units for two large groups of patients. Phys. Med. Biol. 1997;42:651–671. doi: 10.1088/0031-9155/42/4/004. [DOI] [PubMed] [Google Scholar]
- 23.Hubbell J, Seltzer SM. Tables of X-Ray Mass Attenuation Coefficients and Mass Energy-Absorption Coefficients. National Institute of Standards and Technology; Gaithersburg, MD: 2004. [January 20, 2006]. Available at: http://physics.nist.gov/xaamdi. [Google Scholar]
- 24.Boone JM. Normalized glandular dose (DgN) coefficients for arbitrary X-ray spectra in mammography: computer-fit values of Monte Carlo derived data. Med. Phys. 2002;29:869–875. doi: 10.1118/1.1472499. [DOI] [PubMed] [Google Scholar]
- 25.Boone JM, Fewell TR, Jennings RJ. Molybdenum, rhodium, and tungsten anode spectral models using interpolating polynomials with application to mammography. Med. Phys. 1997;24:1863–1874. doi: 10.1118/1.598100. [DOI] [PubMed] [Google Scholar]
- 26.Sempau J, Fernandez-Varea JM, Acosta E, Salvat F. Experimental benchmarks of the Monte Carlo code PENELOPE. Nucl Instrum Methods B. 2003;207:107–123. [Google Scholar]
- 27.Badano A, Sempau J. MANTIS: combined x-ray, electron and optical Monte Carlo simulations of indirect radiation imaging systems. Phys. Med. Biol. 2006;51:1545–1561. doi: 10.1088/0031-9155/51/6/013. [DOI] [PubMed] [Google Scholar]
- 28.Badano A, Kyprianou IS, Sempau J. Anisotropic imaging performance in indirect x-ray imaging detectors. Med. Phys. 2006;33:2698. doi: 10.1118/1.2208925. [DOI] [PubMed] [Google Scholar]
- 29.Alejandro SC, Pedro A, Stig AL. Positron flight in human tissues and its influence on PET image spatial resolution. European Journal of Nuclear Medicine and Molecular Imaging. 2004;V31:44. doi: 10.1007/s00259-003-1330-y. [DOI] [PubMed] [Google Scholar]
- 30.Cot A, Sempau J, Pareto D, Bullich S, Pavia J, Calvino F, Ros D. Evaluation of the geometric, scatter, and septal penetration components in fan-beam collimators using Monte Carlo simulation. Nuclear Science, IEEE Transactions on. 2002;49:12. [Google Scholar]
- 31.Bissonnette M, Hansroul M, Masson E, Savard S, Cadieux S, Warmoes P, Gravel D, Agopyan J, Polischuk B, Haerer W, Mertelmeier T, Lo JY, Chen Y, Dobbins JT, III, Jesneck JL, Singh S. Digital breast tomosynthesis using an amorphous selenium flat panel detector. Proc. SPIE. 2005;5745:529. [Google Scholar]
- 32.Zhao W, Zhao B, Fisher PR, Warmoes P, Mertelmeier T, Orman J. Optimization of detector operation and imaging geometry for breast tomosynthesis. Proceedings of Medical Imaging 2007: Physics of Medical Imaging. 2007:65101M–65112. [Google Scholar]
- 33.Ruschin M, Timberg P, Bth M, Hemdal B, Svahn T, Saunders RS, Samei E, Andersson I, Mattsson S, Chakraborty DP, Tingberg A. Dose dependence of mass and microcalcification detection in digital mammography: Free response human observer studies. Med. Phys. 2007;34:400. doi: 10.1118/1.2405324. [DOI] [PMC free article] [PubMed] [Google Scholar]
- 34.Jamal N, Ng KH, McLean D. A study of mean glandular dose during diagnostic mammography in Malaysia and some of the factors affecting it. Br. J. Radiol. 2003;76:238–245. doi: 10.1259/bjr/66428508. [DOI] [PubMed] [Google Scholar]
- 35.Bloomquist AK, Yaffe MJ, Pisano ED, Hendrick RE, Mawdsley GE, Bright S, Shen SZ, Mahesh M, Nickoloff EL, Fleischman RC, Williams MB, Maidment AD, Beideck DJ, Och J, Seibert JA. Quality control for digital mammography in the ACRIN DMIST trial: part I. Med. Phys. 2006;33:719–736. doi: 10.1118/1.2163407. [DOI] [PubMed] [Google Scholar]
- 36.Mertelmeier T, Orman J, Haerer W, Dudam MK. Optimizing filtered backprojection reconstruction for a breast tomosynthesis prototype device. Proc. SPIE. 2006;6142:61420F. [Google Scholar]
- 37.Samei E, Flynn MJ, Eyler WR. Detection of subtle lung nodules: Relative influence of quantum and anatomic noise on chest radiographs. Radiology. 1999;213:727–734. doi: 10.1148/radiology.213.3.r99dc19727. [DOI] [PubMed] [Google Scholar]


