

Abstract
Motivation: Piwi-interacting RNA (piRNA) is the most recently discovered and the least investigated class of Argonaute/Piwi protein-interacting small non-coding RNAs. The piRNAs are mostly known to be involved in protecting the genome from invasive transposable elements. But recent discoveries suggest their involvement in the pathophysiology of diseases, such as cancer. Their identification is therefore an important task, and computational methods are needed. However, the lack of conserved piRNA sequences and structural elements makes this identification challenging and difficult.
Results: In the present study, we propose a new modular and extensible machine learning method based on multiple kernels and a support vector machine (SVM) classifier for piRNA identification. Very few piRNA features are known to date. The use of a multiple kernels approach allows editing, adding or removing piRNA features that can be heterogeneous in a modular manner according to their relevance in a given species. Our algorithm is based on a combination of the previously identified features [sequence features (k-mer motifs and a uridine at the first position) and piRNAs cluster feature] and a new telomere/centromere vicinity feature. These features are heterogeneous, and the kernels allow to unify their representation. The proposed algorithm, named piRPred, gives promising results on Drosophila and Human data and outscores previously published piRNA identification algorithms.
Availability and implementation: piRPred is freely available to non-commercial users on our Web server EvryRNA http://EvryRNA.ibisc.univ-evry.fr
Contact: tahi@ibisc.univ-evry.fr
1 INTRODUCTION
Using computational approaches is a practical manner to identify potential non-coding RNAs (ncRNAs), which can be experimentally studied further. Many methods have been developed for the in silico prediction of several types of ncRNAs such as microRNAs (miRNAs).
The Piwi protein-interacting RNA (piRNA) is the most recently discovered and the least characterized class of Argonaute (Ago)/Piwi protein-interacting small ncRNA. Unlike the broad expression of miRNA in most cells and tissue types, piRNA expression is highly enriched in the germline. Like miRNA, piRNA molecules are associated with proteins of the Ago/Piwi family to execute sequence-specific gene silencing. Additionally, piRNA molecules may fine-tune gene expression by mediating epigenetic modifications of heterochromatin. The germline-enriched expression pattern and the finding that mutating the piRNA biogenesis pathway resulted in sterility demonstrated the critical impact of the Piwi–piRNA pathway exert on germline development and function (Carmell et al., 2007; Deng and Lin, 2002; Kuramochi-Miyagawa et al., 2004). In addition to their activity in the germline, accumulating recent data have suggested piRNA expression and biological activity in somatic cells as well, and recent discoveries suggest the involvement of piRNAs in diseases such as cancer (Mei et al., 2013). Therefore, an updated vision suggests a wider definition of piRNA expression and biological function in both germline and somatic cells (Peng and Lin, 2013; Ross et al., 2014).
The piRNAs are the largest and most heterogeneous class of the small ncRNA family, exceeding 2 million distinct piRNA species in the mouse (Lau et al., 2006). Initial identification and characterization of mammalian piRNAs were achieved by experimental approaches that combined the isolation of Piwi protein-interacting sequences and/or deep sequencing of germline-enriched short RNA sequences (Aravin et al., 2006; Girard et al., 2006; Watanabe et al., 2006). Although this methodology appeared productive, it could not exhaustively cover the entire repertoire of piRNA molecules in a specific organism. In particular, tissue-specific and low copy number-expressed piRNA could not be fully detected using this methodology.
Unlike miRNAs, piRNAs lack clear secondary structure motifs, and primary sequence conservation, except for enrichment for the presence of a uridine nucleotide at the 5′ first position of the transcript (Le Thomas et al., 2014). One hallmark characteristic of piRNA sequences, that are of 24–35 nt of length, is that most of them are encoded in genome clusters ranging from 1 to >100 kb long. There are both monodirectional clusters encoding piRNAs on one strand, and bidirectional clusters whose halves encode piRNAs on opposite strands and whose transcription starts in the opposite direction from a centrally located promoter (Brennecke et al., 2007; Lau et al., 2006). Brennecke et al. have also reported that in Drosophila, piRNAs have the tendency to be expressed near telomere and centromere regions on the chromosome (Brennecke et al., 2007; Le Thomas et al., 2014).
The lack of conserved characteristics makes the identification of piRNAs by computational methods a difficult challenge. Only a few methods have been developed to predict piRNAs. These methods can be classified into two classes. The first one uses a linear classification algorithm to predict individual piRNAs (Zhang et al., 2011), and the second one is based on clustering approaches to predict piRNA clusters from RNAseq sequences (Jung et al., 2014; Rosenkranz and Zischler, 2012). Zhang et al. group proposed a method based on the use of k-mer strings for the identification of motifs in piRNA sequences. All the 1–5 nt strings are considered, including 4 1-mer strings (A, C, G and T), 16 2-mer strings, 64 3-mer strings, 256 4-mer strings and 1024 5-mer strings. A total of 1364 strings are obtained and used for classifying piRNA and non-piRNA sequences. Two algorithms have been proposed for predicting piRNA clusters from RNAseq data: proTRAC (Rosenkranz and Zischler, 2012) and piClust (Jung et al., 2014). The proTRAC algorithm is based on a statistical probabilistic analysis. It analyzes mapped sequence reads and identifies clusters based on significant deviations from a uniform piRNA distribution, using different types of information, including the density of mapped reads, strand asymmetry, frequency of putative piRNA loci with U at the first position of the sequence, or A at Position 10. On the other hand, the piClust algorithm uses a density-based clustering approach without assuming any parametric distribution and considers the actual interdistance between mapped reads for the determination of clustering, with results that were claimed to outperform the proTRAC algorithm.
Taken together, previous piRNA prediction algorithms were based on the following features: (i) transcript length of 24–35 nt, (ii) nucleotide bias at Position 1 of G expression, (iii) localization in clusters and (iv) differential frequencies of certain k-mer sequences. To the best of our knowledge, however, none of the previous publications have attempted to combine all of these features together. Exploiting all these features could improve the results obtained by the existing algorithms.
In this article, we propose a computational approach to combine heterogeneous types of piRNA features. We developed a machine learning method based on the fusion of multiple kernels and support vector machines (SVMs) (Vapnik, 1995), a well-known machine learning method that has been widely used in diverse areas of bioinformatics. SVM is a kernel-based learner, which can find non-liner boundaries between data classes by using kernels. Using kernel methods makes it possible to represent the original data by using a matrix representation, called a kernel matrix. Symmetric positive definite kernel matrices encode the similarity between sequences in their respective input space. This implies that the heterogeneous features can all be replaced by appropriately kernel matrices. This allows the elimination of the data heterogeneity. Constructing the same representation for all datasets and integrating these representations is the main intuition behind kernel fusion methods. In recent years, several machine learning methods have been proposed to exploit different information sources using kernels (Gönen and Alpayd, 2011). Research in multiple kernel learning (MKL) has focused on both developing new formulations as well as optimizing them. Different formulations are required to address the needs of different applications. Most of the methods using these formulations propose to learn the combined kernels by tuning automatically the kernel weights (Gönen and Alpayd, 2011). Early work focused on learning the kernel as a linear combination of given base kernels (Lanckriet et al., 2004). Non-linear kernel combinations (Cortes et al., 2009), such as products of kernels and mixtures of polynomials, have also been shown to be appropriate in certain domains. Many of these formulations can be easily cast in the generalized MKL (GMKL) framework proposed in (Varma and Babu, 2009).
In the piRNA prediction problem, the use of multiple kernels makes it possible to propose a modular and extensible method. Thus, new kernels representing newly discovered piRNA characteristics can easily be added. Because the research on piRNAs is at its beginning, it is important to have methods that can integrate new knowledge about this RNA. The multiple kernel method also has the advantage of allowing exploration of characteristics, even when these are not yet validated, which is helpful in this context. Thus, it could be possible to ignore an implemented kernel if it turns out not to be useful and/or corresponds to a false knowledge. Our method is therefore adaptive, the user being able to consider the appropriate kernels according to the data type and studied species.
To summarize, we have developed an extensible and adaptive classification method for piRNA prediction, which is distinct from the existing methods in several aspects: (i) several kernels that represent heterogeneous feature sets are built and used, (ii) a new type of feature is explored, (iii) the characteristic of piRNAs to occur in clusters on the chromosome is coded in a kernel to use it in a supervised way and (iv) a non-linear classifier approach is used, which is more suitable for real-world data.
Here we describe our multiple kernel-based SVM algorithm, called piRPred, and we report the results that we have obtained, that are promising.
2 METHODS
We have developed a new classification tool to identify piRNAs. Our algorithm takes as input a set of sequences, and returns for each sequence 1 if it is a piRNA, and 0 if not.
A very important step in machine learning classifiers is the feature characterization. In the present version of our algorithm, we use four principal piRNA features, one of which has not yet been exploited in any computational method. To deal with the heterogeneity of the features, we use different kernels to represent them. Each class of features corresponds to one kernel. To perform the classification, we use two approaches. In the first one, we simply average the kernels and then use the SVM. In the second one, we use a multiple kernel formulation of the SVM that can learn automatically the weights of each kernel.
2.1 piRNA features and kernel description
One principal reason for difficulty in predicting piRNAs is their lack of conservation in structure and sequence. PiRNAs are very diverse: hundreds of thousands of unique piRNA sequences do not show any structure or sequence motif similarities, except for a bias for a uridine residue at the first base (Le Thomas et al., 2014). The other known and admitted characteristic of piRNAs is that they appear in clusters on the genome. This is why the tentative for computational methods for piRNA identification are methods that predict clusters of piRNAs (Jung et al., 2014; Rosenkranz and Zischler, 2012). In Brennecke et al. (2007), it is also stated that in Drosophila, piRNA clusters can span up to 200 kb and are located in pericentromeric and subtelomeric regions. Finally, it has been shown in (Zhang et al., 2011) that a set of k-mer motifs have different frequencies in piRNA and non-piRNA sequences. Thus, in the present version of our algorithm, we consider the following features:
The frequency of certain k-mer motifs.
The presence of a uridine base at the first position of the sequence.
The distance to centromeric and telomeric regions of the chromosome.
The occurrence of piRNAs in clusters on the genome.
We define three kernels: one kernel representing the two first features, and two kernels representing the third and the fourth kernels, respectively. Each kernel is a square similarity matrix of size , N being the size of the training dataset (including positive and negative samples), and the building process is performed as following: for each sequence, we built a vector (or a matrix) representing the feature. A square distance matrix is then constructed by calculating the Euclidian distances between the vectors (or Frobenius distances between matrices). From this matrix, we calculate the Gaussian kernel:
| (1) |
The estimation of the value of γ is done using the method described below in Section 2.3.
2.1.1 K-mer string and uridine position
K-mers refer to specific k-tuple or k-grams of nucleic acid or amino acid sequences that can be used to identify certain regions within biomolecules. To characterize piRNA sequences, we consider k-mer strings, as performed by (Zhang et al., 2011). We make use of the results obtained by Zhang et al., which indicate that 32 k-mer stings (2 4-mer and 30 5-mer) are differentially present in piRNA and non-piRNA sequences. We thus calculated, for each sequence, a vector containing the frequencies of these 32 k-mers in the sequence.
To this kernel, we added information about the presence or the absence of a uridine base at the first position of the sequence. We consider this piRNA characteristic as a learning feature instead of a filter to avoid eliminating the sequences that do not present this characteristic. Not all piRNAs present this characteristic; we analyzed the piRNA sequences of Human and Drosophila available in piRNABank (Lakshmi and Agrawal, 2008; http://pirnabank.ibab.ac.in/), and, respectively, 79.68 and 65.93% of Human and Drosophila piRNAs have a uridine at their first position. Each sequence is then represented by a vector of 33 dimensions: the first dimension represents the information on the uridine base, and the other 32 dimensions represent the k-mer frequencies. We then compute a Gaussian kernel using these vectors.
2.1.2 Distances to pericentromeric and subtelomeric regions
The second kernel corresponds to the distance of the sequence to the pericentromeric and subtelomeric regions of the genome. We built a 4D feature vector, which represents the distance to each of these regions on each strand of each chromosome (see Fig. 1): the distance to the first telomere (t1), the distance to the second telomere (t2), the distance to one side of the centromere (c1) and the distance to the other side of the centromere (c2).
Fig. 1.
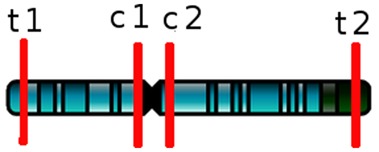
A chromosome with telomeric and centromeric regions
When the sequence is in a telomeric or centromeric region, the value of the distance is infinity, as well as when the sequence is not in the analyzed strand and chromosome. When a sequence appears in different positions in the genome, the minimal value for each of the four distances is used. The Gaussian kernel is then calculated with these minimal values.
2.1.3 piRNA clusters using k-nearest neighbor sequences
To take into consideration the cluster location on the chromosome of piRNAs in a supervised manner, we propose a new kernel, which takes into account the neighbors of each sequence in the genome. The neighbors in our approach represent the closest sequences that are located on the same chromosome as the target sequence and contained in the training set. We propose to find the k-nearest neighbors of each sequence and then to construct a matrix containing the distances between all the sequences (the target sequence and its k-nearest neighbors). Each matrix represents a density ‘context’ of a target sequence in the training set without using the labels of the neighbors. We then compute the Frobenius distances between the obtained matrices, and a Gaussian kernel is computed using these distances.
The value of k depends on the number of piRNAs contained in a cluster. This value is variable. Cluster size varies between two and several hundred (Girard et al., 2006). By default, we set this value to 4 (see Section 3.5). It is, however, a parameter that can be changed by the user.
2.2 SVM and kernel fusion
The SVM is a widely used classifier in bioinformatics. It is a discriminative classifier proposed for binary classification problems (Vapnik, 1995). It defines a hyperplane that divides the space into two sides according to the sign of a discriminant function. The boundary between regions classified as positives and negatives is called the decision boundary of the classifier. The decision boundary defined by a hyperplane is said to be linear because it is linear in the input examples. A classifier with a linear decision boundary is called a linear classifier. Conversely, when the decision boundary of a classifier depends on the data in a non-linear way, the classifier is said to be non-linear. The SVM chooses the separating hyperplane that maximizes the margin (the hyperplane that leaves as much room as possible between the hyperplane and the closest examples). In addition to performing linear classification, SVM can efficiently perform a non-linear classification using kernels.
Many MKL formulations have been proposed, and some have been proven effective in several applications (Gönen and Alpayd, 2011). The simple way to combine kernels is to use fixed rules without any parameters like computing the mean of the kernels and then applying SVM. The GMKL (Varma and Babu, 2009) is a general purpose optimizer capable of handling a wide range of formulations and admits fairly general kernel parameterization. Jain et al. (2012) propose to speed up GMKL optimization by an order of magnitude in many cases. They achieve this by designing an alternative optimizer based on spectral projected gradient (SPG) descent (Birgin et al., 2000). SPG is particularly well suited to large-scale problems because it builds a coarse approximation efficiently and without any memory overhead. We have used a free SVM software package called LIBSVM (Chang and Lin, 2011) for the averaged kernel approach and the SPG-GMKL software (Jain et al., 2012) for the MKL approach.
2.3 Kernel parameter selection
Determining the kernel parameters for the SVM is a problem in practice. A popular method for defining the kernel parameters is the grid search method (Hsu and Lin, 2002). The classifier is trained with different kernel parameters, and the parameters that provide the best results are chosen. This makes the training process time-consuming, especially when there are large datasets. To avoid this problem, the choices concerning parameter settings are often driven by heuristics. An example of a heuristic is to select the value of γ that should be relative to the variance of the data, but this is rarely the best choice. An alternative to classic grid search is to define the parameter γ using the between-cluster distances in the feature space (Wu and Wang, 2009). For each kernel parameter value, we calculate a distance index and choose the value, which leads to the best separation index. This index represents the separation degree of the classes in the feature space. The between-cluster distances in the sample space is defined by
| (2) |
where and are the positive and negative classes, respectively, and and are sample sizes of and , respectively. The corresponding distance measure in the feature space using the kernel similarity matrix K is:
| (3) |
where
and
3 RESULTS AND DISCUSSION
3.1 Training datasets
We use different sets of positive and negative data to perform the cross-validation and the prediction tests on Human and Drosophila species.
Positive data are taken from piRNABank (Lakshmi and Agrawal, 2008; (http://pirnabank.ibab.ac.in/). The piRNABank currently contains 23 439 and 22 336 non-redundant piRNA sequences of Human and Drosophila genomes, respectively.
We built the negative dataset with non-redundant sequences of several types:
Sequences of size between 25 and 33 nt corresponding to portions at 5′ of transfer RNA (tRNA) sequences, that are taken from tRNA database (http://lowelab.ucsc.edu/GtRNAdb/).
Sequences corresponding to mature miRNAs and taken from miRBase (http://www.mirbase.org/, version 20).
Sequences of size between 25 and 33 nt chosen randomly from the exonic regions of protein-coding genes taken from Ensembl Genes 75 database through Biomart (http://www.ensembl.org/biomart)
The Human negative dataset and the Drosophila negative dataset contain, respectively, 59 947 and 16 243 non-redundant sequences, composed of 590 and 301 sequences of tRNA portions, 2576 and 698 sequences of mature miRNAs and 56 781 and 15 244 sequences of exonic regions.
For training samples, we randomly selected five positive datasets and five negative datasets each composed of 7500 Human sequences, and five positive datasets and five negative datasets each composed of 5000 Drosophila sequences. We also selected randomly 2500 positive sequences for each Human and Drosophila, other than the ones used in the training step, to test our algorithm on classifying new sequences.
Finally, for each sequence, we gathered the following information: the name (id), the nucleotide sequence, the strand (‘+’ or ‘−’), the chromosome ID and the position on the chromosome.
3.2 Measures
To evaluate the classification performance, we use several statistical measures: accuracy ACC, sensitivity SE, specificity SP and positive predictive value PPV. These measures are defined as follows:
Accuracy , which measures the percentage of samples that are correctly classified.
Sensitivity , which measures the accuracy on positive samples.
Specificity , which measures the accuracy on negative samples.
Positive predictive value , which measures the percentage of correctly classified positive samples among all positive-classified ones.
where TP, FP, TN and FN are the numbers of true-positive, false-positive, true-negative and false-negative predictions, respectively.
3.3 Cross-validation results on our training datasets
The evaluation of our method is conducted through a 5-fold cross-validation on Human and Drosophila datasets. Because we have large sets of data, we also performed a 10-fold cross-validation, and the results are similar to the ones obtained with the 5-fold cross-validation. The experiment was repeated five times, considering at each time a matrix containing 7500 (respectively 5000) positive sequences and 7500 (respectively 5000) negative sequences for Human (respectively Drosophila).
The value of γ in the Gaussian kernel (see Section 2) is estimated to 1.73 in Human and 1.79 in Drosophila for the first kernel (k-mer kernel), to 8.73e-17 in Human and 4.67e-17 in Drosophila for the second one (position kernel) and to 4.48e-13 for Human and 5.21e-12 for Drosophila for the third one (k-nearest neighbors kernel).
To evaluate the relevance of the defined kernels, we tested our method using each of the three kernels, and then the combination of the three kernels by the kernels mean method and by the SPG-GMKL method (see Section 2.2). The cross-validation results obtained on our training datasets of Human and Drosophila are given in Table 1. Km represents the kernel implementing the k-mer and the uridine features (see Section 2.1.1), Kd represents the kernel implementing the distance of the sequences from pericentromeric and subtelomeric regions on the chromosome (see Section 2.1.2) and Kn represents the kernel implementing the k-nearest neighbors sequences (see Section 2.1.3). The tool developed by Zhang and collaborators (Zhang et al., 2011), based on the k-mer method, was tested and compared with our method. To test it under the same conditions as our tool, it was re-trained on our datasets, and a 5-fold cross-validation was performed. The results are also given in Table 1. The classification results are evaluated using the measures given above (Section 3.2), and the best score for each measure is given in bold.
Table 1.
Cross-validation results obtained by our method (using different combinations of kernels) and by Zhang et al. method in Human and Drosophila training datasets
| Method |
Human |
Drosophila |
||||||
|---|---|---|---|---|---|---|---|---|
| ACC | SP | SE | PPV | ACC | SP | SE | PPV | |
| Km | 0.76 ± 0.03 | 0.75 ± 0.01 | 0.81 ± 0.01 | 0.75 ± 0.02 | 0.67 ± 0.01 | 0.70 ± 0.02 | 0.65 ± 0.01 | 0.66 ± 0.02 |
| Kd | 0.61 ± 0.02 | 0.55 ± 0.02 | 0.72 ± 0.03 | 0.59 ± 0.01 | 0.86 ± 0.02 | 0.88 ± 0.03 | 0.83 ± 0.01 | 0.86 ± 0.02 |
| Kn | 0.74 ± 0.01 | 0.82 ± 0.02 | 0.67 ± 0.03 | 0.80 ± 0.02 | 0.83 ± 0.03 | 0.82 ± 0.01 | 0.83 ± 0.04 | 0.82 ± 0.01 |
| Km/Kd/Kn mean | 0.81 ± 0.03 | 0.82 ± 0.02 | 0.78 ± 0.03 | 0.81 ± 0.02 | 0.87 ± 0.02 | 0.93 ± 0.01 | 0.81 ± 0.03 | 0.91 ± 0.02 |
| Km/Kd/Kn SPG-GMKL | 0.86 ± 0.02 | 0.84 ± 0.01 | 0.88 ± 0.03 | 0.85 ± 0.02 | 0.89 ± 0.03 | 0.95 ± 0.02 | 0.83 ± 0.03 | 0.94 ± 0.03 |
| Zhang et al. | 0.58 ± 0.05 | 0.82 ± 0.01 | 0.30 ± 0.04 | 0.63 ± 0.03 | 0.69 ± 0.02 | 0.92 ± 0.01 | 0.45 ± 0.02 | 0.85 ± 0.01 |
Note: ACC, accuracy; SP, specificity; SE, sensitivity; PPV, positive predictive value. In bold: The highest value in each column.
As shown in Table 1, the results obtained by piRPred with the SPG-GMKL method as well as with the kernels mean method are >0.8 in almost all measurements for both Human and Drosophila. Our results are clearly better than the ones reported by Zhang et al. Their tool fails on our training datasets, particularly on Human data. The accuracy is close to 0.5, the value of a random classification. Besides, the sensitivity is <0.5 both for Human and Drosophila, which means that it fails to identify positive piRNAs. Interestingly, using just the single Km kernel gives better results than those obtained using Zhang’s method, which confirms the superior performance of our non-linear classifier SVM in comparison with the linear classification method proposed by Zhang et al.
As expected, results are slightly different between Human and Drosophila sequences, reflecting species differences in the used features. This is, for instance, the case of the Kd kernel that produces better results in Drosophila than in Human. This kernel represents the characteristic for piRNA sequences to be close to telomere/centromere regions; characteristic that was reported in Drosophila (Brennecke et al., 2007), but to our knowledge, not (yet?) confirmed in Human. Therefore, it is not clear whether applying this kernel in Human will be beneficial or not. The results obtained in Drosophila demonstrated positive results (values ≥0.82), thus confirming its utility in Drosophila. Somewhat surprisingly, slightly positive results were obtained also in Human (values >0.5), suggesting that distances of piRNAs to telomere and centromere regions are significant (statistically) also in Human, although to a much lower level than in Drosophila. Inversely, Km kernel gives better results in Human than in Drosophila, suggesting better relevance of the corresponding features, i.e. the differential frequencies of certain k-mer motifs and the occurrence of a uridine at the first position. These results agree on one hand with the study we did on the uridine feature (see Section 2.1.1), which shows that the percentage of sequences containing a uridine at the first position is higher in Human than in Drosophila (79.68 and 65.93% respectively), and on another hand with the results published in (Zhang et al., 2011), where a better performance of the k-mer method on Human than on Drosophila was shown. Surprisingly, however, the results obtained by Zhang et al. method, when we retrain it on our data, give completely opposite results. This is probably because our Drosophila training dataset is bigger than the one used by Zhang et al. (composed of 987 sequences), whereas our human training dataset is smaller than the one used by Zhang et al. (composed of 32 046 sequences).
Finally, the combination of the three kernels presents an advantage over each single kernel in almost all measures in both Human and Drosophila, showing a certain relevance of their combination. Besides, using the SPG-GMKL method for combining the kernels is clearly more beneficial than performing a simple mean of the kernels. Therefore, we chose as a model for our piRPred algorithm the one calculated by the SPG-GMKL method.
3.4 Predictive sensitivity on new sequences
For both Human and Drosophila, we investigated our algorithm on 2500 piRNA sequences distinct from the ones used in the training step. Again, this was done in comparison with the Zhang et al. method, for which we tested both the online tool available on the web server (http://122.228.158.106/piRNA/analysis.php), as well as the model obtained after re-training on our datasets. The results are given in Table 2.
Table 2.
Predictive performance of our method (piRPred) on Human and Drosophila sequences in comparison with the Zhang et al. method
| Method |
Human |
Drosophila |
||
|---|---|---|---|---|
| TP | SE | TP | SE | |
| piRPred | 1989 | 0.80 | 2146 | 0.86 |
| Zhang et al. method on web server | 1953 | 0.78 | 1636 | 0.65 |
| Zhang et al. method retrained | 849 | 0.34 | 1568 | 0.63 |
Note: TP, true-positive predictions; SE, sensitivity. In bold: The highest value in each column.
The prediction results obtained by piRPred and by Zhang et al. method are in agreement with those obtained in the cross-validation. They show clearly superior performance of our algorithm. The re-trained version of Zhang et al. method fails completely to predict the given sequences as piRNAs. However, when using the web server version, the results are better. The reason could be because Zhang and collaborators trained their method on a very large set of data (173 090 sequences including 32 046 Human sequences and 987 Drosophila sequences), that probably include the studied sequences.
3.5 Robustness regarding the value of k in the k-nearest neighbors kernel
The value of k in the k-nearest neighbors kernel (Kn) represents the number of piRNAs in a cluster on a chromosome strand. This value is variable, as can be seen in the piRNABank. Some clusters contain only two or three piRNAs on a strand, whereas others contain several hundreds (Girard et al., 2006).
To determine the value of k, we performed several tests, and the results obtained with different values of k are given in Figures 2 and 3. For computational purposes, we decided to choose the smallest value for which the accuracy is maximal. As we can see in both Figures 2 and 3, the accuracy remains fairly stable from the value k = 4. Therefore, we chose the value k = 4 as the default value. In the case of Human, we have also made this choice to improve the specificity, which is low with the other two kernels. As we can see in Figure 2, the specificity is higher than the sensitivity from to and is lower than the sensitivity from . In the case of Drosophila, the four measures are fairly stable for any value of k, from k = 4 (see Figure 3).
Fig. 2.
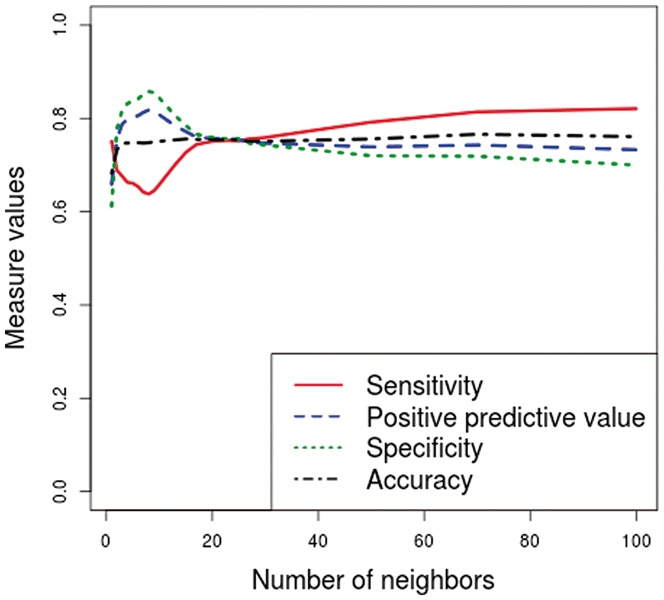
Results obtained by the k-nearest neighbors kernel with different values of k on Human training datasets
Fig. 3.
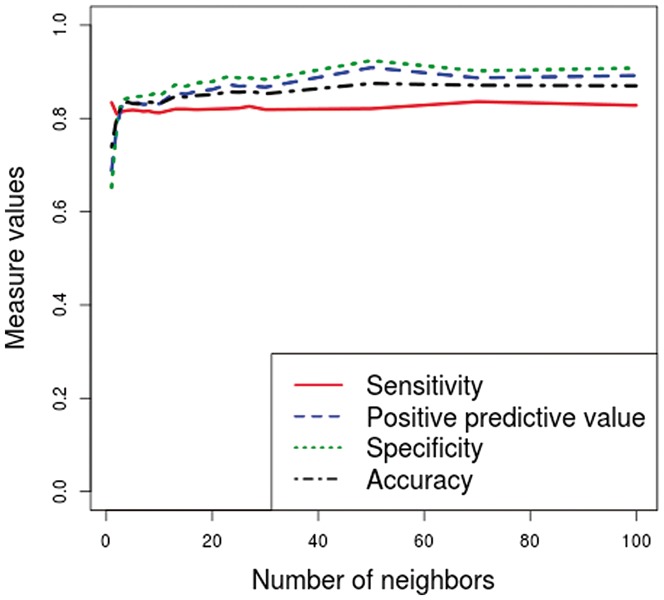
Results obtained by the k-nearest neighbors kernel with different values of k on Drosophila training datasets
This parameter is still tuned by the user, and other choices can be made depending on the features used and on the need to improve the sensitivity or the specificity.
4 CONCLUSION
The present study aimed at the development of a novel algorithm for the identification of piRNA sequences. We propose a multiple kernel fusion and an SVM-based approach that allows to use heterogeneous features, each kernel implementing a class of features. Our approach is therefore modular, extensible and adaptive, allowing the implementation of new features or the use of more appropriate ones (depending on the species). In the context of piRNAs, which have not been studied as extensively as miRNAs, for instance, it is appreciable to be able to take into account new knowledge and discoveries on these RNAs.
Because of the lack of known conserved characteristics of piRNA sequences (except the occurrence of a uridine base at the first position) and structure (there is no known structure for piRNAs), their identification by computational methods is a difficult task. To our knowledge, only one computational method, based on k-mer motifs, has been reported in the literature for piRNA prediction (Zhang et al., 2011). Two other methods have been reported, based on the characteristic of piRNAs to occur in clusters in the genome (Jung et al., 2014; Rosenkranz and Zischler, 2012), which identify piRNA clusters from deep sequencing data.
In the present study, we have provided a few new elements. We have suggested and confirmed a new feature for piRNA identification, which is the distance to telomere/centromere regions, which was reported on Drosophila (Brennecke et al., 2007; Le Thomas et al., 2014). We then tested this feature in combination with previously published features in the context of a modular algorithm, and surprisingly, we were able to identify its utility not only in Drosophila but also in Human. Last, we provide a computational tool for piRNA identification that gives better results than the previously published Zhang et al. method (Zhang et al., 2011).
One of our further perspectives is to continue our investigation by finding other characteristics of piRNAs that would allow us to define new kernels and thus to improve the prediction results. We plan, for instance, to consider a characteristic of piRNA clusters highlighted by a computational analysis performed in the mouse by Betel et al. (2013), who suggest that 25% of piRNA clusters are bracketed by inverted repeats of varying length.
One of our other perspectives for improving our classification results is to perform the training step on all known piRNAs, i.e. on piRNA sequences of piRNABank, and to build kernels with all these sequences. For this classification problem with large training dataset, accuracy, training and testing speed and memory usage are the main concerns. One solution is to combine the SVM to a Nyström methods (Gittens and Mahoney, 2013; Zhang et al., 2012) commonly used to obtain good-quality low-rank approximations of large kernel matrices.
In the present study, we have proposed a new k-nearest neighbors kernel, which represents the cluster structure in the training set. To improve the classification results, we will extend these cluster structure to the test set, using transductive or semi-supervised learning algorithms (Weston et al., 2005). We can also use the labels of the neighbors by exploiting collective classification (Sen et al., 2008) approaches.
Finally, in the present version of piRPred, the input is a set of sequences, with the position of each sequence in the genome, including the ‘+’ or ‘−’ strand, the chromosome ID and the position on the chromosome. The algorithm returns 1 or 0 for each given sequence; 1 if it is predicted as a piRNA, 0 if not. We are currently working on an extension of the input and the output of our algorithm to (i) consider deep sequencing data as input and (ii) return clusters of piRNAs. Thanks to the kernel of k-nearest neighbors, building clusters that contain close piRNA sequences in the genome is feasible.
Funding: This study was financially supported by the Association Française contre les Myopathies (AFM)
Conflict of Interest: none declared.
REFERENCES
- Aravin A, et al. A novel class of small RNAs bind to MILI protein in mouse testes. Nature. 2006;442:203–207. doi: 10.1038/nature04916. [DOI] [PubMed] [Google Scholar]
- Betel D, et al. Computational analysis of mouse piRNA sequence and biogenesis. Cancer Lett. 2013;336:46–52. doi: 10.1371/journal.pcbi.0030222. [DOI] [PMC free article] [PubMed] [Google Scholar]
- Birgin EG, et al. Nonmonotone spectral projected gradient methods on convex sets. SIAM J. Optim. 2000;10(4):1196–1211. [Google Scholar]
- Brennecke J, et al. Discrete small RNA-generating loci as master regulators of transposon activity in Drosophila. Cell. 2007;128:1089–1103. doi: 10.1016/j.cell.2007.01.043. [DOI] [PubMed] [Google Scholar]
- Carmell M, et al. MIWI2 is essential for spermatogenesis and repression of transposons in the mouse male germline. Cell. 2007;12:503–514. doi: 10.1016/j.devcel.2007.03.001. [DOI] [PubMed] [Google Scholar]
- Chang C-C, Lin C-J. LIBSVM: a library for support vector machines. ACM Trans. Intell. Syst. Technol. 2011;2:1–27. [Google Scholar]
- Cortes C, et al. Learning non-linear combinations of kernels. In: Bengio Y, Schuurmans D, editors. Advances in Neural Information Processing Systems (NIPS) 22. 2009. pp. 396–404. [Google Scholar]
- Deng W, Lin H. miwi, a murine homolog of piwi, encodes a cytoplasmic protein essential for spermatogenesis. Dev. Cell. 2002;2:819–830. doi: 10.1016/s1534-5807(02)00165-x. [DOI] [PubMed] [Google Scholar]
- Girard A, et al. A germline-specific class of small RNAs binds mammalian Piwi proteins. Nature. 2006;442:199–202. doi: 10.1038/nature04917. [DOI] [PubMed] [Google Scholar]
- Gittens A, Mahoney MW. Revisiting the Nystrom method for improved large-scale machine learning. In: Dasgupta S, Mcallester D, editors. Proceedings of the 30th International Conference on Machine Learning (ICML-13) Vol. 28. JMLR Workshop and Conference Proceedings; 2013. pp. 567–575. [Google Scholar]
- Gönen M, Alpayd E. Multiple kernel learning algorithms. J. Mach. Learn. Res. 2011;12:2211–2268. [Google Scholar]
- Hsu C-W, Lin C-J. A comparison of methods for multiclass support vector machines. Trans. Neur. Netw. 2002;13:415–425. doi: 10.1109/72.991427. [DOI] [PubMed] [Google Scholar]
- Jain A, et al. Proceedings of the 18th ACM SIGKDD International Conference on Knowledge Discovery and Data Mining. 2012. SPF-GMKL: generalized multiple kernel learning with a million kernels. KDD’12, ACM, New York, NY, USA, pp 750–758. [Google Scholar]
- Jung I, et al. piClust: a density based piRNA clustering algorithm. Comput. Biol. Chem. 2014;50:60–67. doi: 10.1016/j.compbiolchem.2014.01.008. [DOI] [PubMed] [Google Scholar]
- Kuramochi-Miyagawa S, et al. Mili, a mammalian member of piwi family gene, is essential for spermatogenesis. Developmental. 2004;131:839–849. doi: 10.1242/dev.00973. [DOI] [PubMed] [Google Scholar]
- Lakshmi SS, Agrawal S. piRNABank: a web resource on classified and clustered Piwi-interacting RNAs. Nucleic Acids Res. 2008;36:D173–D177. doi: 10.1093/nar/gkm696. [DOI] [PMC free article] [PubMed] [Google Scholar]
- Lanckriet GRG, et al. Learning the kernel matrix with semidefinite programming. J. Mach. Learn. Res. 2004;5:27–72. [Google Scholar]
- Lau N, et al. Characterization of the piRNA complex from rat testes. Science. 2006;313:363–367. doi: 10.1126/science.1130164. [DOI] [PubMed] [Google Scholar]
- Le Thomas A, et al. To be or not to be a piRNA: genomic origin and processing of piRNAs. Genome Biol. 2014;15:204. doi: 10.1186/gb4154. [DOI] [PMC free article] [PubMed] [Google Scholar]
- Mei Y, et al. Novel dimensions of pirnas in cancer. Cancer Lett. 2013;336:46–52. doi: 10.1016/j.canlet.2013.04.008. [DOI] [PMC free article] [PubMed] [Google Scholar]
- Peng J, Lin H. Beyond transposons: the epigenetic and somatic functions of the Piwi-piRNA mechanism. Curr. Opin. Cell Biol. 2013;25:190–194. doi: 10.1016/j.ceb.2013.01.010. [DOI] [PMC free article] [PubMed] [Google Scholar]
- Rosenkranz D, Zischler H. proTRAC–a software for probabilistic piRNA cluster detection, visualization and analysis. BMC Bioinformatics. 2012;13:5. doi: 10.1186/1471-2105-13-5. [DOI] [PMC free article] [PubMed] [Google Scholar]
- Ross R, et al. PIWI proteins and PIWI-interacting RNAs in the soma. Nature. 2014;505:353–359. doi: 10.1038/nature12987. [DOI] [PMC free article] [PubMed] [Google Scholar]
- Sen P, et al. Collective classification in network data. AI Magazine. 2008;29:93–106. [Google Scholar]
- Vapnik VN. The Nature of Statistical Learning Theory. New York, NY, USA: Springer-Verlag; 1995. [Google Scholar]
- Varma M, Babu BR. Proceedings of the 26th Annual International Conference on Machine Learning. 2009. More generality in efficient multiple kernel learning. ICML’09, ACM, New York, NY, USA, pp 1065–1072. [Google Scholar]
- Watanabe T, et al. Identification and characterization of two novel classes of small RNAs in the mouse germline: retrotransposon-derived siRNAs in oocytes and germline small RNAs in testes. Genes Dev. 2006;20:1732–1743. doi: 10.1101/gad.1425706. [DOI] [PMC free article] [PubMed] [Google Scholar]
- Weston J, et al. Semi-supervised protein classification using cluster kernels. Bioinformatics. 2005;21:3241–3247. doi: 10.1093/bioinformatics/bti497. [DOI] [PubMed] [Google Scholar]
- Wu K-P, Wang S-D. Choosing the kernel parameters for support vector machines by the inter-cluster distance in the feature space. Pattern Recognit. 2009;42:710–717. [Google Scholar]
- Zhang K, et al. Scaling up kernel SVM on limited resources: a low-rank linearization approach. In: Lawrence ND, Girolami M, editors. AISTATS of JMLR Proceedings. Vol. 22. 2012. pp. 1425–1434. http://JMLR.org (30 July 2014, date last accessed) [Google Scholar]
- Zhang Y, et al. A k-mer scheme to predict piRNAs and characterize locust piRNAs. Bioinformatics. 2011;27:771–776. doi: 10.1093/bioinformatics/btr016. [DOI] [PMC free article] [PubMed] [Google Scholar]