

Abstract
Motivation: Understanding regulation of transcription is central for elucidating cellular regulation. Several statistical and mechanistic models have come up the last couple of years explaining gene transcription levels using information of potential transcriptional regulators as transcription factors (TFs) and information from epigenetic modifications. The activity of TFs is often inferred by their transcription levels, promoter binding and epigenetic effects. However, in principle, these methods do not take hard-to-measure influences such as post-transcriptional modifications into account.
Results: For TFs, we present a novel concept circumventing this problem. We estimate the regulatory activity of TFs using their cumulative effects on their target genes. We established our model using expression data of 59 cell lines from the National Cancer Institute. The trained model was applied to an independent expression dataset of melanoma cells yielding excellent expression predictions and elucidated regulation of melanogenesis.
Availability and implementation: Using mixed-integer linear programming, we implemented a switch-like optimization enabling a constrained but optimal selection of TFs and optimal model selection estimating their effects. The method is generic and can also be applied to further regulators of transcription.
Contact: rainer.koenig@uni-jena.de
Supplementary information: Supplementary data are available at Bioinformatics online.
1 INTRODUCTION
Understanding regulation mechanisms of a cell is fundamental for biomedical research, and transcription factors (TFs) are the central regulators of gene expression. Through identification of TF binding, the regulatory role of TFs can be inferred. Hence, chromatin immunoprecipitation (ChIP) techniques pulling down DNA fragments binding to the TF were developed and scaled up using microarrays (ChIP-chip) and sequencing techniques (ChIP-seq). Genome-wide data have been produced from this for a large set of TFs and several cell systems stored in larger data repositories [e.g. (Lachmann et al., 2010)]. However the specific cellular context under study usually does not match the experimental background of the deposited data. In addition, TF binding need not necessarily lead to a regulatory impact of the TF, in particular if the target gene is not expressed at all. Hence, computational approaches have been developed using these data to apply it to gene expression data of the studied cells. For instance, Cheng and co-workers (Cheng et al., 2012) used machine learning methods and a linear model to predict regulators explaining gene expression. They used ChIP-seq/ChIP-chip data from the ENCODE project and identified distinctive regulation principles of generic and specific TFs, TFs binding preferentially to CpGs and cell type specificity. Interestingly, their method was challenged when predicting transcription levels of genes under complex cellular control, such as cell cycle genes. ChIP data have been used to compile position-weight matrices, which were used to scan the genome for TF-specific binding motifs (Dunham et al., 2012; Kranz, et al., 2011) independent of the cellular context. However, this method comes along with high false-positive rates. Modelling techniques were applied to filter out such non-functional predictions. Setty et al. (2012) used a sparse linear model explaining gene expression. Their model was based on TF binding site predictions in promoters and miRNAs in the 3′UTR (UTR, untranslated region) aiming to predict regulators leading to glioblastoma tumour formation.
Techniques were designed to elucidate regulation principles between TFs and their putative target genes. The algorithm for the reconstruction of accurate cellular networks [ARACNE (Jang et al., 2013; Margolin et al., 2006)] and the context likelihood of relatedness [CLR (Faith et al., 2007)] both use the transcription level of a TF to estimate its activity by calculating Pearson’s correlation or mutual information to its target genes. ARACNE and CLR were combined and successfully applied to identify target genes for Nrf2 in murine lungs in response to oxidative stress (Taylor et al., 2008). However, there are many steps between mRNA translation of a TF and the actual transcriptional regulation of target genes. The TF can be post-translationally modified, i.e. it can be methylated, ubiquinated or phosphorylated. Phosphorylations are often necessary for dimerization and binding to the target gene’s promoter. It was shown that such modifications can have a substantial impact on TFs regulating their target genes (Filtz et al., 2014; Tootle and Rebay, 2005). The underlying concept that expression of the target genes depends mainly on the mRNA gradients of their regulating TFs is often violated, in particular in higher eukaryotes. It was shown that regulation of TFs on the protein level plays a substantial role for hypoxia-inducible factors (Min et al., 2002) and p53 (Harris et al., 2010). Furthermore, TFs can interact, they can regulate other TFs directly, if a TF binds to a promoter of another regulator, or indirectly, if the expression of modifying enzymes such as kinases is altered. Hence, the expression level of a TF is often not suitable to describe its activity. More suitable readouts are the expression levels of the TF’s targets because all these effects are integrated.
In contrast to previous attempts, we based our predictions on the effects to the direct target genes of the TFs. We estimated the activity of a TF using a global approach, i.e. regarding the regulation of all its target genes. It is to note that this also accounts for the fact that in different cells a TF can have a different impact on its targets (Fig. 1).
Fig. 1.
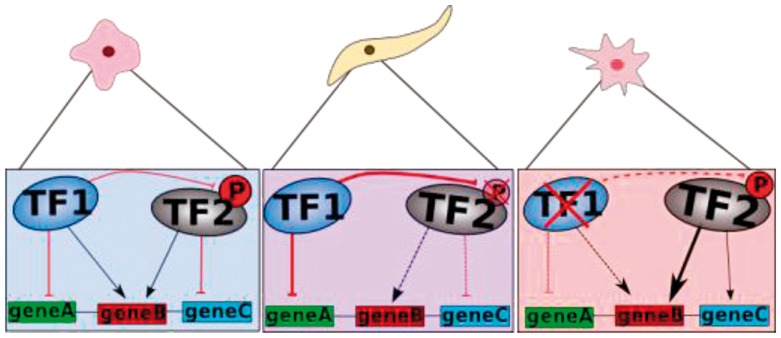
Concept of estimating the activity of a TF. For each sample, the expression of all target genes for a certain TF was used to define the actual activity of this TF
Typically, several TFs can bind to a gene’s promoter and different TFs may compete for binding sites. To model this, we used a linear approach. Similarly to previous studies (Cheng et al., 2012; Dong et al., 2012; Setty et al., 2012), the models were optimized by predicting gene expression based on putative regulators (TFs) and their predicted impact. More than a decade ago, one of the first systems biology approaches was established using constraint-based modelling to integrate stoichiometric equations under equilibrium conditions (Savinell and Palsson, 1992; Schuster et al., 1999). For this, the mathematical concept of mixed-integer linear programming (MILP) was used. Shachar and co-workers used MILP for calculating Steiner trees combining shortest paths in signalling networks of yeast (Shachar et al., 2008). We used the same mathematical concept to assemble signalling and biochemical pathways for recognition of transcriptional patterns (Schramm et al., 2010). Now, we used this technique for elaborated regulation models to elucidate regulation mechanisms. In contrast to a sparse lasso approach, MILP allowed us to (i) get an optimized selection of TFs for a predefined number of parameters and to (ii) use a switching concept, which enabled the optimization algorithm to decide for each TF to be modelled by its cumulative effect on the target genes (activity) or its gene expression level (TF-gene expression). This concept allowed an unbiased and TF-specific comparison of the two approaches.
2 MATERIALS AND METHODS
Statistical analysis and processing of the data were performed using R version 3.0.1 (www.r-project.org). To solve the constraint-based models for the prediction of gene expression, the Gurobi Optimizer 5.5 was used (www.gurobi.com).
2.1 Gene expression data
We implemented and analysed our method using the gene expression profiles of 59 cancer cell lines from the National Cancer Institute (NCI-60 panel). The NCI-60 panel contains 60 cancer cell lines of nine different origins, breast, central nervous system, colon, kidney, leukaemia, lung, melanoma, ovary and prostate (Liu et al., 2010; Shoemaker, 2006). The data were downloaded from CellMiner (Reinhold et al., 2012) and based on an integration of five different microarray platforms (5-Platform, Affymetrix HG-U95, HG-U133, HG-U133 Plus 2.0, GH Exon 1.0 ST and Agilent WHG) yielding a z-score for each gene of each sample [details, see (Reinhold et al., 2012)]. Missing values were replaced by the mean expression values of the according genes. The cell line SF 539 was excluded from our analysis because of a large number (10 404) of not-defined entries. As a second, independent dataset, we used gene expression data of melanoma cells from the study of Hoek et al. (2006). In brief, melanoma cells were released from tissue sections of melanoma metastases. Cells were cultured, total RNA was extracted, labelled and profiled using Affymetrix HG-U133 plus 2.0 oligonucleotide microarrays. The raw intensity signal was normalized using Affymetrix MAS 5.0. Values below 0.01 were set to 0.01 and each value was divided by the 50th percentile of all values in that sample. Each expression value was divided by the median of its values in all samples. Finally, expression values were z-normalized for each gene. For our analysis, we used expression data of 33 samples from the Mannheim cohort [details, see (Hoek et al., 2006)].
2.2 Assembling predefined regulatory interactions
As a basis for inferring TF regulation, we used TF binding information from several sources. From the database MetaCoreTM (http://thomsonreuters.com/metacore/), human TF-target gene interactions annotated as activation and inhibition were used, of both of the categories direct and indirect. Further, we used z-scores of the total binding affinity (TBA), which uses a TF binding profile for the whole promoter based on position weight matrices (Molineris et al., 2011). Human entries of the CHIP Enrichment Analysis (ChEA) database were used, which contained a large set of data from high-throughput ChIP experiments (Lachmann et al., 2010). At the date of use (July 2013), the ChEA database for human comprised 83 TFs, 20 035 genes and 131 996 total entries. In addition, we used ChIP data from the ENCODE project (http://www.genome.gov/Encode/). We used binding information of cell lines for which the most comprehensive set of regulation information was available (Tier 1), i.e. from the cell lines Gm12878, H1 human embryonic stem cells, Hela3, HepG2 and K562. We yielded a binding matrix containing values of ones if binding of a TF to a target gene was listed in Encode and zero otherwise. If a target gene occurred more than once, the according rows were combined to a single row containing consistent hits. If a TF occurred more than once, the according columns were combined to one column using the union of hits. With all these databases, we assembled regulation information for 1120 TFs. A regulatory interaction information between a TF and a target gene was considered to be reliable if (i) this pair was found in Metacore with the annotation ‘direct’ or if (ii) this pair was found in at least two of the datasets Metacore ‘indirect’, ChEA, Encode and TBA with a value ≥1. For these pairs, their putative regulatory interaction called edge strength in the following was set to the number of occurrences of the specific TF–gene pair of the datasets CheA, Metacore direct activation, Metacore direct inhibition, Metacore indirect activation and Metacore indirect inhibition. Furthermore, the TBA value ≥1 was added to the edge strength. For all TF–gene pairs not fulfilling criteria (i) or (ii), the edge strength was set to 0.
2.3 Regulation model
The basic idea was to optimize the model by minimizing the differences between the measured gene expression values gij for genes i expressed in cell line j and the predicted gene expression values , which equalled minimizing the sum of error terms eij:
| (1) |
Optimization criterion:
| (2) |
The absolute value had to be translated into inequalities for the MILP solver yielding two constraints for each gene i and sample j:
| (3) |
| (4) |
Gene expression was predicted using the linear model
| (5) |
in which β0 is an additive offset, T is the number of all TFs analyzed (T = 1120), βt the optimization parameter for TF t, est,i the edge strength of TF t and gene i. efft,j is the estimated effect of TF t in sample j. The calculation of efftj is described below. The TFs were connected to their target genes through est,i, which is exemplarily shown in Figure 2, and to the cell line via their effect efftj. The task of the optimization program (Gurobi 5.5) was to calculate the β-coefficients within the scope given by the constraints to minimize the sum of error terms. The β-coefficients were not constrained and hence could get positive or negative values.
Fig. 2.
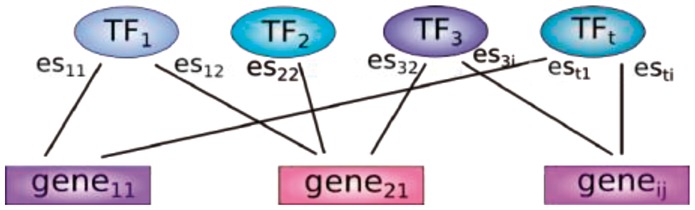
Network of genes and their regulating TFs. Genes and TFs are connected via the edge strength esij
2.4 Calculating the estimated effects of TFs
To model sample-specific effects of a TF, the estimated effects were calculated. Two different definitions were tested:
| (6) |
| (7) |
efft,j was the estimated effect of TF t in sample j, est,i the edge strength between TF t and gene i, gi,j the gene expression of gene i in sample j. Term (6) defines the activity basing on the cumulative effect of a TF on all its target genes, normalized by the sum of all target genes to balance TFs with high and low numbers of target genes. Term (7) defines the effect of a TF just by the gene expression of the TF (TF-gene expression).
2.5 The model switch
To combine the two models of activity and TF-gene expression, we put up a switch in which the solver could choose for each TF which definition of TF effects efft,j to use. For this, further constraints were added to the model. Each efft,j within the sum of (5) was replaced by
| (8) |
| (9) |
The new variables βact,t and βg,t were Boolean variables to select activity (6) or TF-gene expression (7) for each TF in the sum of (5). Constrains
| (10) |
ensured that only one of the definitions was used for each TF.
3 RESULTS
3.1 Distribution of activity and TF-gene expression
Our model based on the assumption that regulatory effects of each of the TFs in the model contribute additively, either by a positive term (activating effect of the TF) or negative term (inhibiting effect). Hence, the activity definition needed to be symmetric and ideally Gaussian distributed. Even though a perfect Gaussian distribution was not seen, we found our activity values showing a rather symmetric distribution, enabling a balanced usability for activation and inhibition (Supplementary Fig. S1a). Similarly, the TF gene expression values were also rather symmetrically distributed (Supplementary Fig. S1b).
3.2 Comparing the prediction performance using activity and TF-gene expression
To get a representative gene set known to be regulated by a larger set of TFs, which, in turn, are known to regulate several target genes, we selected target genes with at least 10 predefined regulatory interactions of TFs that, in turn, are known to regulate at least five genes. This yielded 636 target genes of 521 TFs. For the model, the maximal number of TF coefficients unequal to zero was set to six to avoid overfitting. Overfitting could have occurred when all TFs were used (exemplarily shown in the Supplementary Fig. S5). This restriction was implemented by including further constraints (see Supplementary Method S1). For each investigated gene, a respective regulation model was built. Performing a cross validation (CV) (leave-one-out; leave-one-out cross validation (LOO-CV) was used throughout the study) yielded a distinctively better performance using our activity definition when compared with TF-gene expression for estimating the effect of TFs. For the activity, an average Pearson correlation of prediction and measured expression (from the microarrays) of Pearson Correlation Coefficient PCC r = 0.61 using LOO-CV was obtained. Similar results (PCC r = 0.59) were obtained using a 10-fold CV (with 10 reiterations). To test whether the expression of the target genes influence the prediction performance, we performed the modelling excluding the target gene expression from the calculation of the activity. This resulted in an average PCC of r = 0.59 (10-fold CV). So the effect of including the target gene in the calculation of the activity did not effect the prediction performance. In comparison with the models using the activity, the correlation was only PCC r = 0.41 (LOO-CV) when using TF-gene expression.
3.3 Embedding a model switch
Overall, the activity led to a better performance than just the transcription levels of the TFs. Still, for some TFs, TF-gene expression yielded a better prediction performance than our activity definition. Therefore, we implemented a model switch as follows. We added additional coefficients and constraints to the regulation model. For each TF, a binary switch was included into the model. Those switches enabled the optimizer to decide whether to use the activity or the TF-gene expression value of a TF (for further details, see Section 2). Note that, using such new binary coefficients, we took advantage of the powerful solver implementations for mixed-integer programming problems. This improved the performance to some extent when compared with using the activity alone (PCC r = 0.63). We studied the results in more detail (a list of all investigated genes and their average usage of activity and TF-gene expression is given in the Supplementary Table S1). For each gene, we counted how often activity for each TF and how often TF-gene expression was selected by the model. We found that a striking majority was modelled using the activity definition. For ∼95% of all studied TFs, the activity was preferred. Figure 3 shows the complete distribution. Next, we wanted to characterize those TFs whose effects could better be estimated by the optimizer using our activity definition and those TFs for which their TF-gene expression was selected. The TFs with the highest impact (highest number of putative target genes) and for which the activity definition was more often selected when compared with TF-gene expression are shown in Table 1.
Fig. 3.
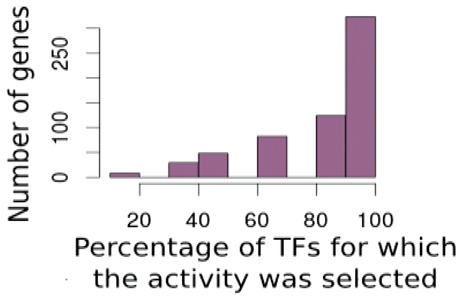
Most of the TFs were modelled using the activity definition when employing the model switch
Table 1.
Highly connected TFs for which the activity was chosen for most of their targets
| TF | Number of activity modelled targets | Number of TF-gene expression modelled targets | Total number of targets | Ratio activity/ gene expression (percentage) | Average performance (PCC r) |
|---|---|---|---|---|---|
| SP1 | 82 | 20 | 102 | 80.4 | 0.60 |
| TP53 | 63 | 7 | 70 | 90 | 0.60 |
| EGR1 | 49 | 9 | 58 | 84.5 | 0.61 |
| RELB | 47 | 9 | 56 | 83.9 | 0.60 |
| CEBPB | 41 | 8 | 49 | 83.7 | 0.60 |
| ESR1 | 40 | 20 | 60 | 66.7 | 0.64 |
| MYC | 38 | 16 | 54 | 70.4 | 0.63 |
| SOX2 | 37 | 6 | 43 | 86.0 | 0.62 |
| STAT3 | 36 | 7 | 43 | 83.7 | 0.57 |
| CREB1 | 33 | 9 | 42 | 78.6 | 0.62 |
| JUN | 30 | 4 | 34 | 88.2 | 0.64 |
| NR3C1 | 29 | 5 | 34 | 85.3 | 0.59 |
| HIF1A | 28 | 7 | 35 | 80.0 | 0.60 |
| AR | 27 | 9 | 36 | 75.0 | 0.64 |
| ETS1 | 26 | 5 | 31 | 83.9 | 0.61 |
| STAT1 | 25 | 7 | 32 | 78.1 | 0.59 |
| CEBPA | 24 | 3 | 27 | 88.9 | 0.60 |
| TP63 | 24 | 4 | 28 | 85.7 | 0.67 |
| E2F1 | 24 | 6 | 30 | 80 | 0.65 |
Table 1 shows central regulators of the cell comprising regulation mainly of cell cycle [MYC, E2F, STATs, RELB (NFKB), JUN, p53, CEBBA], but also apoptosis [p53, RELB (NFKB), differentiation (EGR1), immune response (CEBBP) and metabolism (HIF1A)]. Interestingly, TFs that were mainly modelled by their gene expression were much lower connected (Supplementary Table S1). The most connected TFs of this group (modelled by TF-gene expression) were sex determining region Y—box 10 (SOX10, involved in differentiation, neurogenesis, embryogenesis), interferon regulatory factor 3 (IRF3) and sterol regulatory element binding transcription factor 1 (SREBF1). In summary, besides a qualitative bias for cell cycle for the activity group of TFs, we could not see a clear overall tendency. Hence, we performed a gene set enrichment analysis of the target genes for TFs modelled by activity or their gene expression. Target genes representing the activity group (TOA genes, targets of activity-modelled TFs) were selected if they were targeted by at least one TF, which was always modelled by its activity. Genes were discarded from this list if they were also regulated by TFs being modelled by TF-gene expression for at least 50% of their targets. The background was defined by all target genes for which we had at least one entry of putative regulation of the 521 TFs we investigated (10 331 genes). With this we obtained a list of 1667 TOA genes. For the TF-gene expression group (TOG genes, targets of TF-gene expression modelled TFs), the criterion was relaxed to obtain a reasonable number of target genes. Genes were selected if they were regulated by at least one TF, which was at least for 50% of its target modelled by its gene expression. Genes were discarded from this list if they were also regulated by TFs being entirely modelled by activity. This yielded 629 TOG genes, i.e. target genes representing targets of the TF-gene expression TFs (TOG genes, Targets Of TF-gene expression modelled TFs). Employing Fisher’s exact tests to the Kyoto Encyclopedia of Genes and Genomes (KEGG, www.genome.jp.kegg) and Gene Ontology Biological Process (www.geneontology.org) using DAVID (http://david.abcc.ncifcrf.gov/home.jsp), we found 64 significantly enriched gene groups (Benjamini–Hochberg corrected) for the TOA genes (Supplementary Table S2). Interestingly, cell cycle (P = 6.79 E-08), immune response (P = 4.12 E-05) and cell growth and death (P = 1.96 E-06) appeared supporting the tendency seen when only regarding the TFs. For the TOG genes, only three gene groups were enriched comprising sterol, cholesterol and lipid biosynthesis. Furthermore, we wanted to better understand the TFs that chose activity for modelling. We selected gene groups that were regulated by TFs (modelled by activity) for which the activity and TF-gene expression were well correlated, and TFs for which activity and TF-gene expression correlated poor. We identified 41 TFs with good correlation (PPC r ≥ 0.5 of activity versus gene expression) and 215 TFs with rather poor correlation (r ≤ 0.1). For both groups of TFs, all putative target genes were selected, and enrichment tests performed for genes being targets only of well-correlating TFs (1509 target genes) and only of poor correlating TFs (3783 target genes). For the good correlating TFs, we did not find any enriched gene groups. We found two gene groups being enriched for the target genes of the TFs with poor correlation of activity versus gene expression (transmission of nerve impulse, synaptic transmission, P = 8.64 E-03, Supplementary Table S2).
3.4 Extending the investigations to a larger set of target genes
We tested the impact of the possibility to choose the activity for a larger gene set and relaxed the restriction definitions for the target genes. Relaxing the selection criterion to genes with, at least, five known TFs regulating them yielded a list of 1681 target genes. For the pure activity model, we yielded an average prediction performance of PCC r = 0.46 and for the pure TF-gene expression model r = 0.33, confirming that the activity approach led to better predictions. Using the combined strategy (with the model switch), the average prediction performance was r = 0.48. Again, from the solved models, the coefficient values were read out. For each gene, it was counted how often a TF coefficient got the activity as the chosen parameter and how often the TF’s gene expression was chosen. Similar to the smaller gene set described above, the activity was selected for the majority of TFs. Again, for ∼95% of all studied TFs the activity was preferred by the optimizer. Supplementary Figure S2 in the supplement shows the complete distribution.
3.5 Investigating the regulation of melanogenesis in melanocytes and validating the predictions using a second dataset
We applied the improved regulation model (using the model switch) to a case study and investigated regulation of melanogenesis in melanocytes. The NCI-60 panel also contained 10 melanoma cell lines. To get distinct regulation levels of these cells, again, the whole set of cell lines was used. A t-test was performed to find those genes of melanogenesis (pathway definitions were taken from KEGG) that were differentially expressed and significantly up-regulated in melanoma cells compared with the other cancer cells. The differentially expressed genes of this pathway are shown in Table 2. Indeed, genes TYR and DCT, which encode the pacemaker enzymes (Supplementary Fig. S3) of melanogenesis, were significantly up-regulated. Also, the gene coding for microphthalmia-associated transcription factor (MITF) was highly differentially expressed. The latter is the key regulator of melanocytes and melanoma cells and DCT and TYR are targets of MITF (Levy et al., 2006). Endothelin receptor type B (EDNRB) was also highly up-regulated. The g-protein–coupled EDNRB is another central regulator of melanogenesis. Activation of EDNRB activates MITF or its transcription (Ho et al., 2010). To elucidate the regulation of these four genes, the regulation models were set up based on the NCI-60 panel. We used a 10-fold CV to estimate the prediction performances, as the small number of putative regulators for DCT and TYR could have led to overfitting using LOO-CV. We obtained excellent performance results (e.g. DCT: PCC r = 0.85, MITF: PCC r = 0.80, see Table 2). Next, we used the learned models to predict gene expression of the genes from this pathway in a new set of 33 melanoma cell lines [taken from (Hoek et al., 2006)]. Note that this second dataset was normalized and analysed entirely independent from the first dataset (see Section 2). Strikingly, very good prediction performances were still obtained, e.g. for DCT we yielded PCC r = 0.80 and for TYR PCC r = 0.60 (Table 2). The values of real and predicted gene expression for the four used genes are illustrated in Supplementary Figure S4. The predicted TFs for the up-regulated genes of the melanogenesis pathway are mainly connected to the key regulator MITF. For example, paired box 3 (PAX3) activates the transcription of MITF, which promotes the expression of TYR and DCT. Subsequently, PAX3 competes with MITF for the binding site of the DCT promoter (Harris et al., 2010). POU domain, class 3, transcription factor 2 (POU3F2) is another regulator of MITF. Normally, it represses the MITF promoter. However, mutation in BRAF, which is very common in melanoma, leads to an increased kinase activity that provokes the transcription of MITF via POU3F2 (Wellbrock et al., 2008). Another activating regulator is the TF one cut homeo box 2 (ONECUT2). By binding to the MITF promoter, it stimulates the transcription (Jacquemin et al., 2001). Overall, the transcriptional regulation of melanogenesis consists of a complex interplay of activating and inhibiting regulators. Also post-translational modifications are crucial elements, which can also reverse the effect of a TF i.e. as it was described for POU3F2 (Cook and Sturm, 2008; Harris et al., 2010; Jacquemin, et al., 2001; Wellbrock, et al., 2008). In summary, this confirmed our approach to use the cumulative TF's target genes expression to estimate the effect of a TF.
Table 2.
Results of up-regulated genes of melanogenesis
| Gene | P-valuea | PCC r, validationb | Putative regulators | Predicted TFs | PCC r test set |
|---|---|---|---|---|---|
| TYR | 6.7e-19 | 0.50 ± 0.126 | 2 | MITF, POU3F2 | 0.60 |
| DCT | 6.6e-18 | 0.85 ± 0.040 | 3 | MITF, PAX3, SOX5 | 0.80 |
| EDNRB | 2.7e-14 | 0.85 ± 0.011 | 13 | GATA2, HIF1A, SOX10, FOS-JUN complex, CEBP complex | 0.52 |
| MITF | 6.9e-13 | 0.80 ± 0.014 | 19 | SOX5, ONECUT2, ZEB1, POU3F2 | 0.77 |
Note: a BH corrected.
b10-fold CV (with 100 reiterations).
4 DISCUSSION
Several elaborated methods have been developed and established the past couple of years to elucidate cellular regulation of transcription. The models range from highly non-linear approaches using e.g. Support Vector Machines and Random Forests (Cheng et al., 2012) to mathematically rather simple linear models (Dong et al., 2012; Setty et al., 2012). Common to these approaches is the straightforward concept to gain a better mechanistic understanding if the models can well predict known transcript levels after concise selection of putative regulatory information. This information ranges from TFs binding at promoters and enhancers, miRNA seeds and, now highly investigated, a large variety of epigenetic modifications of histones and DNA. The task is challenging, as transcriptional regulation is highly complex, and all these approaches cover only the tip of the iceberg. Assuming that regulation principles are redundant, they may well be modelled even if basing on data that gives insight to only parts of this machinery. However, these investigations often do not cover post-transcriptional control as this comes along with more demanding experimental efforts, and such control is intrinsically distinct from functional genomics regulation. Our activity concept is one approach to circumvent this. It integrates the underlying general influence of a single regulator by using the information of differential expression of all its putative targets, assuming to be e.g. highly active when strong effects at the targets are observed. Of course, this approach is only a starting point for more elaborate models as this, again, is based on putative regulatory interactions inferred from other cellular contexts. A future aspect is to iteratively improve the initial regulation assumptions by e.g. using Bayesian statistics, coupled with an expectation-maximization algorithm. Nevertheless, we obtained excellent performance results when validating our predictions by cross validation, and even when applying our trained machines to a completely unseen dataset (e.g. for DCT gene: PCC r = 0.8 when comparing the model predictions to the measured gene expression). Astonishingly, our approach was the method of choice to predict regulation of cell cycle genes. It was mentioned previously that regulation of cell cycle genes is difficult to model, as these genes are involved in a complex, post-transcriptional machinery (Cheng et al., 2012). At least to some extent, our method may approach this challenge.
To keep the model simple, it was restricted to regions proximal to the transcription start site (TSS). However, distal binding at enhancers support transcriptional regulation. A future task can be the inclusion of distal binding information provided by the Encode project in addition to the Encode data we used for proximal binding to the TSS. New coefficients could be added for enhancers with a positively restricted β-value, due to the activating effect of enhancers, and negative β-values for silencers. Phenotypic traits can be inferred by transcriptional gene signatures. For example, Kerwin et al. used gene signatures known to associate with defined circadian time phases to examine natural variation of the circadian clock (Kerwin et al., 2011). In contrast to these approaches, we rather constructed a mechanistic model of cellular regulation. We used signatures of gene groups (target genes of a TF) mostly basing on experimental evidence of a direct physical interaction (ChIP) with the mediator (TF), which itself interacts directly with the gene causing the investigated trait (its gene expression). We used a linear approach to infer regulation principles. Linear models are commonly applied for this [e.g. (Setty et al., 2012)]. Dong et al. (2012) compared linear with non-linear models (random forests, multivariate adaptive regression splines) and got similar prediction accuracies. In contrast, Cheng and co-workers (Cheng et al., 2012) compared four different approaches and got better results using the non-linear methods. As an outlook, we plan to investigate the activity approach within linear and non-linear models. Segal et al. (2008) followed a similar modelling concept, i.e. estimating the effect of a TF by minimizing the error term of prediction and measured gene expression. As experimental data, they used binding site information, concentration data of the TFs and the promoter-sequence for the investigated target genes. Interestingly, they also modelled co-operativity of TFs assuming that the strength of such interactions depends on the distance between the bound TFs. We plan to integrate such an approach in future studies. We used the established framework of MILP. MILP facilitated (i) the selection of TFs and (ii) the individual selection how to optimally model them (by their cumulative effects we termed activity or by their transcript levels). With this, the biological diversity of gene expression’s regulation could be modulated more precisely. But still, several assumptions were made to keep the model simple, neglecting e.g. epigenetic modifications. New coefficients and parameters can be added to include those factors. But this may come along with increased complexity of the model and may lead to wrong conclusions due to misleading arrangements of redundant information. If the final aim was only to predict gene expression, such an extension is straightforward. But the task of this regulation model was mainly to reveal regulators with high impact on the regulation of the gene under study. For example, for the genes TYR and DCT, which are the pacemaker enzymes of melanin biosynthesis in melanocytes, a regulation model based on a TF network was successfully generated. Using this regulation model, already well known TFs were identified as substantial regulators, but, for DCT, also the less prominent regulator SOX5 was found. It has been reported that SOX5 interferes activation of DCT by SOX10, hence inhibiting expression of DCT (Harris et al., 2010). However, for the cell lines in our study, we found positive terms for SOX5 in our model (positive β-values, data not shown). Subsequent specific experimental validation may elucidate SOX5’s regulatory role for DCT in these cell lines. MILP allowed us to introduce several switches into our originally linear models (switches: selection of TFs, selection of the models of their effects). Note that embedding such switches lead to a non-linear and non-convex topology of the search space for these models. This may be compared with a piecewise linear slope (linear part of the model) with substantial breakpoints coming from an abrupt error reduction when switches are used. To some extent, this compares with drastic observations in cell biology as e.g. apoptosis and immortalization at which smoothly (‘linear’) a point-of-no-return is approached after which the destiny of the cell changes (apoptosis: cell death, in turn, immortalization: malignancy). To our knowledge, such events have not been elaborately described for transcriptional regulation and this would be intriguing research for the future.
Our approach is generic and can be employed also using other sources of regulation information such as epigenetic modifications and miRNA regulation.
Supplementary Material
ACKNOWLEDGEMENTS
We thank Joao Saraiva for proof reading.
Funding: We acknowledge funding from the German ministry for education and research (Bundesministerium für Bildung und Forschung, BMBF), CSCC/IFB (01EO1002), eBio/SYSMET-BC (0316168D), CancerSys/MYCNET (0316076C) and eMed/CancerTelSys (01ZX1302B). The funders had no role in study design, data collection and analysis, decision to publish or preparation of the manuscript.
Conflict of Interest: none declared.
REFERENCES
- Cheng C, et al. Understanding transcriptional regulation by integrative analysis of transcription factor binding data. Genome Res. 2012;22:1658–1667. doi: 10.1101/gr.136838.111. [DOI] [PMC free article] [PubMed] [Google Scholar]
- Cook AL, Sturm RA. POU domain transcription factors: BRN2 as a regulator of melanocytic growth and tumourigenesis. Pigment Cell Melanoma Res. 2008;21:611–626. doi: 10.1111/j.1755-148X.2008.00510.x. [DOI] [PubMed] [Google Scholar]
- Dong X, et al. Modeling gene expression using chromatin features in various cellular contexts. Genome Biol. 2012;13:R53. doi: 10.1186/gb-2012-13-9-r53. [DOI] [PMC free article] [PubMed] [Google Scholar]
- Dunham I, et al. An integrated encyclopedia of DNA elements in the human genome. Nature. 2012;489:57–74. doi: 10.1038/nature11247. [DOI] [PMC free article] [PubMed] [Google Scholar]
- Faith JJ, et al. Large-scale mapping and validation of Escherichia coli transcriptional regulation from a compendium of expression profiles. PLoS Biol. 2007;5:e8. doi: 10.1371/journal.pbio.0050008. [DOI] [PMC free article] [PubMed] [Google Scholar]
- Filtz TM, et al. Regulation of transcription factor activity by interconnected post-translational modifications. Trends Pharmacol. Sci. 2014;35:76–85. doi: 10.1016/j.tips.2013.11.005. [DOI] [PMC free article] [PubMed] [Google Scholar]
- Harris ML, et al. Sox proteins in melanocyte development and melanoma. Pigment Cell Melanoma Res. 2010;23:496–513. doi: 10.1111/j.1755-148X.2010.00711.x. [DOI] [PMC free article] [PubMed] [Google Scholar]
- Ho H, et al. Protein interaction network topology uncovers melanogenesis regulatory network components within functional genomics datasets. BMC Syst. Biol. 2010;4:84. doi: 10.1186/1752-0509-4-84. [DOI] [PMC free article] [PubMed] [Google Scholar]
- Hoek KS, et al. Metastatic potential of melanomas defined by specific gene expression profiles with no BRAF signature. Pigment Cell Res. 2006;19:290–302. doi: 10.1111/j.1600-0749.2006.00322.x. [DOI] [PubMed] [Google Scholar]
- Jacquemin P, et al. The transcription factor onecut-2 controls the microphthalmia-associated transcription factor gene. Biochem. Biophys. Res. Commun. 2001;285:1200–1205. doi: 10.1006/bbrc.2001.5294. [DOI] [PubMed] [Google Scholar]
- Jang IS, et al. hARACNe: improving the accuracy of regulatory model reverse engineering via higher-order data processing inequality tests. Interface Focus. 2013;3:20130011. doi: 10.1098/rsfs.2013.0011. [DOI] [PMC free article] [PubMed] [Google Scholar]
- Kerwin RE, et al. Network quantitative trait loci mapping of circadian clock outputs identifies metabolic pathway-to-clock linkages in Arabidopsis. Plant Cell. 2011;23:471–485. doi: 10.1105/tpc.110.082065. [DOI] [PMC free article] [PubMed] [Google Scholar]
- Kranz AL, et al. Enhancers regulate progression of development in mammalian cells. Nucleic Acids Res. 2011;39:8689–8702. doi: 10.1093/nar/gkr602. [DOI] [PMC free article] [PubMed] [Google Scholar]
- Lachmann A, et al. ChEA: transcription factor regulation inferred from integrating genome-wide ChIP-X experiments. Bioinformatics. 2010;26:2438–2444. doi: 10.1093/bioinformatics/btq466. [DOI] [PMC free article] [PubMed] [Google Scholar]
- Levy C, et al. MITF: master regulator of melanocyte development and melanoma oncogene. Trends Mol. Med. 2006;12:406–414. doi: 10.1016/j.molmed.2006.07.008. [DOI] [PubMed] [Google Scholar]
- Liu H, et al. mRNA and microRNA expression profiles of the NCI-60 integrated with drug activities. Mol. Cancer Ther. 2010;9:1080–1091. doi: 10.1158/1535-7163.MCT-09-0965. [DOI] [PMC free article] [PubMed] [Google Scholar]
- Margolin AA, et al. ARACNE: an algorithm for the reconstruction of gene regulatory networks in a mammalian cellular context. BMC Bioinformatics. 2006;7(Suppl. 1):S7. doi: 10.1186/1471-2105-7-S1-S7. [DOI] [PMC free article] [PubMed] [Google Scholar]
- Min JH, et al. Structure of an HIF-1alpha -pVHL complex: hydroxyproline recognition in signaling. Science. 2002;296:1886–1889. doi: 10.1126/science.1073440. [DOI] [PubMed] [Google Scholar]
- Molineris I, et al. Evolution of promoter affinity for transcription factors in the human lineage. Mol. Biol. Evol. 2011;28:2173–2183. doi: 10.1093/molbev/msr027. [DOI] [PubMed] [Google Scholar]
- Reinhold WC, et al. CellMiner: a web-based suite of genomic and pharmacologic tools to explore transcript and drug patterns in the NCI-60 cell line set. Cancer Res. 2012;72:3499–3511. doi: 10.1158/0008-5472.CAN-12-1370. [DOI] [PMC free article] [PubMed] [Google Scholar]
- Savinell JM, Palsson BO. Optimal selection of metabolic fluxes for in vivo measurement. I. Development of mathematical methods. J. Theor. Biol. 1992;155:201–214. doi: 10.1016/s0022-5193(05)80595-8. [DOI] [PubMed] [Google Scholar]
- Schramm G, et al. PathWave: discovering patterns of differentially regulated enzymes in metabolic pathways. Bioinformatics. 2010;26:1225–1231. doi: 10.1093/bioinformatics/btq113. [DOI] [PubMed] [Google Scholar]
- Schuster S, et al. Detection of elementary flux modes in biochemical networks: a promising tool for pathway analysis and metabolic engineering. Trends Biotechnol. 1999;17:53–60. doi: 10.1016/s0167-7799(98)01290-6. [DOI] [PubMed] [Google Scholar]
- Segal E, et al. Predicting expression patterns from regulatory sequence in Drosophila segmentation. Nature. 2008;451:535–540. doi: 10.1038/nature06496. [DOI] [PubMed] [Google Scholar]
- Setty M, et al. Inferring transcriptional and microRNA-mediated regulatory programs in glioblastoma. Mol. Syst. Biol. 2012;8:605. doi: 10.1038/msb.2012.37. [DOI] [PMC free article] [PubMed] [Google Scholar]
- Shachar R, et al. A systems-level approach to mapping the telomere length maintenance gene circuitry. Mol. Syst. Biol. 2008;4:172. doi: 10.1038/msb.2008.13. [DOI] [PMC free article] [PubMed] [Google Scholar]
- Shoemaker RH. The NCI60 human tumour cell line anticancer drug screen. Nat. Rev. Cancer. 2006;6:813–823. doi: 10.1038/nrc1951. [DOI] [PubMed] [Google Scholar]
- Taylor RC, et al. Network inference algorithms elucidate Nrf2 regulation of mouse lung oxidative stress. PLoS Comput. Biol. 2008;4:e1000166. doi: 10.1371/journal.pcbi.1000166. [DOI] [PMC free article] [PubMed] [Google Scholar]
- Tootle TL, Rebay I. Post-translational modifications influence transcription factor activity: a view from the ETS superfamily. BioEssays. 2005;27:285–298. doi: 10.1002/bies.20198. [DOI] [PubMed] [Google Scholar]
- Wellbrock C, et al. Oncogenic BRAF regulates melanoma proliferation through the lineage specific factor MITF. PloS One. 2008;3:e2734. doi: 10.1371/journal.pone.0002734. [DOI] [PMC free article] [PubMed] [Google Scholar]
Associated Data
This section collects any data citations, data availability statements, or supplementary materials included in this article.