
Fig. 4.
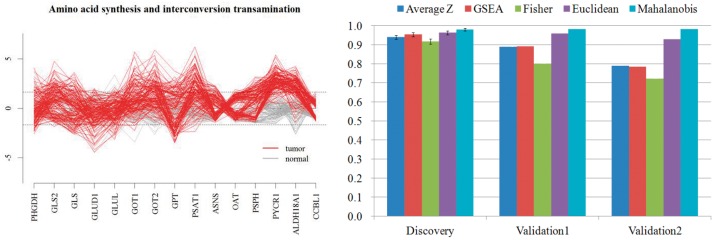
(a) Expression pattern of genes in the pathway. Each line represents sample. (gray: normal, red: tumor). Dashed line represents expression value deviated 1.96σ from the mean expression value of normal tissues. (b). Performance of classification of cancer by ‘amino acid synthesis and interconversion and transamination’. AUC of 0.980 has marked in discovery set (95% confidence interval provided as error bar), independent validation set results AUC of 0.982 (Validation 1: normal samples in validation set served as reference) and 0.982 (Validation 2: normal samples in discovery set served as reference)