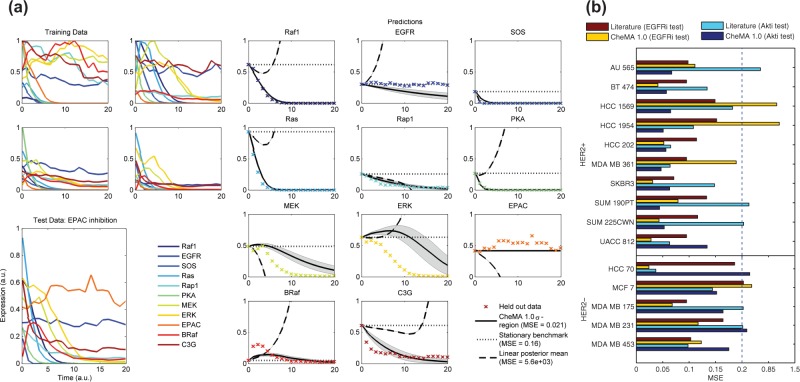
Fig. 4.
Predicting dynamical response to a novel intervention: (a) predicting the effect of EPAC inhibition under the data generating model of Xu et al. (2010). [CheMA (solid) regions correspond to standard deviation of the posterior predictive distribution. Linear (dashed) replaces the non-linear chemical kinetic models with simple linear models. The stationary benchmark (dotted) simply uses the initial data point as an estimate for all later data points. The true test data are displayed as crosses. Here n = 100, .] (b) Assessing prediction over a panel of 15 breast cancer cell lines. (Training data were time series under treatment with a single inhibitor; test data represented a second held-out inhibitor. Normalized MSE was averaged over all protein species and all time points.)

