Abstract
Motivation: The automated functional annotation of biological macromolecules is a problem of computational assignment of biological concepts or ontological terms to genes and gene products. A number of methods have been developed to computationally annotate genes using standardized nomenclature such as Gene Ontology (GO). However, questions remain about the possibility for development of accurate methods that can integrate disparate molecular data as well as about an unbiased evaluation of these methods. One important concern is that experimental annotations of proteins are incomplete. This raises questions as to whether and to what degree currently available data can be reliably used to train computational models and estimate their performance accuracy.
Results: We study the effect of incomplete experimental annotations on the reliability of performance evaluation in protein function prediction. Using the structured-output learning framework, we provide theoretical analyses and carry out simulations to characterize the effect of growing experimental annotations on the correctness and stability of performance estimates corresponding to different types of methods. We then analyze real biological data by simulating the prediction, evaluation and subsequent re-evaluation (after additional experimental annotations become available) of GO term predictions. Our results agree with previous observations that incomplete and accumulating experimental annotations have the potential to significantly impact accuracy assessments. We find that their influence reflects a complex interplay between the prediction algorithm, performance metric and underlying ontology. However, using the available experimental data and under realistic assumptions, our results also suggest that current large-scale evaluations are meaningful and almost surprisingly reliable.
Contact: predrag@indiana.edu
Supplementary information: Supplementary data are available at Bioinformatics online.
1 INTRODUCTION
Assigning function to gene products is of primary importance in biology, yet with the overwhelming abundance of sequence data in the post-genomic era, only a small fraction of gene products have been annotated experimentally. Therefore, it has become important in computational biology to predict function based on sequence, structure and other data when experimental annotations are unavailable (Friedberg, 2006; Punta and Ofran, 2008; Rentzsch and Orengo, 2009). With the development of a large number of function prediction methods, there is a need for unbiased assessment of these methods. Community-based challenges, such as MouseFunc (Pena-Castillo et al., 2008) and the Critical Assessment of Functional Annotation (CAFA) (Radivojac et al., 2013), have emerged to address this problem through the prediction of ontological annotations. The objective in the CAFA challenge, for example, is to predict a set of Gene Ontology (GO) terms associated with a given protein, where GO is a hierarchical knowledge representation of functional descriptors (terms) organized in a large directed acyclic graph (Ashburner et al., 2000).
To evaluate the performance of function prediction methods properly, a set of metrics needs to be established. At the same time, an important challenge we face when assessing the performance of these methods is that because of the incremental nature of scientific discovery, our knowledge of any given protein’s function is likely to be partial. Therefore, a function prediction that is originally assessed as a false positive may be discovered to be a true positive at a later stage, and similarly, a prediction that is initially assessed as a true negative may later be discovered to be a false negative. This problem of incomplete data has led to doubts regarding the reliability of evaluations of protein function prediction algorithms (Dessimoz et al., 2013; Huttenhower et al., 2009).
The problem of incomplete data in the training and assessment of classifiers has been recognized both in computational biology (Huttenhower et al., 2009) and machine learning (Elkan and Noto, 2008; Rider et al., 2013). Huttenhower et al. have concluded that the effect of missing annotations can produce misleading evaluation results because the classifiers are differentially impacted. This results in the re-ranking of classifiers upon re-evaluation at a time when more experimental annotations are available. Similarly, Rider et al. (2013) studied the problem in the framework of asymmetric class-label noise, in which negative examples contain some mislabeled data points. However, both studies only considered a binary classification scenario, e.g. when a predictor is developed for a particular term in the ontology.
Here we study the effect of incomplete experimental annotations on the quality of performance assessment of protein function prediction methods. To that end, we consider protein function prediction as a structured-output learning problem in which a classifier is expected to output a totality of (interdependent) GO terms for a given sequence. We consider both topological and information-theoretic metrics and analytically derive under what conditions the initial performance evaluation will underestimate or overestimate the true accuracy. Then, we provide simulations to characterize the impact for different types of predictors. Finally, we analyze experimental protein function data by simulating the CAFA experiment. Our results regarding the potential impact of incomplete data on correctness of evaluation largely agree with previous studies. However, under realistic assumptions, we provide evidence that the impact of missing data on reliable evaluation is surprisingly small. As a result, this study provides confidence that large-scale performance evaluation of protein function predictors is useful. In addition, our study raises concerns about potentially different conclusions that can be reached when protein function is studied as a series of binary classifiers versus using a structured-output learning formulation.
2 METHODS
2.1 Protein function prediction formulation
We consider protein function prediction within a structured-output learning framework. Given a training set of labeled input objects , where each and , the objective is to infer a relationship that minimizes some loss function. The input space consists of proteins, whereas the output space is a set of all consistent subgraphs of some underlying directed acyclic graph such as GO. Here, by saying ‘consistent’, we mean that if any term v from GO is used to annotate a protein (either experimentally or computationally), all the ancestors of v up to the root(s) of the ontology must also be included as an annotation of x.
2.2 Evaluation of prediction accuracy
To understand how the incomplete functional annotations influence accuracy estimation, we first review two representative evaluation schemes in this domain. For simplicity, we shall consider that the evaluation set, either through a hold-out set or cross-validation, consists of a single protein with its experimental annotation T and a prediction P created by some classifier. This single protein can be considered to be an average case when a larger evaluation set is available. We use V to refer to the entire set of terms in the ontology; thus, with a minor abuse of notation, we write that and . Typically, V is a large graph with tens of thousands of nodes, T is a small graph with about 10–100 nodes, whereas P depends on a particular classifier under evaluation.
F-measure. Given a protein with its non-empty consistent annotations T and P, the precision (pr) and recall (rc) are calculated as
where is the number of predicted terms, is the number of experimental terms, and is the number of correctly predicted terms by the model. We will also refer to these quantities using the following notation: as true-positive findings, as false-positive findings, as true-negative findings and as false-negative findings. Here, is the complement of P, and is the complement of T. The F-measure of the predicted annotation is defined as
where β is a positive number. Here we only consider , which results in the F-measure that represents a harmonic mean between precision and recall.
Semantic distance. Semantic distance is based on an assumption that the prior probability of a protein’s experimental annotation can be modeled by a Bayesian network in which the conditional probability tables are calculated from data (Clark and Radivojac, 2013). Here, we calculate misinformation (mi) and remaining uncertainty (ru) as
where is a vertex in the graph, is a set of its parents, is the probability that a protein is experimentally annotated by v given that all its parents are a part of the annotation, and is information accretion.
Semantic distance between two consistent graphs P and T is defined as
for any . Here we only consider k = 2; thus, S2 is the Euclidean distance between the point and the origin of the coordinate system.
It is important to mention that both evaluation schemes are applied at the protein level. That is, they provide prediction accuracy on each test protein and are typically averaged over a set of proteins. A different group of metrics, those that evaluate a predictor’s performance for a particular term v in the ontology (e.g. ‘catalytic activity’), may also be used. In this case, an area under the receiver operating characteristic curve and the term-based F-measure are routinely used (Sharan et al., 2007). However, these metrics are reliable only if a test set contains a sufficiently large number of proteins experimentally annotated by term v. In addition, it is not clear how to average term-based evaluations over all (interdependent) terms in the ontology to rank two classifiers on a given set of proteins. Thus, term-based metrics are not considered in this work.
2.3 The problem of incomplete annotations
The process of functional annotation of proteins starts with experimental research in which a protein is revealed to be involved in certain biochemical and cellular activities. After the publication, this information is further processed by biocurators who then assign functional annotation to the protein using standardized vocabularies such as GO. Each protein-term association is further assigned a set of evidence codes that document the nature of the experiment used to interrogate a protein’s activity.
Although this process has several layers of control, there are a number of challenges that influence the quality of annotation. For example, proteins may be multifunctional and display different types of activities under different biological and experimental contexts. Similarly, owing to the technical limitations the assays used to determine their function may not provide sufficiently detailed evidence. For those reasons, while the experimental annotations assigned to a protein are generally reliable, they are unlikely to be complete. Two important questions, both theoretically and empirically, emerge: (i) How useful are these available annotations for training of computational models? (ii) To what extent can these partial annotations be reliably used to estimate the accuracy of computational models before the complete experimental annotation is available? We focus on the problem of evaluation.
To formalize our approach, we consider two evaluation scenarios: the original evaluation on incomplete data and another evaluation at a later point in time when additional experimental annotations become available. For simplicity, we shall refer to the latter scenario as evaluation on complete data. We will use T to denote a protein’s incomplete experimental annotation, to denote the complete annotation, where , and refer to as new annotation. Predicted annotations P are generated only once, at the time of original evaluation. Applying the same naming convention, we use pr, rc, etc., to refer to precision, recall, and other incomplete-data metrics, respectively, whereas we use , , etc., for their equivalents on complete data. Our goal is to study and understand the relationship between corresponding metrics, such as pr and , rc and , F1 and , etc.
2.4 The impact of new annotations on F1
We analyze the impact of incomplete annotations on accuracy estimation using two confusion matrices, one provided at the time of original evaluation and the other at a later point in time when additional experimental annotations become available (Fig. 1). We assume that there are new annotations; of those, α terms were predicted as negatives by the predictor, whereas β terms were predicted as positives.
Fig. 1.

Confusion matrix on (A) incomplete data and (B) complete data
The incomplete-data precision (pr) and recall (rc) are defined as
whereas the F-measure can be written as
On the other hand, as illustrated in Figure 1, the complete-data precision () and recall () can be expressed as
The complete-data F-measure () then becomes
We first observe that because . The change of precision . On the other hand, the relationship between and rc is less obvious. We express the change in recall as
By recognizing that is the recall on the new annotations, it follows that the originally estimated recall increases if .
Similarly, for the change in F-measure, we derive that
where . The above equation leads to the following unexpectedly simple result
We see that to maintain the performance upon receiving new annotations, the predictor must have a recall on greater than one half of the original F1.
2.5 The impact of new annotations on S2
We illustrate the analysis of information-theoretic metrics in Figure 2. Analogous to the analysis of F1, we introduce three non-negative quantities to describe the impact of new annotations on the semantic distance as
and . Thus, the complete data remaining uncertainty and misinformation become
Note that ; thus, S2 can be recognized as the L2-norm of this vector. The absolute value of the change of semantic distance can be bounded as follows
However, without further assumptions, the difference in semantic distance can either be positive or negative depending on the performance of a predictor on the new experimental annotations.
Fig. 2.
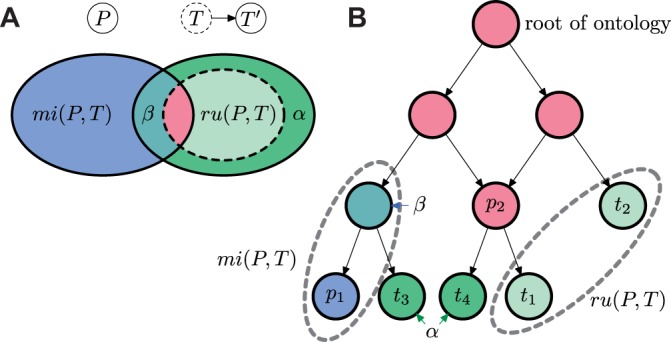
Illustration of the changes of remaining uncertainty and misinformation after the set of experimental annotations changes from T to , where . P is a set of predicted terms determined by leaf annotation nodes p1 and p2; T is a set of incomplete-data experimental terms determined by t1 and t2; is a set of complete-data experimental terms determined by leaf annotation nodes t1, t2, t3 and t4. The changes are illustrated (A) using a Venn diagram and (B) using a directed acyclic graph
2.6 Simulations
Here we show the simulation results for both topological and information-theoretic metrics under reasonable assumptions. For the simulation related to F-measure, we assume that the recall on new data equals the recall on complete data as well as statistical independence between and δ, which together define the level of incompleteness. Values of these two variables were sampled from a distribution estimated using new experimental annotations from Swiss-Prot provided between January 2011 and January 2014; see next section. The parameter β was generated from a binomial distribution .
The simulation for semantic distance was conducted in an analogous way. Here we sampled and δ independently and generated the ratio using a Beta distribution . While the beta distribution was chosen out of convenience, it allowed us to control that , i.e. that the fraction of information content of T that was correctly predicted was unchanged on the new annotations.
Note that in both cases, trials were discarded if the generated values were invalid, i.e. if (Fig. 3) or (Fig. 4). Figures 3 and 4 show the impact averaged over 10 000 trials for each GO classification. Simulation results under several other conditions are provided in Supplementary Materials.
Fig. 3.
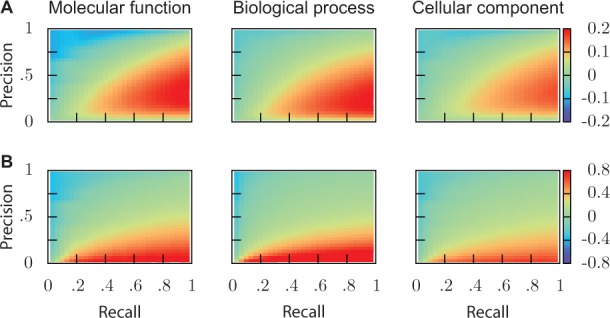
Simulated changes of F1. (A) Absolute changes and (B) relative changes, as a function of precision and recall estimated on incomplete data
Fig. 4.
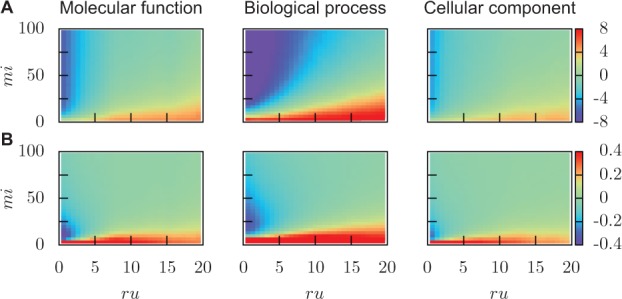
Simulated changes of S2. (A) Absolute changes and (B) relative changes, as a function of misinformation and remaining uncertainty estimated on incomplete data
3 EXPERIMENTS AND RESULTS
To analyze the impact of new annotations on accuracy estimates of protein function predictors, we designed a hypothetical prediction challenge similar to CAFA (Radivojac et al., 2013), with three methods as virtual participants: GOtcha, BLAST and Swiss-Prot computational annotation (evidence codes: ISS, ISO, ISA, ISM, IGC, IBA, IBD, IKR, IRD, RCA and IEA). Swiss-Prot experimental annotations (EXP, IDA, IMP, IPI, IGI, IEP, TAS and IC) were used as gold standard.
The evaluation was performed as follows: (i) All methods were trained on 42 570 experimentally annotated proteins from the January 2010 version of Swiss-Prot and then initially evaluated on proteins that were unannotated in 2010 but acquired annotations between January 2010 and January 2011, (ii) January versions of Swiss-Prot from 2012, 2013 and 2014 were then used to collect a set of proteins that were experimentally annotated between 2010 and 2011, but then acquired additional annotations after January 2011. Such experiment allowed us to understand the extent to which new experimental annotations, 3 years after original data collection, affected the initial estimates of performance accuracy. The experiment is illustrated in Figure 5.
Fig. 5.

The timeline of data collection and evaluation. The light green area represents the experimental annotations of the 2011 test set, while the dark green area represents new annotations
We refer to the performance evaluation on the 2011 data as initial evaluation. Similarly, the evaluation on the data from subsequent years is referred to as re-evaluation. Each re-evaluation was performed as if the data at that point was complete. Finally, we note that all proteins for which the Swiss-Prot curators removed any GO terms at any point between 2011 and 2014 were ignored in this experiment. This excluded 2323 (53%; of those, 1899 were related to the removal of term ‘protein binding’) proteins in the Molecular Function category, 1088 (22%) in the Biological Process category and 672 (15%) proteins in the Cellular Component category.
3.1 Participating methods
BLAST
This method assigns a score to a sequence-term association according to the highest sequence similarity between the target sequence and any of the training sequences that are experimentally associated with that term. More formally, the score for the target sequence q and term v was computed as , where denotes the E-value between two sequences as returned by the BLAST alignment (Altschul et al., 1997), and is a set of training sequences experimentally annotated with term v. The cutoff for E-value was set to 1.0 such that all scores were non-negative.
GOtcha
Instead of assigning the maximum similarity among all sequences associated with a particular term v, GOtcha aggregates the evidence collected from multiple similar sequences (Martin et al., 2004). A normalization step is subsequently taken to enforce that the final score is within the range [0, 1]. That is, , where is called the r-score for the sequence q and term v.
Swiss-Prot
As the third method for comparisons, we simply retrieved all non-experimental annotations from the January 2010 version of Swiss-Prot.
3.2 Evaluation metrics
The first set of evaluation metrics was identical to those used in the CAFA challenge (Radivojac et al., 2013). Because BLAST and GOtcha output soft scores, their performance is visualized using precision-recall curves. As a single number to rank the methods, we calculate , which is the maximum F-measure over the entire range of decision thresholds (Radivojac et al., 2013). Similarly, we calculate misinformation and remaining uncertainty over the range of possible decision thresholds and use the minimum semantic distance to rank methods (Clark and Radivojac, 2013).
We note that Swiss-Prot experimental annotations do not have confidence scores; thus, the Swiss-Prot computational annotations can be presented as a single point in the pr-rc or the ru-mi plane.
3.3 Results
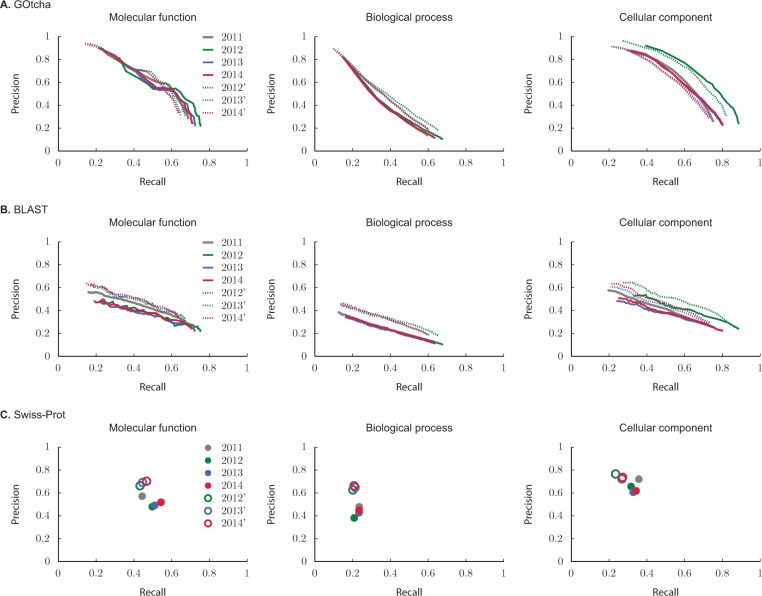
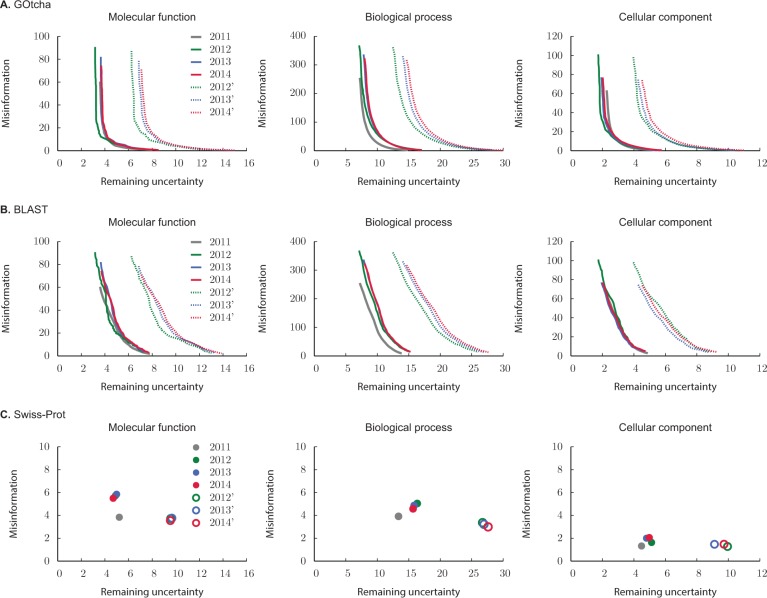
Figures 6 and 7 show the performance of each method in the pr-rc and ru-mi planes, separately for each of the three classifications in GO. Here, the incomplete-data evaluations (2011) for each method are shown as solid gray curves. On the other hand, color-coded curves are used to visualize the performance on incomplete data (solid curves, full circles) and complete data (dotted curves, empty circles) on the subsets of proteins that acquired new annotations in the periods from 2011 to 2012 (green), 2011 to 2013 (blue) and 2011 to 2014 (red). Note that the complete-data evaluations on the entire set of proteins are not shown as the curves would overlap solid gray curves. Tables 1–4 summarize the performance evaluation using and after a 3 year period during which new annotations were allowed to accumulate in the Swiss-Prot database.
Fig. 6.
Precision-recall evaluation on each GO classification using (A) GOtcha, (B) BLAST and (C) Swiss-Prot predictions from January 2010. Solid gray curves (filled circles) represent performance of each method using proteins that did not have experimental annotation in 2010 but were experimentally annotated in January 2011. Color curves show evaluation on those proteins from the 2011 set that accumulated new annotations in 2012 (green), 2013 (blue) and 2014 (red). Solid curves (filled circles) show incomplete-data evaluation on each subset of proteins, whereas dotted curves (empty circles) show complete-data evaluation
Fig. 7.
Information-theoretic evaluation on each GO classification using (A) GOtcha, (B) BLAST, and (C) Swiss-Prot predictions from January 2010. Solid gray curves (filled circles) represent performance of each method using proteins that did not have experimental annotation in 2010 but were experimentally annotated in January 2011. Color curves show evaluation on those proteins from the 2011 set that accumulated new annotations in 2012 (green), 2013 (blue) and 2014 (red). Solid curves (filled circles) show incomplete-data evaluation on each subset of proteins, whereas dotted curves (empty circles) show complete-data evaluation
Table 1.
Impact on between 2011 and 2014 averaged over all test proteins from the 2011 evaluation
| Molecular function |
Biological process |
Cellular component |
|||||||||||||
|---|---|---|---|---|---|---|---|---|---|---|---|---|---|---|---|
| N | Ntr | N | Ntr | N | Ntr | ||||||||||
| GOtcha | 2065 | 25 711 | 0.582 | 0.583 | +0.001 | 3971 | 27 771 | 0.388 | 0.399 | +0.011 | 3750 | 27 249 | 0.612 | 0.606 | −0.006 |
| BLAST | 0.455 | 0.464 | +0.009 | 0.297 | 0.316 | +0.019 | 0.454 | 0.465 | +0.010 | ||||||
| Swiss-Prot | 0.500 | 0.504 | +0.004 | 0.315 | 0.321 | +0.006 | 0.478 | 0.468 | −0.010 | ||||||
Note: The change of is influenced by a subset of proteins that accumulated new annotations in the 3 year period. N is the number of test proteins, whereas Ntr is the number of training proteins.
Table 2.
Impact on between 2011 and 2014 averaged over those test proteins from the 2011 evaluation that acquired new annotations until re-evaluation
| Molecular function |
Biological process |
Cellular component |
||||||||||
|---|---|---|---|---|---|---|---|---|---|---|---|---|
| N | (Coverage) | N | (Coverage) | N | (Coverage) | |||||||
| GOtcha | 279 | 0.60 | 0.569 (92.8%) | −0.004 | 1130 | 0.77 | 0.381 (90.8%) | +0.038 | 865 | 0.33 | 0.599 (93.2%) | −0.016 |
| BLAST | 0.435 (92.8%) | +0.049 | 0.300 (90.8%) | +0.054 | 0.440 (93.2%) | +0.047 | ||||||
| Swiss-Prot | 0.531 (76.3%) | +0.030 | 0.308 (58.9%) | +0.009 | 0.441 (55.1%) | −0.045 | ||||||
Note: N is the number of test proteins; is the median of over all test proteins.
Table 3.
Impact on between 2011 and 2014 averaged over all test proteins from the 2011 evaluation
| Molecular function |
Biological process |
Cellular component |
|||||||||||||
|---|---|---|---|---|---|---|---|---|---|---|---|---|---|---|---|
| N | Ntr | N | Ntr | N | Ntr | ||||||||||
| GOtcha | 2065 | 25 711 | 6.32 | 6.89 | +0.57 | 3971 | 27 771 | 14.10 | 17.10 | +2.99 | 3750 | 27 249 | 4.70 | 5.67 | +0.96 |
| BLAST | 7.87 | 8.57 | +0.70 | 16.60 | 19.50 | +2.89 | 5.64 | 6.49 | +0.85 | ||||||
| Swiss-Prot | 6.48 | 6.88 | +0.40 | 13.90 | 17.10 | +3.19 | 4.68 | 5.71 | +1.03 | ||||||
Note: The change of is influenced by a subset of proteins that accumulated new annotations in the 3 year period. N is the number of test proteins, whereas Ntr is the number of training proteins.
Table 4.
Impact on between 2011 and 2014 averaged over proteins from the 2011 evaluation that acquired new annotations until re-evaluation
| Molecular function |
Biological process |
Cellular component |
||||||||||
|---|---|---|---|---|---|---|---|---|---|---|---|---|
| N | (Coverage) | N | (Coverage) | N | (Coverage) | |||||||
| GOtcha | 279 | 0.72 | 6.69 (92.8%) | +4.35 | 1130 | 0.67 | 16.20 (90.8%) | +10.40 | 865 | 0.85 | 5.24 (93.2%) | +3.93 |
| BLAST | 8.26 (92.8%) | +5.52 | 20.80 (90.8%) | +9.73 | 6.80 (93.2%) | +3.35 | ||||||
| Swiss-Prot | 7.24 (76.3%) | +2.95 | 16.30 (58.9%) | +11.40 | 5.39 (55.1%) | +4.45 | ||||||
Note: N is the number of proteins; is median of over all test proteins. Coverage represents the percentage of proteins on which a method outputs a prediction.
The results shown in Figures 6 and 7 and Tables 1–4 provide evidence that the effects of incomplete annotations are ontology-specific, metric-specific and algorithm-specific. The impact on was relatively small; within 2 percentage points on the entire dataset (Table 1) and within 5 percentage points when the evaluation was restricted to the proteins that accumulated new annotations (Table 2). The impact on , on the other hand, was larger and suggests that the initial evaluations are consistently overestimating the quality of performance. The overall change of in the 3 year period was within 1 bit of information for Molecular Function and Cellular Component classifications, and within 3 bits for Biological Process (Table 3). When the evaluation was restricted to the subset of proteins that accumulated new annotations, this difference became more significant: within 6 bits for Molecular Function and Cellular Component and within 12 bits for Biological Process (Table 4).
4 CONCLUSIONS
Incomplete experimental annotation of protein function affects both the development of computational function prediction methods and their unbiased evaluation. In this work, we addressed the evaluation problem, both theoretically and empirically, by considering function prediction within a structured-output learning framework. We find that the nature and level of incompleteness in the data, types of classification models and performance evaluation metrics are all contributing factors to the complexity of understanding evaluation bias.
Both simulations and empirical evaluation suggest that the influence of incomplete annotations on topological metrics, 3 years after the initial assessment, may result in either overestimated or underestimated performance, but the effect is generally small. The reason for this can probably be found in the cancellation of effects of increasing precision and potentially decreasing recall—resulting, surprisingly, in relatively stable F-measure estimates. On the other hand, information-theoretic metrics appear to be more sensitive to data incompleteness. Here we find that the semantic distance generally increases on real data, which is likely a consequence of the fact that the newly added experimental annotations are typically deep in the ontology and thus contribute significantly toward the overall performance measurements.
The classification algorithms are differentially impacted by data incompleteness as well. In particular, we observe that those tools that operate in the low-precision high-recall region of the pr-rc plane are the most significantly impacted by missing annotations. Finally, we find that the level of incompleteness in Swiss-Prot is not large enough to seriously impact accuracy assessments. The data available to us, however, were only analyzed 3 years after the initial evaluation, therefore not significantly eliminating the possibility for larger changes in light of novel biological discoveries.
In summary, evaluation of function prediction methods at any given time is not error-free. When there is an interest in specific functions for specific gene products, predictions that are discovered at a later time to be true-positive predictions or false-negative predictions because of missing data may be problematic. However, when comparing methods on large datasets, assessing the performance of protein function prediction methods provides meaningful information about their accuracy and usefulness, with a quantifiably low error rate.
Funding: This work was supported by the National Science Foundation grants DBI-0644017 and DBI-1146960 as well as the National Institutes of Health grant R01 LM009722-06A1.
Conflict of Interest: none declared.
Supplementary Material
REFERENCES
- Altschul SF, et al. Gapped BLAST and PSI-BLAST: a new generation of protein database search programs. Nucleic Acids Res. 1997;25:3389–3402. doi: 10.1093/nar/25.17.3389. [DOI] [PMC free article] [PubMed] [Google Scholar]
- Ashburner M, et al. Gene ontology: tool for the unification of biology. The Gene Ontology Consortium. Nat. Genet. 2000;25:25–29. doi: 10.1038/75556. [DOI] [PMC free article] [PubMed] [Google Scholar]
- Clark WT, Radivojac P. Information-theoretic evaluation of predicted ontological annotations. Bioinformatics. 2013;29:i53–i61. doi: 10.1093/bioinformatics/btt228. [DOI] [PMC free article] [PubMed] [Google Scholar]
- Dessimoz C, et al. CAFA and the open world of protein function predictions. Trends Genet. 2013;29:609–610. doi: 10.1016/j.tig.2013.09.005. [DOI] [PubMed] [Google Scholar]
- Elkan C, Noto K. Proceeding of the 14th ACM SIGKDD International Conference on Knowledge Discovery and Data Mining. ACM; 2008. Learning classifiers from only positive and unlabeled data; pp. 213–220. [Google Scholar]
- Friedberg I. Automated protein function prediction–the genomic challenge. Brief. Bioinform. 2006;7:225–242. doi: 10.1093/bib/bbl004. [DOI] [PubMed] [Google Scholar]
- Huttenhower C, et al. The impact of incomplete knowledge on evaluation: an experimental benchmark for protein function prediction. Bioinformatics. 2009;25:2404–2410. doi: 10.1093/bioinformatics/btp397. [DOI] [PMC free article] [PubMed] [Google Scholar]
- Martin DM, et al. GOtcha: a new method for prediction of protein function assessed by the annotation of seven genomes. BMC Bioinformatics. 2004;5:178. doi: 10.1186/1471-2105-5-178. [DOI] [PMC free article] [PubMed] [Google Scholar]
- Pena-Castillo L, et al. A critical assessment of mus musculus gene function prediction using integrated genomic evidence. Genome Biol. 2008;9(Suppl. 1):S2. doi: 10.1186/gb-2008-9-s1-s2. [DOI] [PMC free article] [PubMed] [Google Scholar]
- Punta M, Ofran Y. The rough guide to in silico function prediction, or how to use sequence and structure information to predict protein function. PLoS Comput. Biol. 2008;4:e1000160. doi: 10.1371/journal.pcbi.1000160. [DOI] [PMC free article] [PubMed] [Google Scholar]
- Radivojac P, et al. A large-scale evaluation of computational protein function prediction. Nat. Methods. 2013;10:221–227. doi: 10.1038/nmeth.2340. [DOI] [PMC free article] [PubMed] [Google Scholar]
- Rentzsch R, Orengo C. Protein function prediction–the power of multiplicity. Trends Biotechnol. 2009;27:210–219. doi: 10.1016/j.tibtech.2009.01.002. [DOI] [PubMed] [Google Scholar]
- Rider AK, et al. Proceedings of the 12th International Symposium on Intelligent Data Analysis (IDA 2013) Springer; 2013. Classifier evaluation with missing negative class labels; pp. 380–391. [Google Scholar]
- Sharan R, et al. Network-based prediction of protein function. Mol. Syst. Biol. 2007;3:88. doi: 10.1038/msb4100129. [DOI] [PMC free article] [PubMed] [Google Scholar]
Associated Data
This section collects any data citations, data availability statements, or supplementary materials included in this article.


