

Abstract
A classic morphogen, bone morphogenetic protein 2 (BMP2) regulates the differentiation of pluripotent mesenchymal cells. High BMP2 levels promote osteogenesis or chondrogenesis and low levels promote adipogenesis. BMP2 inhibits myogenesis. Thus, BMP2 synthesis is tightly controlled. Several hundred nucleotides within the 3′ untranslated regions of BMP2 genes are conserved from mammals to fishes indicating that the region is under stringent selective pressure. Our analyses indicate that this region controls BMP2 synthesis by post-transcriptional mechanisms. A common A to C single nucleotide polymorphism (SNP) in the BMP2 gene (rs15705, +A1123C) disrupts a putative post-transcriptional regulatory motif within the human ultra-conserved sequence. In vitro studies indicate that RNAs bearing the A or C alleles have different protein binding characteristics in extracts from mesenchymal cells. Reporter genes with the C allele of the ultra-conserved sequence were differentially expressed in mesenchymal cells. Finally, we analyzed MRI data from the upper arm of 517 healthy individuals aged 18–41 years. Individuals with the C/C genotype were associated with lower baseline subcutaneous fat volumes (P = 0.0030) and an increased gain in skeletal muscle volume (P = 0.0060) following resistance training in a cohort of young males. The rs15705 SNP explained 2–4% of inter-individual variability in the measured parameters. The rs15705 variant is one of the first genetic markers that maybe exploited to facilitate early diagnosis, treatment, and/or prevention of diseases associated with poor fitness. Furthermore, understanding the mechanisms by which regulatory polymorphisms influence BMP2 synthesis will reveal novel pharmaceutical targets for these disabling conditions.
Keywords: Bone Morphogenetic Protein 2 (BMP2), Messenger RNA (mRNA), Post-Transcriptional Gene Regulation, Mesenchymal Cells, Single Nucleotide Polymorphism (SNP), Fitness, Population Genetics
The fate of pluripotent mesenchymal cells is strongly influenced by the level of bone morphogenetic protein 2 (BMP2) (OMIM: 112261 GeneID: 650; NM_001211.2), a member of the transforming growth factor-β (TGF-β) super family [Rosen and Thies, 1992; Hogan, 1996; Roelen and Dijke, 2003; Xiao et al., 2007]. Specifically, exposure to BMP2 prevents myogenesis and promotes osteogenesis, chondrogenesis, or adipogenesis in a concentration-dependent manner [Wang et al., 1993; Katagiri et al., 1994; Denker et al., 1999; Sottile and Seuwen, 2000; Cheng et al., 2003; Rosen and MacDougald, 2006]. BMP2 controls lineage determination by regulating the expression of master regulator genes such as MyoD, myogenin, Runx2 (Cbfa1/AML3), Sox9, and PPARgamma2 [Ogata et al., 1993; Balint et al., 2003; Kang and He, 2008]. Recently BMP2 was shown to up-regulate sets of inhibitory microRNAs that suppress myogenesis and to down-regulate sets of microRNAs that inhibit osteogenesis [Li et al., 2008]. Genetic associations between the BMP2 gene and several bone and soft tissue parameters have been reported [Styrkarsdottir et al., 2003; Reneland et al., 2005; Xiong et al., 2006; McGuigan et al., 2007, 2008; Tranah et al., 2008; Zhao et al., 2008]. Thus, it is reasonable to postulate that BMP2 levels influence the allocation of cells to bone, cartilage, fat, or muscle during embryonic or post-natal development or in response to exercise. The inter-relationship of muscle, fat, and bone cell deposition is a key factor in both normal morphologic variation and a variety of medical conditions including metabolic syndrome, vascular calcification, and osteoporosis [Reid, 2002; Shao et al., 2006; Manolagas and Almeida, 2007; Plutzky, 2007].
Both transcriptional and post-transcriptional aspects of BMP2 gene regulation have been studied in diverse cell types [Feng et al., 1997, 2003; Heller et al., 1999; Mundy et al., 1999; Ghosh-Choudhury et al., 2001; Zhou et al., 2003; Abrams et al., 2004; Fritz et al., 2004; Fukui et al., 2006; Xu and Rogers, 2007; Liu et al., 2008; Jiang et al., in revision]. A 265 nucleotide sequence in the 3′ untranslated region (UTR) of the BMP2 messenger RNA (mRNA) is conserved between mammals, birds, frogs, and fish [Abrams et al., 2004; Fritz et al., 2004]. This extreme evolutionary conservation indicates that the region performs a vital function that will tolerate limited variation. The ultra-conserved sequence is unique to vertebrate BMP2 genes. 3′UTR sequences interact with many different proteins leading to unique cell-specific assemblies that control polyadenylation, nuclear export, translation, RNA localization, and stability [Conne et al., 2000; Wilusz et al., 2001; Dreyfuss et al., 2002; Wilusz and Wilusz, 2004, 2007]. Along with various combinations of transcription factors, these post-transcriptional complexes provide the exquisite control required to regulate the synthesis of BMP2 in diverse cell types. Elucidating the mechanisms that control the synthesis of signals like BMP2 will lead to a greater understanding of normal morphology and pathologies in BMP2-responsive tissues.
As expected for a conserved sequence, single nucleotide polymorphisms (SNPs) are rare in the ultra-conserved part of the 3′UTR of BMP2. However, an A to C transversion (rs15705) occurs commonly at position 11236 relative to the distal promoter (chromosome 20, position 6707980, NT_011387). Significantly, rs15705 disrupts an AU-rich element (ARE) and alters the in vitro decay rates and specific protein binding affinities of RNAs with the A or C alleles in extracts from embryonal carcinoma or HeLa cells [Fritz et al., 2006]. Although sometimes described as “instability” elements, it is more accurate to say that AREs mark mRNAs whose metabolism and function is regulated dynamically. Ten short AREs occur in the ultra-conserved region of BMP2. Factors bound to AREs modulate translation and stabilize or destabilize the BMP2 mRNA [Conne et al., 2000; Wilusz et al., 2001; Dreyfuss et al., 2002; Wilusz and Wilusz, 2004, 2007].
Earlier work from our lab and that of others has shown that the BMP2 ultra-conserved sequence influences BMP2 synthesis in several cell types [Abrams et al., 2004; Fritz et al., 2004, 2006; Jiang et al., in revision] including chondrocytes [Fukui et al., 2006]. This has led us to a working model that the ultra-conserved region is a key regulatory switch that binds repressors and activators to control BMP2 synthesis precisely. We have also determined that HuR and nucleolin, potent regulators of RNA metabolism, interact differently with the two RNA alleles [Fritz et al., 2006; Jiang et al., in revision, and data shown here]. This has led us to postulate that these variations in the rs15705 genotype alter BMP2 synthesis, leading to changes in human physiology and/or morphology. Our previous biochemical data established that the biochemistry of RNAs with the A or the C alleles differed significantly in non-mesenchymal cells. Because BMP2 is an essential regulator of myocyte, adipocyte, and osteoblast fate, the goals of this study were (1) to assess the in vitro protein binding affinities of these two RNAs for proteins from pluripotent mesenchymal cells, (2) to test if the rs15705 polymorphism influenced gene expression in mesenchymal cells, and (3) to explore whether this genetic variant correlates with skeletal muscle, subcutaneous fat, and bone phenotypes in a cohort of healthy young adults.
Materials and Methods
Cell Culture and Transfection
The C3H/10T1/2 (clone 8) cell line (ATCC CCL 226) and ROS17/2.8 cells were grown in DMEM supplemented with 2mM glutamine and 10% fetal bovine serum (Invitrogen, Carlsbad, CA). MC3T3-E1 were grown in non-ascorbic acid-containing α-MEM (Invitrogen #01-0083D) with 2 mM glutamine and 10% fetal bovine serum. All cells were grown in 5% CO2 at 37°C. Cells were transfected using FuGene6 Transfection Reagent (Roche, Indianapolis, IN) following the manufacturer's protocol. Twenty-four hours after transfection, cells were lysed with 1x Passive Lysis Buffer (Promega, Madison, WI) and luciferase activities were measured using the Luciferase Assay System (Promega) following the manufacturer's protocol.
Luciferase Reporter Constructs
All nucleotide positions are given with respect to the mouse or human BMP2 distal promoter [Heller et al., 1999]. Plasmids BmpLUC (mouse nt −1,237 to 471, pGL1.7XX) and BmpLUCBmp (mouse nt −1,237 to 471 and mouse nt 9,574–9,938, pGLB2-5′mouseCNS) were described previously [Fritz et al., 2004]. CMVLUC (pCβSLuc) contains a HindIII–XbaI fragment containing the firefly luciferase-coding region from pGL3-basic (Promega) filled in with T4 DNA polymerase inserted into the SmaI site of pCβSGH [Natalizio et al., 2002] downstream of the CMV promoter. The CMVLUCBmp plasmids with the mouse (pCβSLucmCNSPvAc) or the human (pCβSLuchCNSHcAc) ultra-conserved sequences contain the mouse (nt 9,574–9,938) or human (11,488–11,877) ultra-conserved sequences inserted in a unique EcoRV site downstream of luciferase in pCβSLuc. The human CMVLUCBmp plasmid had the A rs15705 allele. This plasmid was converted to the C allele using the Stratagene QuikChange® II XL site-directed mutagenesis kit according to the manufacturer's instructions.
In Vitro Synthesized Transcripts
Plasmid pGemB2-KA [Fritz et al., 2004] was linearized with BamHI to make template containing the entire mouse ultra-conserved sequence (nt 9,455–9,938). DNA oligos containing the SP6 promoter and BMP2 sequence with either the A or C rs15705 alleles were annealed to make template for the 35 nt transcript (nt 9,713–9,747). The sequences of the DNA oligos were: “A forward,” CATACGATTTAGGTGACACTATAGAATACACGGAATTCAGATTTAAAATGTATTTAGTTGTACATTTTATATGAAGCTTGCTGC; “A reverse,” GCAGCAAGCTTCATATAAAATGTACAACTAAATACATTTTAAATCTGAATTCCGTGTATTCTATAGTGTCACCTAAATCGTATG; “C forward,” CATACGATTTAGGTGACACTATAGAATACACGGAATTCAGATTTAAAATGTATTTCGTTGTACATTTTATATGAAGCTTGCTGC; “C reverse,” GCAGCAAGCTTCATATAAAATGTAC AACGAAATACATTTTAAATCTGAATTCCGTGTATTCTATAGTGTCACCTAAATCGTATG. After linearization or annealing as indicated, templates were transcribed with SP6 RNA polymerase with 7meGpppG and α32P-UTP [Fritz et al., 2000].
UV Cross-Linking Reactions
UV cross-linking analysis was performed essentially as described [Wilusz and Shenk, 1988]. Briefly, 20–50 fmol of radiolabeled RNA was incubated in the cell extract under in vitro decay assay conditions for 10 min at 37°C. EDTA was added to a concentration of 1 mM to prevent RNA decay while proteins bound to the RNA. The reaction mixtures were irradiated with ultraviolet light for 10 min using a 15 W germicidal lamp at 2 μJ/s at room temperature. One hundred nanograms of RNase A was added and incubated for 15 min at 37°C to degrade the labeled RNA. Labeled proteins were solubilized by heating at 95°C for 5min in 8% glycerol, 1.0% SDS, 75mM dithiothreitol, 0.05% Bromophenol Blue, 62.5mM Tris, pH 6.8, analyzed on a 10% polyacrylamide gel (37.5:1, acrylamide/bis-acrylamide) in running buffer (192mM glycine, 25mM Tris–HCl, 0.1% SDS), and quantified as above.
UV Cross-Linking Followed by Immunoprecipitation
32P-labeled RNA and protein complexes formed in the UV cross-linking reaction described above were incubated with an anti-HuR antibody (SC5261, Santa Cruz Biotechnology, Inc., Santa Cruz, CA) in immunoprecipitation buffer (50 mM Tris–Cl [pH 7.4], 150mM NaCl, 1 mM EDTA, and 1% Triton X-100 with freshly added 1 mM PMSF and 0.2 mg/ml leupeptin) at 4°C for 1 h. Protein A/G-agarose beads (Amersham Pharmacia Biotech, Piscataway, NJ) were added and incubated overnight at 4°C with rotation. Beads were pelleted and extracted proteins were analyzed by 8% or 10% SDS–PAGE as described above.
Study Population: Famuss Study
The Functional Polymorphisms Associated with Human Muscle Size and Strength (FAMuSS) study [Thompson et al., 2004] is a multi-center program to study the influence of gene polymorphisms on bone and fat volume and skeletal muscle size and strength before and after resistance training. In brief, we analyzed MRI data from the 517 healthy individuals of northern European heritage, ages 18–41 years (average age = 23; males: n = 197; females: n = 320) for whom complete data were available. All volunteers were enrolled in a supervised 12 weeks resistance training intervention of their non-dominant arm (Table I). No individual with chronic disease or known to use medications or dietary supplements that influence skeletal muscle were included in the study.
Table I. Demographic Characteristics of FMS Cohort With MRI Data.
| Characteristica | Females (N = 320) | Males (N = 197) |
|---|---|---|
| Age (years) | 22.87 ± 5.23 | 23.04 ± 5.70 |
| Baseline weight (lbs.) | 142.41 ± 27.36 | 173.46 ± 32.04 |
| Baseline height (in.) | 65.05 ± 2.65 | 70.24 ± 2.57 |
| Baseline BMI | 23.64 ± 4.26 | 24.66 ± 4.06 |
Data presented as mean ± SD.
Muscle Strength Training
Subjects underwent gradually progressive, supervised strength training of their non-dominant arm (exercised arm) at one of the collaborating facilities. Exercises were performed with the non-dominant arm only. The exercises consisted of the biceps preacher curl, biceps concentration curl, standing biceps curl, overhead triceps extension, and triceps kickback. For every contraction, both the concentric and eccentric phases were emphasized such that the motion was timed and controlled at 2 s up (concentric) and 2 s down (eccentric). Subjects were not allowed to “drop” the weight during the eccentric phase of the movement. All training sessions were supervised and lasted ∼45–60 min. The exercise progression used the following weekly training protocol: weeks 1–4: 3 sets with 12 repetitions of the 12-repetition maximum weight; weeks 5–9:3 sets with 8 repetitions of the 8-repetition maximum weight; weeks 10–12: 3 sets with 6 repetitions of the 6-repetition maximum weight. The primary goal was to train the elbow flexors, but we also trained the elbow extensors to balance muscle strength across the joint.
MRI Acquisition
Subjects were scanned immediately prior to initiating the exercise program and then immediately after, in the supine position with the arms at their sides and their palms up on the scanner bed surface, with imaging of 24cm (9.5″) of the arm using 15 1.6 cm contiguous axial slices. Scans of both arms were taken by Fast Spin Echo and Fast Spoiled Gradient Echo with TE 1.8/TR 200 ms (flow artifact suppression). The images had a 22 cm × 22 cm field of view with a pixel matrix of 256 × 256. The scan time was approximately 3 min per arm, in addition to the sagittal scout view (<1 min). Each subject was scanned one arm at a time. For wide subjects, there was MRI distortion or poor resolution at the lateral edges of the arms when a single scan was performed. Thus, all subjects were repositioned and the scan was repeated to ensure optimal resolution. Seventy-one percent of the MRI images from the 773 individuals that completed the exercise training and MRI were of sufficient quality to allow analysis (n = 517, Table I).
MRI Analysis
Sixty MRI images were taken from each subject (15 images per arm, two arms at each of two time points). Images were transferred in DICOM format to Children's National Medical Center, stored on a server, and cross-referenced in the study SQL database. Sets of images were analyzed for tissue volumetric measures using modified RAPIDIA® software. RAPIDIA® is a U.S. Food and Drug Administration-approved, PC-based, three-dimensional post-processing, interactive system for viewing images from CT and MR scans (www.infinitt.com). The software was optimized to provide automated position adjustment, and to distinguish muscle, fat, and bone, with automatic edge detection, user modification of ambiguous edges, and automated propagation of defined tissue boundaries when possible.
Each MRI included 15 slices for each arm measured 1.6 cm apart (dominant and non-dominant), pre and post-exercise training, for a total of 60 raw images for each subject. We used six of the MRI slices to calculate measures of bone, muscle, and fat volume. Specifically, we used the distal metaphyseal-diaphyseal junction of the humerus as a starting point as it is easily identifiable on axial slices and then assayed the six slices immediately proximal to where the medial flare of the distal metaphysic disappears. Six regions were assessed: medullary canal, bone + medullary canal, cortical bone, fat, muscle, and whole arm volume. For each image, the software also calculated cross sectional area (CSA), and circumference. Volume analysis is generally considered more accurate than cross-sectional analysis [Tracy et al., 2003]. Therefore, each CSA (cm2) was multiplied by the known slice thickness (1.6 cm) to yield a slice volume (mm3). Slice volumes were then summed over a 9.6 cm length of the upper arm. Pre-training volume (mm3) was subtracted from the post-training volume (mm3), to determine training effect.
Reliability of MRI Analysis
Training-induced changes found in the muscles of the non-dominant arm would not be expected in the muscles of the untrained (dominant) arm; therefore, measurements from the untrained arm were used to validate changes observed in the trained arm. Measures of bone, muscle, and fat volume pre- and post-training were highly reliable. Quantitation of subcutaneous fat was particularly reliable and sensitive (R2 = 0.943). Similarly inter- and intra-rater reliability of the automated volume measures (bone, whole arm), semi-automated measures (fat, muscle), and calculated measures (muscle volume) demonstrated that all rater and trial effects were non-significant for all five volumetric measurements. Nearly all intra-class correlations between measurement times were greater than 0.93 for both measurers, indicating that there was good agreement between measurement trial 1 and trial 2.
DNA Extraction and Genotyping
DNA was extracted from whole blood samples obtained by phlebotomy before starting the exercise training. Genotyping was done using the TaqMan allele discrimination assay that employs the 50 nuclease activity of Taq polymerase to detect a fluorescent reporter signal (Applied Biosystems, assay ID: C___8954277_10). Both alleles were detected simultaneously using allele-specific oligonucleotides labeled with different fluorophores, and genotypes determined by the ratio of the two fluorophores used. The PCR for the SNP contained 20 ng of DNA, 900 nM primers, 200 nM probes, and TaqMan Universal PCR Master Mix, No AmpErase UNG Applied Biosystems (Foster City, CA) in a final volume of 15μl. PCR was performed on an MJ Research Tetrad thermal cycler (Waltham, MA). The PCR profile was 10 min at 95°C (denaturation), 44 cycles of 15s at 92°C, and 1 min at an annealing temperature of 60°C. Fluorescence ratios and allele calling were done using an ABI 7900HT system.
Statistical Analyses
The Hardy–Weinberg equilibrium was determined using a χ2 test to compare the observed genotype frequencies to those expected under H-W equilibrium. Nine volumetric measurements were analyzed as continuous quantitative traits (baseline subcutaneous fat, bone and muscle volumes for both exercised and non-exercised arms and difference in subcutaneous fat, bone and muscle volume from baseline to post-exercise for the exercised arm only). Normality of each quantitative trait was confirmed using the Shapiro–Wilk normality test. Bivariate correlation analyses of each quantitative measurement showed several significant correlations with age and baseline weight; therefore, associations between the SNP and volumetric measurements were assessed using analysis of covariance (ANCOVA) methods. Due to large gender differences in baseline values and the response to training, all analyses were performed separately for men and women. Two genetic models were tested, the co-dominant model comparing all three genotype groups and the recessive model comparing homozygous mutant (CC) individuals to all others (AC + AA). All significant associations from the main co-dominant ANCOVA models were subjected to pair-wise linear statistical tests among each of the three genotype groups to determine which genotype groups differed significantly from one another. The resulting P values from these linear tests were adjusted for multiple comparisons using the Sidak post hoc multiple comparison method. Linear regression analyses, including likelihood ratio tests (LRTs) between full (containing genotype and covariates) and constrained (containing covariates only) models, were performed to estimate the proportion of variance in volumetric measurements attributable to the SNP genotype. A nominal P-value of 0.05 was regarded as significant. All analyses used Stata V10 (StataCorp, College Station, TX).
Results
The BMP2 Ultra-Conserved Sequence (UCS) Inhibits Luciferase Synthesis at the Post-Transcriptional Level in Mesenchymal Cells
Although C3H10T½ mesenchymal cells have been widely studied in the contexts of BMP2-regulated myoblast, adipocyte, and osteoblast differentiation and calcification [Katagiri et al., 1990; Wang et al., 1993; Cheng et al., 2003; Shao et al., 2005; Rosen and MacDougald, 2006], C3H10T½ cells normally do not synthesize BMP2 [Jiang et al., 2007]. We tested the hypothesis that the ultra-conserved sequence inhibits BMP2 synthesis in these cells by comparing the activities of transfected luciferase reporter genes driven by either the BMP2 promoter or a heterologous CMV promoter alone or with the ultra-conserved sequence. Figure 1 demonstrates that the ultra-conserved sequence significantly repressed reporter genes driven by either promoter (compare BmpLUC to BmpLUCBmp and CMVLUC to CMVLUCBmp). Repression of the reporter gene driven by the heterologous CMV promoter is consistent with a direct post-transcriptional repressive effect of the ultra-conserved sequence. These data are consistent with published data [Fukui et al., 2006; Jiang et al., 2007] indicating that BMP2 undergoes a two-step activation process whereby the promoter is activated but protein synthesis is blocked initially by post-transcriptional mechanisms.
Fig. 1.
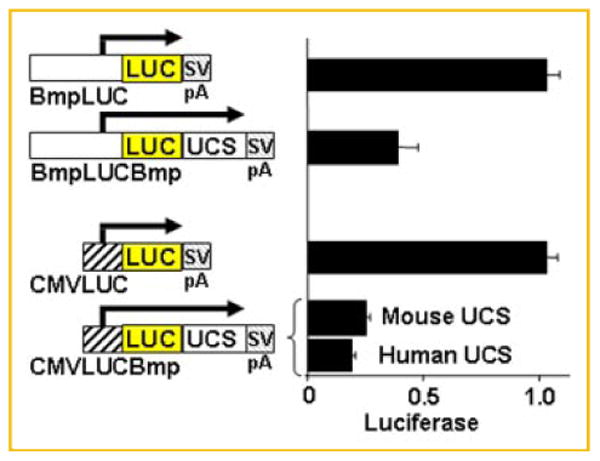
The ultra-conserved sequence mediates repression of reporter genes driven by the BMP2 promoter or a heterologous viral promoter in C3H10T½ mesenchymal cells. Luciferase activity generated in C3H10T½ cells after transfection with reporter genes with the murine Bmp2 promoter (nt −1,237 to 471) or cytomegalovirus (CMV) promoter only (BmpLUC or CMVLUC) or with the mouse or human ultra-conserved sequence (mouse nt 9,574–10,204 or human nt 11,488–11,877) relative to the mouse or human distal promoters, respectively, inserted downstream of LUC (BmpLUCBmp or CMVLUCBmp). Relative reporter activity is shown ± SEM; for the murine Bmp2 promoter with the murine ultra-conserved sequence, n = 7; for the CMV promoter with the murine or human ultra-conserved sequences, n = 6 each.
Proteins Bind RNAs with the a Versus C rs15705 Sequences with Different Affinities
Our early work with non-mesenchymal cells showed that BMP2 mRNAs with the A or the C rs15705 alleles interact differently with factors that mediate post-transcriptional mechanisms [Fritz et al., 2006]. UV cross-linking is a highly specific assay whereby UV-irradiation of RNA and protein complexes causes covalent bond formation between the RNA and closely bound proteins [Wilusz and Shenk, 1988; Ausubel et al., 1997]. By this method, RNA-binding proteins can be selectively labeled based on their interaction with a specific RNA motif.
As a first step to comparing these two RNAs in mesenchymal cells, we used direct UV cross-linking to characterize the interactions of cytoplasmic proteins from MC3T3-E1 pre-osteoblast cells with two 32P-labeled, in vitro transcribed RNAs containing 34 nt of BMP2 sequence centered on the rs15705 SNP (Fig. 2). This process yielded a profile of BMP2 RNA binding proteins that revealed allele-specific differences. For example, the C allele RNA more strongly UV cross-linked a 110 kDa protein (Fig. 2B). In contrast, the A allele RNA more strongly UV cross-linked a 32kDa protein. We extended this analysis with a competition assay, which is more quantitative than direct UV cross-linking. We synthesized unlabeled 35 nt RNA oligos centered on the rs15705 SNP. These oligos were used to compete for UV cross-linking to 32P-labeled RNAs containing the full-length ultra-conserved sequences in extracts from ROS17/2.8 osteosarcoma cells. We had previously demonstrated that the A RNA oligo more efficiently inhibits UV cross-linking to proteins migrating at 32 kDa in ROS17/2.8 extracts [Fritz et al., 2006]. For this study, we have expanded that analysis and demonstrated that the C oligo competes more effectively for cross-linking to a ROS17/2.8 cell protein migrating at 110 kDa (Fig. 2C).
Fig. 2.
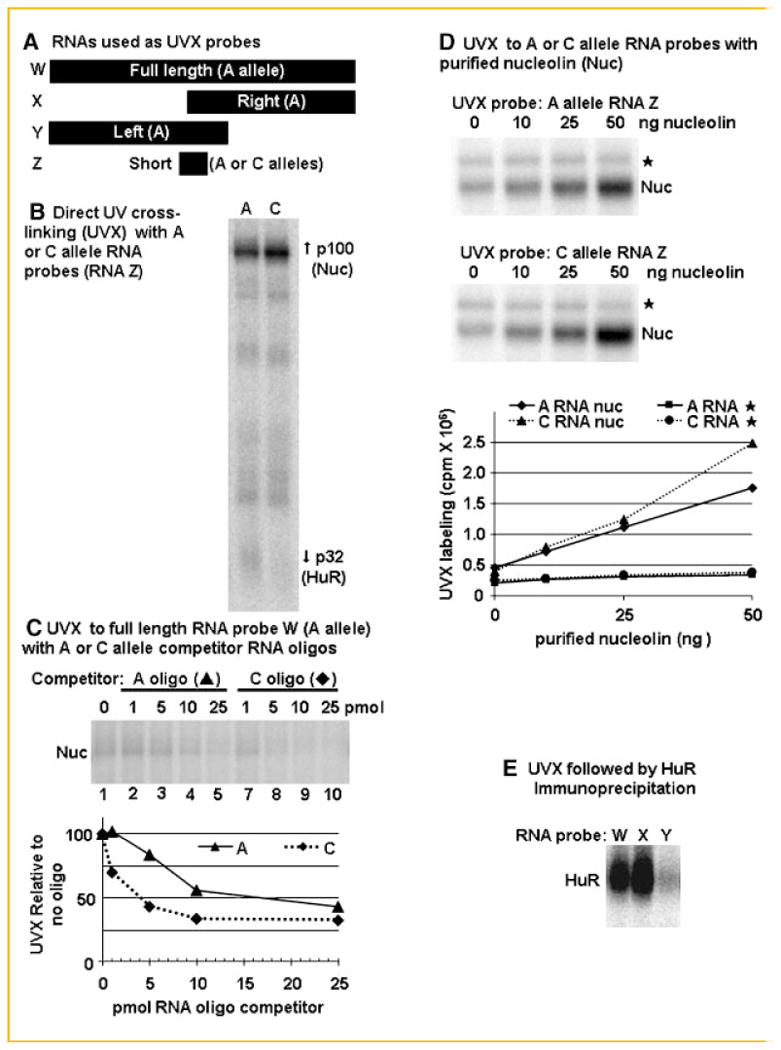
BMP2 RNAs with the A or C alleles differ in affinity for specific RNA binding proteins in extracts from mesenchymal cell types. A: Bars show the relative lengths and positions of BMP2 RNAs used for UV cross-linking. RNA W contains the entire murine ultra-conserved sequence (nt 9,574–9,938 relative to the mouse promoter [Abrams et al., 2004]). The human ultra-conserved sequence (nt 11,636–11,726 relative to the human promoter) differs at only 12 nt located away from rs15705. RNAs X (nt 9,736–9,938) and Y (9574–9782) contain the right or the left approximate halves of the ultra-conserved sequence. RNA Z contains the 34 nt flanking the rs15705 SNP. This region is identical between the mouse (nt 9,713–9,747) and human (nt 11,642–11,676) genes. The RNA Z sequences are AGAUUUAAAAUGUAUUU(A or C)GUUGUACAUUUUAUAUG. B: Capped and 32P-labeled, in vitro synthesized, RNAs Z with the A or C allele were UV-cross-linked in extracts from MC3T3-E1 osteoblastic cells. The C RNA labeled nucleolin (Nuc) more efficiently; whereas the A RNA labeled HuR more efficiently (n = 2). C: RNAs containing the full-length murine ultra-conserved sequence (RNA W) were UV-cross-linked in extracts from ROS17/2.8 rodent osteosarcoma with excess polyA competitor. One, 5, 10, or 25 pmol of competitor RNA oligo with the A (lanes 2–5) or the C (lanes 6–9) sequence (human nt 11,642–11,676 as in RNA Z) were added to the reactions. The mouse and human sequences are identical in this region. The graph indicates the UV cross-linking to nucleolin in extracts relative to samples incubated without competitor RNA oligo. D: RNAs containing the full-length human ultra-conserved sequence (RNA W) were UV-cross-linked in extracts from HeLa cells with increasing amounts of purified human nucleolin (Invivogen, San Diego, CA). The labeling intensity of one band that comigrated with the purified nucleolin increased with the added protein. All other proteins that were labeled by the BMP2 RNA, including the protein marked with a “★” here, did not change in intensity. E: RNAs W, X, or Y were UV-cross-linked in extracts from retinoid-treated F9 embryonal carcinoma cells with excess polyA competitor. The reactions were subsequently immunoprecipitated with an HuR antibody (Santa Cruz, sc5261). The full-length and right half RNAs, but not the left half, immunoprecipitated efficiently.
We have determined that p110 is nucleolin using immunoprecipitation of the BMP2 RNA: protein UV cross-linked complexes (Jiang et al., in revision) and by UV cross-linking to purified human nucleolin (Fig. 2D). We previously had identified p32 as HuR by competition with the tumor necrosis factor (TNF) α ARE [Fritz et al., 2006]. We now have confirmed this by immunoprecipitation of specific ultra-conserved sequence RNAs with an antibody specific to HuR (Fig. 2E).
Taken together, the direct UV cross-linking and competition assays indicate that the rs15705 polymorphism decreases the affinity of the BMP2 RNA for some proteins and increases the affinity of the BMP2 RNA for other proteins. At the molecular level, this would alter the subtle balance of post-transcriptional regulators on the BMP2 mRNA in these mesenchymal cell types.
The rs15705 SNP Influences BMP2 Reporter Gene Expression
Our studies in many cell types (F9 embryonal carcinoma, HeLa, A549 adenocarcinoma, BEAS-2B bronchial epithelial, ROS17/2.8, and MC3T3-E1 cells [Fritz et al., 2006], Fig. 2) demonstrated that many proteins bind RNAs with the A or C sequence with different affinity. Furthermore, at least one microRNA may bind the rs15705 SNP region (Fig. 3A). Because it is currently impossible to predict if the net effect of these factors will increase or decrease BMP2 synthesis in the context of an mRNA in a living cell, we hypothesized that “the allelic differences will change BMP2 expression.” If so, then reporter genes with the A or C alleles should differ in expression. We have tested the effect of rs15705 genotype in reporter genes in HeLa, MC3T3-E1 osteoblastic, and C3H10T½ mesenchymal cells. Figure 3A shows the two sequences that we compared in the context of the CMVLUCBmp plasmid (Fig. 1) which has the human A allele. A reporter gene with the rs15705 C allele was about 40% more active relative to the identical plasmid with the A allele (Fig. 3B). Thus, in vitro protein affinity assays in MC3T3-E1 and ROS17/2.8 and reporter gene experiments in HeLa cells and two mesenchymal cell types (MC3T3-E1 and C3H10T½) support the hypothesis that the rs15705 genotype in the BMP2 ultra-conserved sequence influences BMP2 synthesis in vivo.
Fig. 3.
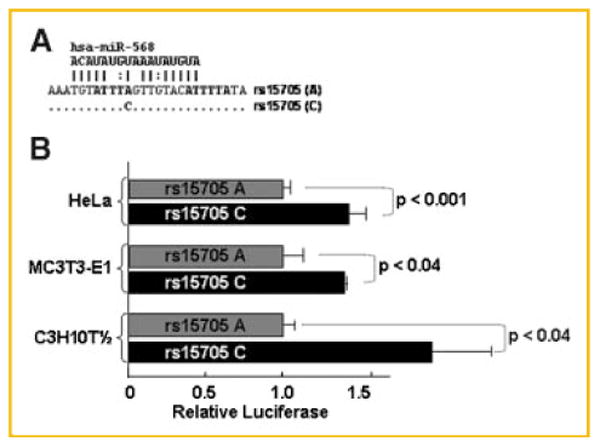
The rs15705 genotype alters the luciferase activity generated from reporter genes with the ultra-conserved 3′UTR. A: Nucleotides 11,649–11,740 relative to the human distal promoter are shown. The aligned sequences show the A or the C allele at the rs15705 SNP in the context of the CMVLUCBmp plasmid (Fig. 1). Unchanged nucleotides are indicated by “.”. The sequence of the miR-569 microRNA is indicated above the sequence with potential hybridization indicated by “|” for Watson-Crick pairing and “:” for non-Watson-Crick pairing. B: The relative reporter activity ± SEM of each plasmid in HeLa (n = 12), MC3T3-E1 osteoblastic (n = 3), and C3H10T½ mesenchymal (n = 6) cells. A Student's t-test was used to compare the luciferase activity of CMVLUCBmp with the A allele at the rs15705 SNP to the plasmid with the C allele. The P-value is shown in the bar for each cell type.
Significant Associations between the BMP2 rs15705 Genotype and Upper Arm Phenotypes
The preceding biochemical and cellular results indicate that rs15705 genotype would influence BMP2 synthesis leading to changes in BMP2-responsive tissues. To test this hypothesis, we focused on tissues derived from highly BMP2-sensitive mesenchymal precursor cells. Specifically, we assessed the contribution of rs15705 genotype to three upper arm parameters, muscle, fat, and bone volumes, as well as response to exercise in a cohort of young healthy individuals of European ancestry from the FAMuSS study [Thompson et al., 2004]. In the entire FAMuSS cohort, the frequency of the A allele was 0.779 and the C allele was 0.221 (A/A: N = 439, A/C: N = 264, C/C: N = 30). These allele frequencies mirror the allele frequencies found in the Centre d'Etude du Polymorphisme Human (CEPH) (http://www.cephb.fr/en/cephdb/) reference population cited in dbSNP (http://www.ncbi.nlm.nih.gov/SNP/snp_ss.cgi?ss=ss8464348). Specifically the CEPH cohort (comprised of 93% Utah, 4% French, and 3% Venezuelan samples) had a frequency of 0.780 for the A allele and 0.220 for the C allele. The rs15705 variant was in HWE in the FAMuSS population (P = 0.213).
The volumes of subcutaneous fat, muscle, and bone before and after a 12-week exercise-training program, were compared to the distribution of rs15705 SNP genotypes in the FAMuSS individuals (Table II). We found that males with two copies of the rare allele were more likely to have less subcutaneous fat in both the non-dominant (C/C, N = 10; 114674 ± 19032) and dominant (C/C, N = 10; 121761 ± 20648 mm3) upper arm before exercise than males with one or two copies of the A allele (AC/AA, N = 187; 173839 ± 4275 mm3, P = 0.0030 or AC/AA, N = 183; 176340 ± 4688 mm3, P = 0.0114, respectively; Table II). After 12 weeks of unilateral resistance training of the non-dominant arm, men with the C/C genotype gained more skeletal muscle in the upper arm than men with the A/C or A/A genotypes (C/C, N = 10: 112867 ± 13960 mm3 vs. AC/AA, N = 179; 72314 ± 3221 mm3, P = 0.0060). Thus, the C/C genotype is associated with an increase in muscle mass and a decrease in fat mass.
Table II. Significant Associations Between BMP2 rs15705 Genotype and Fat/Muscle Phenotypes.
| Phenotype | Arm | N1; adjusted mean volume mm3) ± SEM | P-value for significantly different means | % Variability attributable to genotype; LRT P-value |
|---|---|---|---|---|
| Baseline subcutaneous fat volume (male) | Non-exercised, dominant arm | AC/AA(N = 183; 176340 ± 4688) CC (N = 10; 121761 ± 20648) | P = 0.0114 | 1.5%; 0.0104 |
| Baseline subcutaneous fat volume (male) | Exercised, non-dominant arm | AC/AA(N = 187; 173839 ± 4275) CC (N = 10; 114674 ± 19032) | P = 0.0030 | 2.2%; 0.0026 |
| Δ2 Whole muscle volume after 12 weeks resistance training (male) | Exercised, non-dominant arm | AC/AA (N = 179; 72314 ± 3221) CC (N = 10; 112867 ± 13960) | P = 0.0060 | 3.9%; 0.0055 |
| Δ Total bone volume after 12 weeks resistance training (female) | Exercised, non-dominant arm | AC/AA (N = 304; −86.92 ± 80.82) CC (N = 11; 1035.86 ± 424.31) | P = 0.0099 | 2.1%; 0.0094 |
Test of the recessive model is shown here. Statistical analyses using a co-dominant model also support a significant association between rs15705 genotype and differences in the same parameters (Supplemental Table I).
SEM, standard error of the means; LRT, likelihood ratio test; Δ, difference in.
The number of individual measurements (N) does not equal the total cohort numbers because some measurements were missing for some individuals.
Although change in fat and muscle volumes were not associated with the BMP2 rs15705 genotype in females in the FAMuSS cohort, a statistically significant association was seen between rs15705 genotype and change in total bone volumes in the exercised arms of females (C/C, N = 11; 1035.86 ± 424.31 mm3 vs. AC/AA, N = 304; −86.92 ± 80.82 mm3, P = 0.0099; Table II). An exercise-associated change in bone volume was unexpected given the 12-week duration of the exercise program and will require future study. Supplementary Table I provides the data for all measured parameters and all statistical analyses of associations.
Discussion
We have demonstrated, for the first time, that having the A or C genotype at the rs15705 SNP in the 3′ untranslated region of the BMP2 transcript causes measurable differences in mesenchymal cells and in muscle/fat phenotypes in humans. First, the A and C RNAs bind cell specific proteins with different affinities (Fig. 2). Second, cultured cells express transfected reporter genes with the A or C alleles differently. Finally, these biochemical and gene expression changes are associated with different human body morphologies. Specifically, males with the C/C genotype have less subcutaneous arm fat than males with the A/C and A/A genotypes (Table II). In addition, males with the C/C genotype gained significantly more skeletal muscle after a 12-week resistance-training program. Because this functional SNP influences the expression of an essential protein involved in controlling mesenchymal cell differentiation, these findings have important implications regarding human development and physiology.
The concentration of BMP2 strongly influences mesenchymal cell differentiation [Wang et al., 1993; Katagiri et al., 1994; Sottile and Seuwen, 2000; Cheng et al., 2003; Rosen and MacDougald, 2006]. Specifically, high concentrations induce osteogenesis and low concentrations induce adipogenesis. BMP2 inhibits myogenesis. The rs15705 polymorphism is in a non-coding gene regulatory region; the 3′ untranslated region of the mRNA. Altered associations between regulatory factors and the A or the C allele mRNAs would alter BMP2 synthesis. Consequent variation in the tissue level of BMP2 would change the relative allocation of cells to bone, fat, or muscle, thus explaining the FAMuSS association. Many factors, including nucleolin, HuR, and several unidentified proteins and potentially a microRNA (miR-568, Fig. 3) bind the A and C allele BMP2 RNAs with different affinities [Fritz et al., 2006; Fig. 2]. Understanding molecular mechanisms by which the rs15705 genotype influences the parameters measured in this study will require deciphering how each regulatory factor modulates BMP2 gene expression in the context of living cells. Such studies are clinically relevant, in that pharmaceutical manipulation of BMP2 synthesis may have different effects in patients with the A or C rs15705 alleles.
Individuals with all three rs15705 genotypes (A/A, A/C, or C/C) are developmentally normal. Thus, the patterns of BMP2 synthesis required to control essential processes such as dorsal–ventral axis formation and heart development are clearly intact. However, we postulate that the precise level of BMP2 synthesis is modulated by the rs15705 genotype leading to the observed changes in fat and muscle tissue composition within a normal morphology. Such polymorphisms in regulatory elements could partly explain the vast variation in human morphologies.
Although such polymorphisms may be neutral to selection in the fetus, child, and young adult, they may influence adult health. For example, although the overall mass of soft tissue comprised of fat and muscle positively correlates with bone mass [Reid, 2002], the genetics of this relationship is highly complex and is influenced by sex, age, and environment [Karasik and Kiel, 2008]. Recently, an analysis of 420 pedigrees identified a quantitative trait locus on chromosome 20 (20p12-11) with a LOD score of 2.04 that influenced both total body fat mass and total body lean mass [Zhao et al., 2008]. The 20p12-11 region includes the BMP2 gene. Another group reported consistent, although non-significant trends, regarding the effects of BMP2 gene variation on body mass in women [McGuigan et al., 2008]. Additionally, BMP2 gene variants have been linked to fracture incidence [Styrkarsdottir et al., 2003; Tranah et al., 2008], bone mineral density (BMD) at specific sites [Reneland et al., 2005; Xiong et al., 2006], and bone strength as measured by ultrasound [McGuigan et al., 2007]. An association between rs15705 genotype and bone volume was observed in females in the FAMuSS population. BMP2 is an excellent candidate for influencing the complex pleiotropy between bone and soft tissues because common progenitor cells lead to myocytes, adipocytes, and osteoblasts. Consequently, the association with bone volume should be tested in other data sets focused on other parameters relevant to bone quality.
The observation that the effect of the rs15705 genotype on muscle, fat, and bone was male or female specific was not unexpected. Sex strongly influences the prevalence of many musculoskeletal diseases [Tosi et al., 2005]. Previous population studies also have detected sex-specific associations between BMP2 variants and BMD [Xiong et al., 2006]. Future research focused on sexual dimorphism in BMP2 expression may help explain sex-related differences in musculoskeletal injury and repair.
Conclusion
This study demonstrates, for the first time, that a single nucleotide change in the BMP2 ultra-conserved sequence has real-life consequences that specific molecular mechanisms can explain. This finding is novel because, first, it addresses the mechanisms by which different body types develop in normal individuals. Second, it provides a genetic explanation for individual differences in responses to training regimens. Understanding how such polymorphisms influence defined regulatory mechanisms offers a fresh approach for identifying new drug targets for diseases involving muscle, fat, or bone acquisition and maintenance.
Supplementary Material
Acknowledgments
This study was supported by grants from the National Institutes of Health (NINDS/NIAMS/NIA RO1 NS40606-01) and the Foundation of UMDNJ and by the Center for Advanced Proteomics Research and Molecular Resource Facility at the UMDNJ – NJ Medical School.
Grant sponsor: National Institutes of Health; Grant number: NINDS/NIAMS/NIA R01 NS40606-01; Grant sponsor: Foundation of UMDNJ; Grant sponsor: Center for Advanced Proteomics Research and Molecular Resource Facility at the UMDNJ, NJ Medical School.
Footnotes
Additional Supporting Information may be found in the online version of this article.
References
- Abrams KL, Xu J, Nativelle-Serpentini C, Dabirshahsahebi S, Rogers MB. An evolutionary and molecular analysis of Bmp2 expression. J Biol Chem. 2004;279:15916–15928. doi: 10.1074/jbc.M313531200. [DOI] [PubMed] [Google Scholar]
- Ausubel FM, Brent R, Kingston RE, Moore DD, Seidman JG, Smith JA, Struhl K. Current protocols in molecular biology. NY: Wiley and Sons; 1997. [Google Scholar]
- Balint E, Lapointe D, Drissi H, van der Meijden C, Young DW, van Wijnen AJ, Stein JL, Stein GS, Lian JB. Phenotype discovery by gene expression profiling: Mapping of biological processes linked to BMP-2-mediated osteoblast differentiation. J Cell Biochem. 2003;89:401–426. doi: 10.1002/jcb.10515. [DOI] [PubMed] [Google Scholar]
- Cheng SL, Shao JS, Charlton-Kachigian N, Loewy AP, Towler DA. MSX2 promotes osteogenesis and suppresses adipogenic differentiation of multipotent mesenchymal progenitors. J Biol Chem. 2003;278:45969–45977. doi: 10.1074/jbc.M306972200. [DOI] [PubMed] [Google Scholar]
- Conne B, Stutz A, Vassalli JD. The 3′ untranslated region of messenger RNA: A molecular ‘hotspot’ for pathology? Nat Med. 2000;6:637–641. doi: 10.1038/76211. [DOI] [PubMed] [Google Scholar]
- Denker AE, Haas AR, Nicoll SB, Tuan RS. Chondrogenic differentiation of murine C3H10T1/2 multipotential mesenchymal cells: I. Stimulation by bone morphogenetic protein-2 in high-density micromass cultures. Differentiation. 1999;64:67–76. doi: 10.1046/j.1432-0436.1999.6420067.x. [DOI] [PubMed] [Google Scholar]
- Dreyfuss G, Kim VN, Kataoka N. Messenger-RNA-binding proteins and the messages they carry. Nat Rev Mol Cell Biol. 2002;3:195–205. doi: 10.1038/nrm760. [DOI] [PubMed] [Google Scholar]
- Feng JQ, Chen D, Ghosh-Choudhury N, Esparza J, Mundy GR, Harris SE. Bone morphogenetic protein 2 transcripts in rapidly developing deer antler tissue contain an extended 5′ non-coding region arising from a distal promoter. Biochim Biophys Acta. 1997;1350:47–52. doi: 10.1016/s0167-4781(96)00178-9. [DOI] [PubMed] [Google Scholar]
- Feng JQ, Xing L, Zhang JH, Zhao M, Horn D, Chan J, Boyce BF, Harris SE, Mundy GR, Chen D. NF-kappaB specifically activates BMP-2 gene expression in growth plate chondrocytes in vivo and in a chondrocyte cell line in vitro. J Biol Chem. 2003;278:29130–29135. doi: 10.1074/jbc.M212296200. [DOI] [PubMed] [Google Scholar]
- Fritz DT, Ford LP, Wilusz J. An in vitro assay to study regulated mRNA stability. Sci STKE. 2000;2000:PL1. doi: 10.1126/stke.2000.61.pl1. [DOI] [PubMed] [Google Scholar]
- Fritz DT, Jiang S, Xu J, Rogers MB. A polymorphism in a conserved posttranscriptional regulatory motif alters bone morphogenetic protein 2 (BMP2) RNA:protein interactions. Mol Endocrinol. 2006;20:1574–1586. doi: 10.1210/me.2005-0469. [DOI] [PubMed] [Google Scholar]
- Fritz DT, Liu D, Xu J, Jiang S, Rogers MB. Conservation of Bmp2 post-transcriptional regulatory mechanisms. J Biol Chem. 2004;279:48950–48958. doi: 10.1074/jbc.M409620200. [DOI] [PubMed] [Google Scholar]
- Fukui N, Ikeda Y, Ohnuki T, Hikita A, Tanaka S, Yamane S, Suzuki R, Sandell LJ, Ochi T. Pro-inflammatory cytokine tumor necrosis factor-alpha induces bone morphogenetic protein-2 in chondrocytes via mRNA stabilization and transcriptional up-regulation. J Biol Chem. 2006;281:27229–27241. doi: 10.1074/jbc.M603385200. [DOI] [PubMed] [Google Scholar]
- Ghosh-Choudhury N, Choudhury GG, Harris MA, Wozney J, Mundy GR, Abboud SL, Harris SE. Autoregulation of mouse BMP-2 gene transcription is directed by the proximal promoter element. Biochem Biophys Res Commun. 2001;286:101–108. doi: 10.1006/bbrc.2001.5351. [DOI] [PubMed] [Google Scholar]
- Heller LC, Li Y, Abrams KA, Rogers MB. Transcriptional regulation of the Bmp2 gene: Retinoic acid induction in F9 embryonal carcinoma cells and Saccharomyces cerevisiae. J Biol Chem. 1999;274:1394–1400. doi: 10.1074/jbc.274.3.1394. [DOI] [PubMed] [Google Scholar]
- Hogan B. Bone morphogenetic proteins: Multifunctional regulators of vertebrate development. Genes Dev. 1996;10:1580–1594. doi: 10.1101/gad.10.13.1580. [DOI] [PubMed] [Google Scholar]
- Jiang S, Zhang S, Langenfeld J, Lo SC, Rogers MB. Mycoplasma infection transforms normal lung cells and induces bone morphogenetic protein 2 expression by post-transcriptional mechanisms. J Cell Biochem. 2007;104:580–594. doi: 10.1002/jcb.21647. [DOI] [PubMed] [Google Scholar]
- Kang Q, Song WX, Luo Q, Tang N, Luo J, Luo X, Chen J, Bi Y, He BC, Park JK, Jiang W, Tang Y, Huang J, Su Y, Zhu GH, He Y, Yin H, Hu Z, Wang Y, Chen L, Zuo GW, Pan X, Shen J, Vokes T, Reid RR, Haydon RC, Luu HH, He TC. A comprehensive analysis of the dual roles of BMPs in regulating adipogenic and osteogenic differentiation of mesenchymal progenitor cells. Stem Cells Dev. 2009;18:1–18. doi: 10.1089/scd.2008.0130. [DOI] [PMC free article] [PubMed] [Google Scholar]
- Karasik D, Kiel DP. Genetics of the musculoskeletal system: A pleiotropic approach. J Bone Miner Res. 2008;23:788–802. doi: 10.1359/jbmr.080218. [DOI] [PMC free article] [PubMed] [Google Scholar]
- Katagiri T, Yamaguchi A, Ikeda T, Yoshiki S, Wozney JM, Rosen V, Wang EA, Tanaka H, Omura S, Suda T. The non-osteogenic mouse pluripotent cell line, C3H10T1/2, is induced to differentiate into osteoblastic cells by recombinant human bone morphogenetic protein-2. Biochem Biophys Res Commun. 1990;172:295–299. doi: 10.1016/s0006-291x(05)80208-6. [DOI] [PubMed] [Google Scholar]
- Katagiri T, Yamaguchi A, Komaki M, Abe E, Takahashi N, Ikeda T, Rosen V, Wozney JM, Fujisawa-Sehara A, Suda T. Bone morphogenetic protein-2 converts the differentiation pathway of C2C12 myoblasts into the osteoblast lineage. J Cell Biol. 1994;127:1755–1766. doi: 10.1083/jcb.127.6.1755. [DOI] [PMC free article] [PubMed] [Google Scholar]
- Li Z, Hassan MQ, Volinia S, van Wijnen AJ, Stein JL, Croce CM, Lian JB, Stein GS. A microRNA signature for a BMP2-induced osteoblast lineage commitment program. Proc Natl Acad Sci USA. 2008;105:13906–13911. doi: 10.1073/pnas.0804438105. [DOI] [PMC free article] [PubMed] [Google Scholar]
- Liu D, Fritz DT, Rogers MB, Shatkin AJ. Species-specific cis-regulatory elements in the 3′UTR direct alternative polyadenylation of bone morphogenetic protein 2 mRNA. J Biol Chem. 2008;283:28010–28019. doi: 10.1074/jbc.M804895200. [DOI] [PMC free article] [PubMed] [Google Scholar]
- Manolagas SC, Almeida M. Gone with the Wnts: Beta-catenin, T-cell factor, forkhead box O, and oxidative stress in age-dependent diseases of bone, lipid, and glucose metabolism. Mol Endocrinol. 2007;21:2605–2614. doi: 10.1210/me.2007-0259. [DOI] [PubMed] [Google Scholar]
- McGuigan F, Larzenius E, Callreus M, Gerdhem P, Luthman H, Akesson K. Variation in the bone morphogenetic protein-2 gene: Effects on fat and lean body mass in young and elderly women. Eur J Endocrinol. 2008;158:661–668. doi: 10.1530/EJE-07-0757. [DOI] [PubMed] [Google Scholar]
- McGuigan FE, Larzenius E, Callreus M, Gerdhem P, Luthman H, Akesson K. Variation in the BMP2 gene: Bone mineral density and ultrasound in young adult and elderly women. Calcif Tissue Int. 2007;81:254–262. doi: 10.1007/s00223-007-9054-9. [DOI] [PubMed] [Google Scholar]
- Mundy G, Garrett R, Harris S, Chan J, Chen D, Rossini G, Boyce B, Zhao M, Gutierrez G. Stimulation of bone formation in vitro and in rodents by statins. Science. 1999;286:1946–1949. doi: 10.1126/science.286.5446.1946. [DOI] [PubMed] [Google Scholar]
- Natalizio BJ, Muniz LC, Arhin GK, Wilusz J, Lutz CS. Upstream elements present in the 3′-untranslated region of collagen genes influence the processing efficiency of overlapping polyadenylation signals. J Biol Chem. 2002;277:42733–42740. doi: 10.1074/jbc.M208070200. [DOI] [PubMed] [Google Scholar]
- Ogata T, Wozney JM, Benezra R, Noda M. Bone morphogenetic protein 2 transiently enhances expression of a gene, Id (inhibitor of differentiation), encoding a helix-loop-helix molecule in osteoblast-like cells. Proc Natl Acad Sci USA. 1993;90:9219–9222. doi: 10.1073/pnas.90.19.9219. [DOI] [PMC free article] [PubMed] [Google Scholar]
- Plutzky J. A cardiologist's perspective on cardiometabolic risk. Am J Cardiol. 2007;100:3P–6P. doi: 10.1016/j.amjcard.2007.10.008. [DOI] [PubMed] [Google Scholar]
- Reid IR. Relationships among body mass, its components, and bone. Bone. 2002;31:547–555. doi: 10.1016/s8756-3282(02)00864-5. [DOI] [PubMed] [Google Scholar]
- Reneland RH, Mah S, Kammerer S, Hoyal CR, Marnellos G, Wilson SG, Sambrook PN, Spector TD, Nelson MR, Braun A. Association between a variation in the phosphodiesterase 4D gene and bone mineral density. BMC Med Genet. 2005;6:9. doi: 10.1186/1471-2350-6-9. [DOI] [PMC free article] [PubMed] [Google Scholar]
- Roelen BA, Dijke P. Controlling mesenchymal stem cell differentiation by TGFBeta family members. J Orthop Sci. 2003;8:740–748. doi: 10.1007/s00776-003-0702-2. [DOI] [PubMed] [Google Scholar]
- Rosen ED, MacDougald OA. Adipocyte differentiation from the inside out. Nat Rev Mol Cell Biol. 2006;7:885–896. doi: 10.1038/nrm2066. [DOI] [PubMed] [Google Scholar]
- Rosen V, Thies R. The BMP proteins in bone formation and repair. Trends Genet. 1992;8:97–102. doi: 10.1016/0168-9525(92)90197-c. [DOI] [PubMed] [Google Scholar]
- Shao JS, Cai J, Towler DA. Molecular mechanisms of vascular calcification: Lessons learned from the aorta. Arterioscler Thromb Vasc Biol. 2006;26:1423–1430. doi: 10.1161/01.ATV.0000220441.42041.20. [DOI] [PubMed] [Google Scholar]
- Shao JS, Cheng SL, Pingsterhaus JM, Charlton-Kachigian N, Loewy AP, Towler DA. Msx2 promotes cardiovascular calcification by activating paracrine Wnt signals. J Clin Invest. 2005;115:1210–1220. doi: 10.1172/JCI24140. [DOI] [PMC free article] [PubMed] [Google Scholar]
- Sottile V, Seuwen K. Bone morphogenetic protein-2 stimulates adipogenic differentiation of mesenchymal precursor cells in synergy with BRL 49653 (rosiglitazone) FEBS Lett. 2000;475:201–204. doi: 10.1016/s0014-5793(00)01655-0. [DOI] [PubMed] [Google Scholar]
- Styrkarsdottir U, Cazier JB, Kong A, Rolfsson O, Larsen H, Bjarnadottir E, Johannsdottir VD, Sigurdardottir MS, Bagger Y, Christiansen C, Reynisdottir I, Grant SF, Jonasson K, Frigge ML, Gulcher JR, Sigurdsson G, Stefansson K. Linkage of osteoporosis to chromosome 20p12 and association to BMP2. PLoS Biol. 2003;1:E69. doi: 10.1371/journal.pbio.0000069. [DOI] [PMC free article] [PubMed] [Google Scholar]
- Thompson PD, Moyna N, Seip R, Price T, Clarkson P, Angelopoulos T, Gordon P, Pescatello L, Visich P, Zoeller R, Devaney JM, Gordish H, Bilbie S, Hoffman EP. Functional polymorphisms associated with human muscle size and strength. Med Sci Sports Exerc. 2004;36:1132–1139. doi: 10.1249/01.mss.0000132274.26612.23. [DOI] [PubMed] [Google Scholar]
- Tosi LL, Boyan BD, Boskey AL. Does sex matter in musculoskeletal health? The influence of sex and gender on musculoskeletal health. J Bone Joint Surg Am. 2005;87:1631–1647. doi: 10.2106/JBJS.E.00218. [DOI] [PubMed] [Google Scholar]
- Tracy BL, Ivey FM, Jeffrey Metter E, Fleg JL, Siegel EL, Hurley BF. A more efficient magnetic resonance imaging-based strategy for measuring quadriceps muscle volume. Med Sci Sports Exerc. 2003;35:425–433. doi: 10.1249/01.MSS.0000053722.53302.D6. [DOI] [PubMed] [Google Scholar]
- Tranah GJ, Taylor BC, Lui LY, Zmuda JM, Cauley JA, Ensrud KE, Hillier TA, Hochberg MC, Li J, Rhees BK, Erlich HA, Sternlicht MD, Peltz G, Cummings SR. Genetic variation in candidate osteoporosis genes, bone mineral density, and fracture risk: The study of osteoporotic fractures. Calcif Tissue Int. 2008;83:155–166. doi: 10.1007/s00223-008-9165-y. [DOI] [PMC free article] [PubMed] [Google Scholar]
- Wang EA, Israel DI, Kelly S, Luxenberg DP. Bone morphogenetic protein-2 causes commitment and differentiation in C3H10T1/2 and 3T3 cells. Growth Factors. 1993;9:57–71. doi: 10.3109/08977199308991582. [DOI] [PubMed] [Google Scholar]
- Wilusz CJ, Wilusz J. Bringing the role of mRNA decay in the control of gene expression into focus. Trends Genet. 2004;20:491–497. doi: 10.1016/j.tig.2004.07.011. [DOI] [PubMed] [Google Scholar]
- Wilusz CJ, Wilusz J. HuR-SIRT: The hairy world of posttranscriptional control. Mol Cell. 2007;25:485–487. doi: 10.1016/j.molcel.2007.02.001. [DOI] [PubMed] [Google Scholar]
- Wilusz CJ, Wormington M, Peltz SW. The cap-to-tail guide to mRNA turnover. Nat Rev Mol Cell Biol. 2001;2:237–246. doi: 10.1038/35067025. [DOI] [PubMed] [Google Scholar]
- Wilusz J, Shenk T. A 64 kd nuclear protein binds to RNA segments that include the AAUAAA polyadenylation motif. Cell. 1988;52:221–228. doi: 10.1016/0092-8674(88)90510-7. [DOI] [PubMed] [Google Scholar]
- Xiao YT, Xiang LX, Shao JZ. Bone morphogenetic protein. Biochem Biophys Res Commun. 2007;362:550–553. doi: 10.1016/j.bbrc.2007.08.045. [DOI] [PubMed] [Google Scholar]
- Xiong DH, Shen H, Zhao LJ, Xiao P, Yang TL, Guo Y, Wang W, Guo YF, Liu YJ, Recker RR, Deng HW. Robust and comprehensive analysis of 20 osteoporosis candidate genes by very high-density single-nucleotide polymorphism screen among 405 white nuclear families identified significant association and gene-gene interaction. J Bone Miner Res. 2006;21:1678–1695. doi: 10.1359/JBMR.060808. [DOI] [PMC free article] [PubMed] [Google Scholar]
- Xu J, Rogers MB. Modulation of bone morphogenetic protein (BMP) 2 gene expression by Sp1 transcription factors. Gene. 2007;392:221–229. doi: 10.1016/j.gene.2006.12.032. [DOI] [PMC free article] [PubMed] [Google Scholar]
- Zhao J, Xiao P, Guo Y, Liu YJ, Pei YF, Yang TL, Pan F, Chen Y, Shen H, Zhao LJ, Papasian CJ, Drees BM, Hamilton JJ, Deng HY, Recker RR, Deng HW. Bivariate genome linkage analysis suggests pleiotropic effects on chromosomes 20p and 3p for body fat mass and lean mass. Genet Res. 2008;90:259–268. doi: 10.1017/S0016672308009257. [DOI] [PubMed] [Google Scholar]
- Zhou S, Turgeman G, Harris SE, Leitman DC, Komm BS, Bodine PV, Gazit D. Estrogens activate bone morphogenetic protein-2 gene transcription in mouse mesenchymal stem cells. Mol Endocrinol. 2003;17:56–66. doi: 10.1210/me.2002-0210. [DOI] [PubMed] [Google Scholar]
Associated Data
This section collects any data citations, data availability statements, or supplementary materials included in this article.