

Abstract
Uptake of neurotransmitters by sodium-coupled monoamine transporters of the NSS family is required for termination of synaptic transmission. Transport is tightly regulated by protein–protein interactions involving the small cytoplasmic segments at the amino- and carboxy-terminal ends of the transporter. Although structures of homologues provide information about the transmembrane regions of these transporters, the structural arrangement of the terminal domains remains largely unknown. Here, we combined molecular modeling, biochemical, and biophysical approaches in an iterative manner to investigate the structure of the 82-residue N-terminal and 30-residue C-terminal domains of human serotonin transporter (SERT). Several secondary structures were predicted in these domains, and structural models were built using the Rosetta fragment-based methodology. One-dimensional 1H nuclear magnetic resonance and circular dichroism spectroscopy supported the presence of helical elements in the isolated SERT N-terminal domain. Moreover, introducing helix-breaking residues within those elements altered the fluorescence resonance energy transfer signal between terminal cyan fluorescent protein and yellow fluorescent protein tags attached to full-length SERT, consistent with the notion that the fold of the terminal domains is relatively well-defined. Full-length models of SERT that are consistent with these and published experimental data were generated. The resultant models predict confined loci for the terminal domains and predict that they move apart during the transport-related conformational cycle, as predicted by structures of homologues and by the “rocking bundle” hypothesis, which is consistent with spectroscopic measurements. The models also suggest the nature of binding to regulatory interaction partners. This study provides a structural context for functional and regulatory mechanisms involving SERT terminal domains.
Transporters for biogenic monoamines in the neurotransmitter:sodium symporter (NSS, SLC6) family are responsible for the uptake of the neurotransmitters serotonin, dopamine, and norepinephrine into the presynaptic neuron, for the termination of synaptic transmission.1 The transport process is thought to require conformational changes between outward-open states for binding synaptic transmitters and inward-open states for delivering them to the cytoplasm.2,3 The major conformational change appears to involve “rocking” of a bundle of four transmembrane helices relative to a scaffold region, with additional gating of the pathways by individual half-helices from both the bundle and the scaffold.3,4 Uptake of neurotransmitters by NSS proteins is inhibited by therapeutic agents used to treat major depression, schizophrenia, attention deficit hyperactivity disorder, and anxiety and by recreational drugs such as amphetamines.1
Substantial efforts have been made to understand the regulation of monoamine transport at the levels of synthesis, assembly, targeting, trafficking, function, and degradation. For SERT, regulation involves neuronal nitric oxide synthase (nNOS), SNARE protein syntaxin 1A, protein kinase C (PKC), and scaffolding proteins involved in localization (Hic-5) and trafficking (Sec24C).5 The primary targets of these protein–protein interactions and modifications are the cytoplasmic terminal segments of the transporters.5
As an example, nNOS, which contains a PDZ domain, has been proposed to interact with SERT via its three C-terminal residues [NAV (Figure 1a)].6 Sec24C also binds to the C-terminal domain of SERT, and replacement of residues 607 and 608 (RI) with alanine renders the transporter insensitive to Sec24C downregulation.7,8 By contrast, syntaxin 1A most likely interacts, via its so-called H3 SNARE motif, with the N-terminal domains of SERT, dopamine transporter (DAT), and norepinephrine transporter (NET).9−11 More specifically, mutation or deletion of residues 1–33 in DAT, or of carboxylic residues between positions 11 and 33 in SERT, alters their interaction with syntaxin 1A.9−12 The N-terminal domain may also participate in conformational rearrangements required to support the transport cycle, because amphetamine-induced substrate efflux is impeded when the N-terminus of SERT is tethered to the membrane.13 The latter results imply some degree of conformational flexibility in the N-terminal domain and imply that this flexibility may be required during the conformational cycling of the transport domain.
Figure 1.
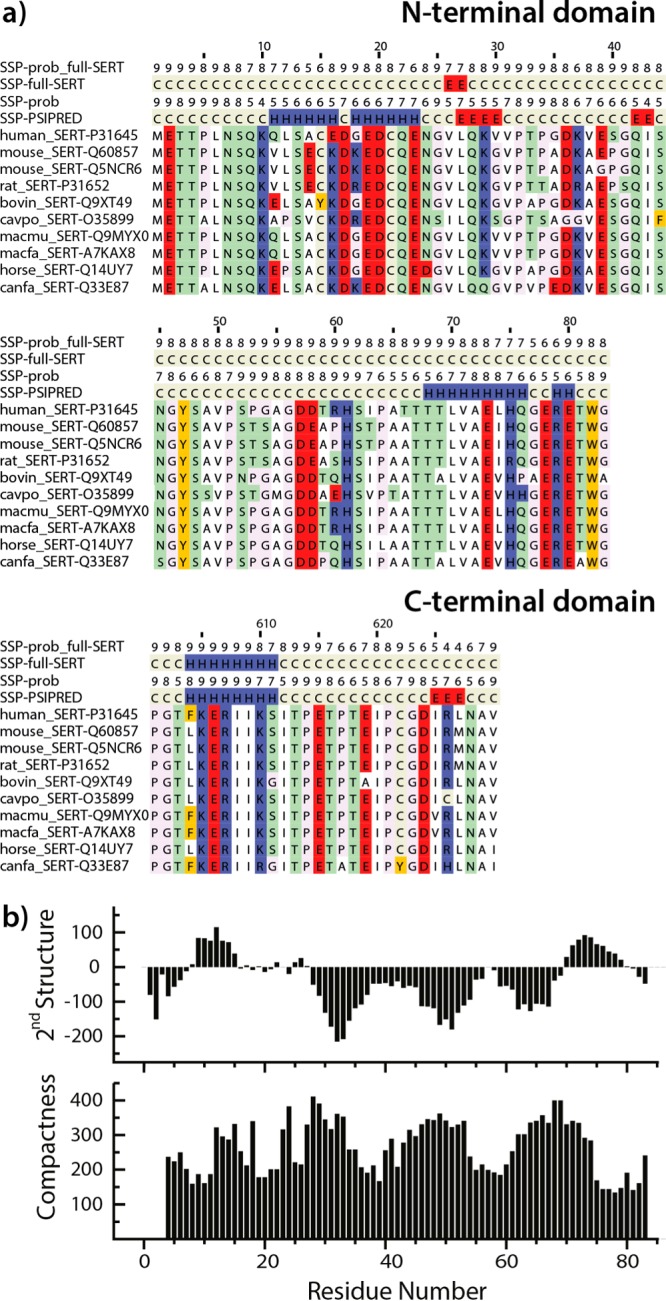
SERT terminal domain sequences and secondary structure. (a) A selection of SERT sequences alongside secondary structure predictions by PSIPRED, which indicate random coil (C), α-helix (H), or β-strand (E), which were obtained using either the full SERT sequence as the query for the PSIBLAST search (SSP-full-SERT) or only the terminal domain sequence shown (SSP-PSIPRED). The probability that each residue adopts the secondary structure predicted is shown above the corresponding majority prediction (labeled prob). (b) Predicted secondary structure (top) and compactness (bottom) according to the meta-structure-based approach are shown as a function of residue position in the N-terminal domain of SERT. Large compactness values indicate residue positions typically buried in the interior of the three-dimensional structure, whereas small values are found for residues exposed to the solvent. For reference, the average residue exposure (compactness) of proteins in the Protein Data Bank (PDB) is 300, compared to, for example, 160 for StpA (PDB entry 2LRX), considered to be an intrinsically disordered protein. For the secondary structure prediction, positive values are indicative of α-helical segments, whereas continuous negative values are typical for extended or β-strand regions, in analogy to the well-established nuclear magnetic resonance 13C chemical shift index.
It is important to consider the terminal domains in a structural context to understand their role in neurotransmitter uptake and in forming multiple distinct interactions during regulation. There are two possible alternatives for the nature of the N- and C-terminal domains. (i) They adopt a stable rigid fold, allowing binding partners to be engaged in a sequential and compartmentalized fashion, or (ii) they are intrinsically unstructured, plastic segments that sample the environment allowing for transient interactions. These two possibilities are not mutually exclusive, because portions of the N- and/or C-termini may adopt a well-defined structure, with other regions being intrinsically unstructured.
Currently, no structural information is available for SERT. A recent structure of the homologous Drosophila melanogaster DAT (dDAT) elucidated important structural details for the transmembrane segments and a small segment of the C-terminus.14 In addition, the DAT N-terminal domain has been structurally modeled to identify the locations of positively charged patches that interact with negatively charged signaling lipids [phosphatidylinositol 4,5-bisphosphate (PIP2)].15 However, because of differences in sequence, and difficulties in the expression and crystallization of flexible domains, neither the dDAT structure nor the model provides information about the long N-terminal domain of SERT or the region proposed to interact with nNOS at the C-terminus of SERT.6 Here, we used a combination of computational and experimental techniques to address the structure of the N- and C-terminal domains of SERT. Specifically, de novo and homology-based modeling were combined in an iterative manner with one-dimensional 1H nuclear magnetic resonance (NMR) and circular dichroism (CD) spectroscopy, mutagenesis, biochemical measurements, and FRET microscopy. Together, the results identify the specific locations of secondary structure elements and indicate that they are interspersed with intrinsically unstructured regions. The resultant models therefore allow prediction of modes of regulatory interactions, for example, the mechanism by which SERT engages syntaxin 1A.
Experimental Procedures
Computational Methods
Models of SERT, including the terminal domains, were generated by combining template-based and fragment-based modeling methodologies. The modeling process was conducted in three stages: (a) separately modeling cytoplasmic N-terminal residues 1–83 and C-terminal residues 600–630 of SERT using a de novo (fragment-based) folding approach called Rosetta,16,17 (b) modeling of the transmembrane (TM) segment of SERT based on a structure of dDAT, and (c) combining these elements. Steps a and c involved extensive conformational sampling to ensure that nativelike states were modeled.
Predicting Secondary Structure and Structural Compactness in the Terminal Domains
Secondary structure propensities for each residue were obtained using PSIPRED version 2.5 (ref (18)), by searching against the Uniref90 database with the terminal domain sequence rather than the full-length SERT sequence. This step excludes DAT and NET sequences from the PSI-BLAST hits and thereby prevents contamination of the prediction. PSIPRED predictions are based on neural networks trained with one-dimensional secondary structure data. We also predicted the structural compactness and the local secondary structure using a recent approach based on the so-called “meta-structure” of known structures as described by Konrat19 and as exemplified by several examples in the literature.20−22 In brief, the meta-structure approach describes proteins as networks in which individual amino acids represent nodes whereas edges connecting two nodes indicate spatial proximity in three-dimensional (3D) structures. The mutual topological relationship between residues is quantified using the shortest path length (θ) connecting two residues in the network. The shortest path length (θ) between residues A and B is characteristic of amino acid types A and B and their separation in the primary sequence (lAB). These characteristics were evaluated using a subset of the Protein Data Bank (PDB) structural database and stored as pairwise statistical distribution functions r(θ,A,B,lAB) from which so-called meta-structure parameters can be calculated as follows. For each possible amino acid pair (A,B) in the primary sequence (separated by lAB) in the protein and using the appropriate r(θ,A,B,lAB), an average topology parameter dAB is calculated. Subsequent summation (over all residue pairs) provides the residue-specific compactness value CA. For the prediction of local secondary structure elements, only next-neighbor distribution functions (restricted to primary sequence differences between residue pairs of ≤4) are used.
The residue compactness value, CA, therefore quantifies the spatial environment of individual residues within 3D protein structures. While residues deeply buried in the interior of a protein structure display large CA values, surface-exposed residues are characterized by small (even negative in the case of conformationally highly flexible segments) CA values. A large-scale comparison of calculated CA values of intrinsically disordered proteins (taken from the DisProt database) and of well-folded proteins deposited in the PDB database showed that intrinsically disordered proteins display CA values (∼230) significantly smaller than those of their well-folded counterparts (∼330), indicating that CA values are valuable quantitative probes for analyzing the foldedness of proteins.
The meta-structure-derived secondary structure parameter is defined using the well-established NMR 13Cα chemical shift index (positive values for α-helices and negative values in the case of extended or β-stranded conformations). These values can therefore be used to infer secondary structures of proteins exclusively on the basis of primary sequence information.23
Folding of the Individual Terminal Domains
Structural models of the SERT cytoplasmic terminal domains were generated using Rosetta, which combines short fragments of known protein structures to yield a 3D model of a query from its sequence. A goal of our strategy (Figure 2a–f) was to identify as many distinct folds per domain as possible; accordingly, we conducted an extensive conformational search to ensure that the native conformation of each terminal domain was sampled.
Figure 2.

SERT modeling protocol, and helical component of terminal domain models. (a) Schematic of the procedure followed to obtain a set of unique folds for the N- or C-terminal domains of SERT. See the text for details. With regard to nomenclature, sets of 1 million structures were named Nall and Call, sets of 200000 structures were named NEfilt and CEfilt, and sets of representatives obtained after clustering stages 1 and 2 were named Nclust1 and Cclust1 or Nclust2 and Cclust2, respectively. (b) All conformations belonging to an example cluster. Each structure is rainbow-colored (from blue at the N-terminus to red at the C-terminus), showing that all conformations in that cluster adopt the same overall fold, as required. (c and d) Example final configurations obtained for the N-terminal and C-terminal domains, respectively, shown as rainbow-colored ribbons. (e) Procedure for combining the N- and C-terminal domain models with the model of the TM domain of SERT, using the outward-facing conformation of the TM region. With regard to nomenclature, F refers to a full-length model of SERT, the set of 28182 models is named Fall, the set of 1724 models that agree with cysteine accessibility data is named F1724, and the set of 100 structures that best agree with the experimental data for the V71E mutant is named Fout100. (f) Fraction of the set of 1821 N-terminal or 231 C-terminal domain models (Nclust2 or Cclust2, respectively) that contain a helix, β-strand, or turn at a given residue.
In the standard Rosetta protocol, applied successfully in several critical assessment of protein structure prediction (CASP) experiments, sets of 300000 structures were typically generated for each globular protein,16 with lengths of <221 residues. In brief, for each candidate conformation, this protocol involves 40000 substitutions of fragment structures, and these substitutions are accepted according to the Metropolis criteria. The resulting structures are subsequently “relaxed” to improve the local backbone and side-chain orientations and to minimize side-chain clashes. For each terminal domain, we repeated this procedure 1 million times, because terminal domains are potentially less compact than globular domains; the resultant sets of 1 million atomistic models are termed Nall and Call for the N- and C-terminal domains, respectively.
Filtering and Clustering the Individual Terminal Domains
The 200000 conformations of each domain with the lowest (best) Rosetta scores were selected from the 1 million initial models as being the most physically reasonable; these sets are termed NEfilt and CEfilt. These models were then clustered to identify distinct folds, in a two-step procedure (Figure 2a) using the simple exclusive clustering algorithm of Daura et al. implemented in Gromacs version 3.0.24,25 The root-mean-square deviation (rmsd) cutoff values of 3, 4, 5, 6, and 7 Å were tested to minimize the number of clusters while ensuring that each cluster represented one folded state (Figure 2b). In the case of the N-terminal domain models, only residues predicted not to belong to the central random coil segment (residues 1–30 and 60–83) were used for calculating the rmsd. The selected rmsd cutoff values were 5 Å for the N-terminal domain and 3 Å for the C-terminal domain.
The two-step clustering procedure was as follows. In clustering step 1 (Figure 2a), it was necessary, because of computational memory limitations, to initially divide the 200000 structures into five groups of 40000 models. Models in each group were clustered, and the structure with the lowest Rosetta score in each cluster was chosen as the representative of that cluster. After the representatives identified for each of the five groups had been combined, a total of n representatives were obtained; this set of n representative models is termed Nclust1 or Cclust1. In clustering step 2 (Figure 2a), all the representatives (Nclust1 or Cclust1) were clustered together to obtain m clusters and a representative was selected, as described above, for each of the m clusters, resulting in sets Nclust2 and Cclust2. These sets contain 1821 and 231 distinct predicted folds for the N- and C-terminal domains, respectively. Example putative folds are shown in panels c and d of Figure 2.
For each of the N-terminal domain models, the secondary structure was assigned according to DSSP25,26 using Gromacs version 3.026,27 and used to design structure-disrupting mutations. The Nclust2 set was then filtered according to the secondary structure indicated by FRET measurements (see Results), after which 122 models remained, in a set called Nclust2*.
Homology Modeling of the Outward-Facing TM Domain
Residues 76–602 in the TM domain of SERT in an outward-facing (inhibited) state were modeled using an X-ray crystal structure of dDAT14 as a template (PDB entry 4M48) using Modeller 9v2,28 based on a sequence alignment generated using AlignMe version 1.1 in P mode29,30 (Figure S1 of the Supporting Information). Residues 203–218 of EL2 were not modeled because of the lack of a template. The sequence identity between hSERT and the dDAT template is 52%.
Combining Models of the Three Domains
Complete models of the protein (except part of EL2) in an outward-facing conformation were generated using Modeller 9v2, by joining every possible combination of N- and C-terminal domain models with the transmembrane (TM) segments of the protein (Figure 2e). First, the 122 filtered N-terminal domain models [Nclust2* (see Results)] were individually added to the model of the TM segment and oriented by structurally aligning residues R79, W82, and G83 of the TM models with the same residues in the N-terminal domain models. We used 25 Modeller iterations per N+TM combination, from which the model with the lowest Rosetta score was selected. Each of these 122 “N+TM” models was then combined with each of the 231 C-terminal domain (Cclust2) configurations, which were oriented by structurally aligning residues T600, P601, and G602 from each model. For each combination, five iterations of the default Modeller optimization were conducted. A single model was selected from the five N+TM+C combinations, on the basis of the Rosetta score, while excluding models in which one or more atoms in the SERT terminal domains were <3 Å from a 30 Å thick layer of pseudoatoms representing the membrane. To orient each SERT model relative to the membrane plane, the scaffold transmembrane helices (TM3–5 and TM8–12) were structurally superimposed onto a structure of LeuT aligned according to the Orientations of Proteins in the Membrane (OPM) database.31 This procedure resulted in 28182 full-length models of SERT (except for part of EL2) in an outward-facing state (the so-called Fall set).
Filtering Full-Length Models
Experimental constraints were then used to identify reasonable models. First, of the 28182 full-length models (Fall), we selected those consistent with published Cys accessibility data32,33 so that C15 and C622 were accessible to the solvent [percent solvent accessible surface area (SASA) of >40%], while C21 was inaccessible to the solvent (SASA of <40%). This filtering step resulted in 1724 models (F1724). Second, the results of the FRET analysis indicated that the V71E mutation does not have any structural effect (see Results). We therefore used this mutant for further filtering; we modeled the V71E mutant of each model in F1724, performing 500 Modeller iterations per V71E side-chain replacement. The V71E mutant model with the lowest Rosetta score was selected from those 500 candidates, resulting in a set of 1724 mutant models. We then selected the 100 models from F1724 that are most consistent with the lack of a structural effect of this mutant, i.e., for which the difference between the WT and V71E Rosetta score was closest to zero (Figure 2e). These 100 WT models constitute set Fout100, which is used for analysis.
Modeling Inward-Facing SERT
An inward-facing model of SERT TM1–10 (residues 76–532) was built using the structure of an antibody fragment (Fab)-bound inward-facing conformation of a LeuT mutant2 (PDB entry 3TT3) as a template (Figure S2 of the Supporting Information; the sequence identity in TM1–10 is 22%). The N-terminal segment of SERT, including TM1a, was modeled in two alternative ways (see below). Each model of SERT TM1–10 was then used as a template, alongside the model of SERT TM11 and TM12 (residues 533–601) from the dDAT-based outward-facing SERT model described above, for constructing an inward-facing model of SERT TM1–12. Additional restraints were imposed between TM11 (residues 536–558) and TM12 (residues 572–599) and between TM3 (residues 159–192) and TM10 (residues 488–516) to maintain the orientation of TM11 and TM12 observed in dDAT. Distance restraints were generated for atom pairs defined as (i,j) where atom i is in TM11 (residues 536–558) or TM12 (residues 572–599) and atom j is in TM3 (residues 159–192) or TM10 (residues 488–516). The distance between atoms i and j was obtained from the SERT outward-facing model for all pairs of atoms <5 Å apart. The distance restraints were defined as single Gaussian forms with a cutoff of 0.1 Å.
To model TM1a within the context of the inward-facing conformation of TM1–10, as mentioned above, two different approaches were followed to sample the range of expected tilts of that half-helix. In the first approach, the orientation was taken from the inward-facing LeuT structure (PDB entry 3TT3), with residues 5–10 appended and adopting the same internal conformation as in the LeuT outward-facing structure34 (PDB entry 2A65). Thus, in the resultant homology model of SERT TM1–10, TM1a adopts an angle of ∼73° with respect to the membrane normal, an increase of ∼40° compared to that of the outward-open state. While this structure is clearly open to the cytoplasm, the orientation of TM1a places charged residues of the SERT N-terminal domain (e.g., K84, K85, and D87) into the presumed hydrophobic core of the membrane. Therefore, the possibility that the Fab-bound LeuT mutant structure may be an inappropriate template in this regard cannot be ruled out, implying an overly extreme movement of TM1a. Therefore, in a second approach, we predicted the most conservative tilt of TM1a, while still opening an intracellular vestibule, by assuming helix packing between TM1a and the other bundle helices was similar to that in the outward-facing conformation. Thus, a hybrid LeuT template was obtained from the outward-facing conformation of LeuT (PDB entry 2A65) after superimposing TM2, TM6, and TM7 onto the equivalent helices in the LeuT inward-facing conformation. Distance restraints between SERT TM1a (residues 7–18) and TM2 (residues 37–67), TM6 (residues 238–264), and TM7 (residues 272–302), defined as described above for TM11 and TM12, were added to retain their relative positions. In this second SERT inward-facing model, TM1a adopts an angle of ∼46° with respect to the membrane normal and therefore changes ∼10° with respect to that of the outward-facing state. In this model, a cytoplasmic vestibule is present, but the state could be categorized as “inward-occluded”. The true free energy minimum for SERT likely consists of an ensemble occupying a region somewhere between these two “extreme” models.
Full-length models of the more conservative inward-facing conformation of SERT (set Fin100) were built using Modeller by appending the same N- and C-terminal pairs as in set Fout onto the template-based model of the TM domain. For each of the 100 full-length inward-facing models, 1000 iterations of Modeller optimization were performed and the most likely model was selected using the Rosetta score.
Other Computational Analysis
The conformational flexibility of the linkers connecting the N-terminal domain to TM1a (either residues Q76–E78 or residues Q76–T81) was assessed by generating 2000 conformations of a model of outward-facing SERT using Modeller, in which the residue after the linker was modeled using the equivalent residue in dDAT as a template. The linker sequence was modeled without a template. The center of mass coordinates of the first residue in the linker (the least constrained residue) were then projected onto the x–y plane, and the positional variability was computed as the standard deviation of the x and y coordinates.
Putative phosphorylation motifs were identified in SERT sequences using NetPhos,35 NetPhosK,36 and Phosida.37,38 The solvent accessible surface area (in square angstroms) of the residues in a given model was calculated using surfv(39,40) and converted to a percentage by comparison to the maximal values obtained for each amino acid type (X) in the context of a GXG tripeptide. The radius of the probe used to define the surface was 1.4 Å. The remaining analysis was conducted using VMD,41 SigmaPlot (SPSS Inc.), and xmgrace.
Experimental Methods
Subcloning, Expression, and Purification of SERT-Nter
Nucleotides encoding amino acids 1–83 of the human serotonin transporter (SERT-Nter) and an N-terminal TEV cleavage site were subcloned into pRSFDuet-1 (Novagen) to create a coding region for an N-terminally His-tagged SERT-Nter fusion protein for overexpression in Escherichia coli Rosetta-gami (DE3) (Merck) cells. Freshly transformed cells were grown in Luria–Bertani medium at 37 °C to an OD595 of 0.4, at which point gene expression was induced with 0.4 mM isopropyl β-d-1-thiogalactopyranoside (IPTG). Cells were then allowed to grow for an additional 4 h at 30 °C, centrifuged at 3000g for 15 min at 4 °C, resuspended in buffer A [20 mM Tris (pH 7.7), 500 mM NaCl, and 5 mM β-mercaptoethanol (β-ME)] supplemented with 20 mM imidazole, lysozyme (10 mg/mL), and protease inhibitors (1 mM phenylmethanesulfonyl difluoride, 1 μM leupeptin, 1 μg/mL aprotinin, and 1 μg/mL pepstatin A), lysed using an Avestin EmulsiFlex-C3, and centrifuged at 100000g for 1 h to remove cell debris. His-tagged SERT-Nter was purified from the supernatant via immobilized metal affinity and gel filtration chromatography. Briefly, the lysate was passed over a 20 mL HisPrep FF 16/10 column (GE Healthcare), washed with 10 column volumes of buffer A containing 40 mM imidazole, and eluted with buffer A containing 500 mM imidazole. The N-terminal histidine tag was removed by adding His-tagged TEV protease at a 1:500 (w/w) ratio and incubating the sample overnight at 4 °C. The digested sample was loaded onto the HisPrep column to remove His-TEV, the polyhistidine tag, and any uncleaved SERT-Nter. The resulting construct comprises the first 83 amino acids of hSERT with a glycine before the N-terminal methionine. The flow-through was concentrated and further purified on a size exclusion column (HiLoad 16/60 Superdex 75 PG, GE Healthcare) pre-equilibrated with buffer B [20 mM Tris (pH 8), 200 mM NaCl, and 5 mM β-ME]. SERT-Nter peak fractions were pooled and applied to the HisPrep column once more in buffer B to remove any remaining His-tagged contaminants. The sample purity was assessed via sodium dodecyl sulfate–polyacrylamide gel electrophoresis (Figure S3a of the Supporting Information) and electrospray ionization mass spectrometry (Figure S3b of the Supporting Information).
We also tested a construct with a C-terminal histidine tag, designated SERT-Nter-H8. DNA encoding the 87 N-terminal amino acids (M1–D87) of human SERT was amplified by polymerase chain reaction and cloned into bacterial expression vector pET16b using standard methods. An eight-residue histidine tag (H8) was added in frame 3′ of this DNA. The peptide was heterologously expressed using the E. coli BL21 (DE3) strain. Once the bacterial culture had reached an optical density of 0.6 at 660 nm, protein expression was induced by 1 mM isopropyl 1-thio-β-d-galactopyranoside (IPTG) for 8 h at 30 °C. Bacteria were harvested by centrifugation, and the pellet was resuspended in lysis buffer (20 mM Tris-HCl, 300 mM NaCl, and 10 mM imidazole) in the presence of complete protease inhibitor (Roche). The cells were lysed with a French press, and the lysate was cleared by centrifugation. Proteins in the supernatant were bound to nickel-Sepharose (IMAC column) overnight at 4 °C. After binding had occurred, the column was washed extensively with lysis buffer containing 30 and 60 mM imidazole. SERT-Nter-H8 peptides were finally eluted with lysis buffer containing 500 mM imidazole.
NMR
For all NMR measurements, SERT-Nter-H8 was dialyzed into 20 mM phosphate (pH 7.4) and 100 mM NaCl. Protein concentrations were estimated from absorption at 280 nm. NMR spectra were recorded on Varian Direct Drive 600 MHz and Varian Inova 800 MHz spectrometers with 10% D2O as the lock solvent. Spectra were processed using NMRPipe.42
The one-dimensional (1D) proton spectrum of SERT-Nter-H8 was recorded at 800 MHz using two WATERGATE elements for water suppression.43 Using a recovery delay of 1.5 s over 512 scans at a temperature of 15 °C, the 1D spectrum was recoded with a sample concentration of 15 μM. Hydrodynamic radii (Rh) were determined from pulse field gradient NMR diffusion measurements performed at 600 MHz using the PG-SLED (pulse gradient-stimulated echo longitudinal encode-decode) sequence44 to which a final WATERGATE43 module was added. Dioxane was used at a concentration of 0.1% as an internal reference. Spectra were recoded with an echo time of 100 ms and a diffusion gradient time of 4.5 ms. A series of 50 experiments with varying gradient strengths were recorded. The decay of peaks along the gradient strength was fit to a single Gaussian using the diffusion-ordered spectroscopy (DOSY) module of NMRPipe.42 This allowed us to determine the diffusion constant of the protein and the reference compound dioxane. The Rh was then calculated from the relationship of the diffusion constants and the known Rh of dioxane (2.12 Å).
CD
Two independent CD data sets were recorded in independent laboratories, with two slightly different constructs, one with (SERT-Nter-H8) and one without a histidine tag (SERT-Nter). For SERT-Nter-H8, the sample buffer was exchanged with 20 mM phosphate (pH 7.4) and 100 mM NaCl by repeated cycles of concentration and dilution on a centricon with a 3 kDa cutoff. The concentration was reduced to 27.0 μM for optimal signal quality. The spectrum was recorded between 195 and 260 nm on a Chirascan-plus spectrometer (Applied Photophysics) using a path length of 0.5 mm. Three scans of sample and buffer were averaged before subtracting the buffer baseline. Independent CD experiments with SERT-Nter were conducted with protein exchanged into 20 mM phosphate (pH 7.4) and 20 mM NaCl (see Figure S3 of the Supporting Information for more details) in an Amicon Ultra-15 concentrator (3.5 kDa molecular weight cutoff), at four different SERT-Nter concentrations (25.0, 12.5, 6.3, and 3.1 μM). The protein concentration was measured spectrophotometrically at 280 nm employing a theoretical extinction coefficient of 0.79 mL mg–1 cm–1. The DICHROWEB Web server45−47 was used to estimate secondary structure content.
Molecular Biology
Mutagenesis of a construct of SERT tagged with CFP and YFP at the N- and C-termini, respectively (C-SERT-Y), was performed using the QuikChange lightning kit (Agilent Technologies, Santa Clara, CA), and mutagenesis primers were designed according to the manufacturer’s protocol. Mutations were confirmed by sequencing (LGC genomics, Berlin, Germany). Primer sequences are listed in Table S1 of the Supporting Information.
Uptake and Binding Assays
Transiently transfected HEK-293 cells expressing C-hSERT-Y or mutants thereof were seeded on 48-well plates precoated with poly-d-lysine (0.5 × 10⁵ cells/well) 24 h prior to the experiment. Each well was washed with 0.5 mL of Krebs-HEPES buffer (KHP) [10 mM HEPES, 130 mM NaCl, 1.3 mM KH2PO4, 1.5 mM CaCl2, and 0.5 mM MgSO4 (pH 7.4, adjusted with NaOH)]. The cells were incubated in 0.2 mL of KHB containing 0.1 μM [3H]-5-HT. Unlabeled 5-HT was added at the indicated final concentration (0.3–30 μM); the incubation time was 1 min. Nonspecific uptake was estimated by blocking the transporters with the specific inhibitor 5 min prior to and during incubation (paroxetine, 10 μM). After being incubated at room temperature, the cells were washed with 0.5 mL of ice-cold KHP buffer. Finally, cells were lysed with 0.5 mL of 1% sodium dodecyl sulfate (SDS) and transferred into 2 mL of scintillation cocktail (Rotiszint eco plus LSC, Art. 0016.3) and counted in a Packard 2300TR TriCarb Liquid Scintillation Analyzer. All experiments were performed on three experimental days (i.e., three independent transfections) in triplicate determinations; because of differing expression levels, all values were normalized to the mean value of the C-SERT-Y-WT uptake and fit to Michaelis–Menten kinetics.
Binding of the high-affinity cocaine analogue 2β-carbomethoxy-3β-(4-[125I]iodophenyl)tropane (β-CIT) was measured as described previously48 using SERT X5C/S277C. The sensitivity of C277 in the cytoplasmic permeation pathway was determined by incubating membranes prepared from HeLa cells with the indicated concentrations of MTSEA in either 150 mM NaCl and 10 mM HEPES adjusted to pH 8.0 with N-methyl-d-glucamine (NMDG, free base) or 150 mM NMDG-Cl and 10 mM HEPES (pH 8.0) for 15 min and subsequently assayed for residual binding activity as described previously.49
Confocal Imaging
Confocal microscopy was performed using a Zeiss LSM780 confocal microscope (core facility of the Medical University of Vienna) using a Plan-apochromat 63× NA 1.4 oil DIC M27 objective. CFP and YFP images were captured in multitrack mode using a blue diode laser (405 nm, 1.5%), an argon laser (514 nm, 1%), and the appropriate beamsplitter; images were captured in line mode, averaging four consecutive captures. The image size was 1024 × 1024 pixels. CFP was detected with a band-pass 447–500 nm filter and YFP with a band-pass 522–621 nm filter. Imaging was performed with a pinhole size of 1 mm.
Fluorescence Resonance Energy Transfer
FRET50 was measured with a Carl Zeiss Axiovert 200 epifluorescence microscope. We used HEK-293 cells transiently transfected with plasmid cDNA (1.7 μg) by means of the calcium phosphate coprecipitation method as described previously.13 Cells were transfected directly in ibidi (Martinsried, Germany) eight-well μ-Slide chambered coverslips. Directly before each FRET microscopy experiment, every well was washed with 300 μL of Krebs-HEPES buffer [10 mM HEPES, 130 mM NaCl, 1.3 mM KH2PO4, 1.5 mM CaCl2, and 0.5 mM MgSO4 (pH 7.4, adjusted with NaOH)] and incubated in 150 μL of KHB. The “three-filter method” was performed as previously described.51 Images were acquired using a 63× oil immersion objective under continuous usage of a gray filter (20% density). LUDL filter wheels allowed for a rapid excitation and emission filter exchange. The LUDL filter wheels were configured as follows: CFP (IDonor; excitation at 436 nm, emission at 480 nm, and dichroic mirror at 455 nm), YFP (IAcceptor; excitation at 500 nm, emission at 535 nm, and dichroic mirror at 515 nm), and FRET (IFRET; excitation at 436 nm, emission at 535 nm, and dichroic mirror at 455 nm). Images were acquired with a CCD camera (Coolsnap fx, Roper Scientific) using the MetaMorph of MetaSeries software package (release 4.6, Universal Imaging Corp., Downingtown, PA). Pixelshift was corrected whenever necessary by using the following combination of ImageJ plugins: TurboReg and StackReg.52 Background fluorescence was subtracted from all images. We analyzed the images pixel by pixel using ImageJ (W. Rassband, National Institutes of Health, version 1.43b) and the ImageJ plugin PixFRET (pixel by pixel analysis of FRET with ImageJ, version 1.6.0_10);53 spectral bleed-through (SBT) parameters were determined for the donor bleed-through (BT) and the acceptor BT. Next, the FRET efficiency (E) was computed. The mean FRET efficiency was measured at the plasma membrane (predefined as the region of interest) using the computed FRET efficiency image. The regions of interest were selected in the CFP (donor) or YFP (acceptor) image (to avoid bleaching-associated bias) and transmitted to the FRET image (equivalent to the Youvan image, FRETc54) by the ImageJ Multi Measure Tool. All experiments were conducted for individual transfections; five to seven wide-field images were captured during each experiment and one to seven transfected cells per image included in the study. Distances (r) were calculated on the basis of the Förster equation using the value of 4.92 nm as R0 for the CFP–YFP FRET pair according to ref (55)
Statistical Analysis
All values are given as means ± the standard error of the mean (SEM) if not stated otherwise. Statistical analysis was performed with GraphPad Prism version 5.0d for Mac OSX (GraphPad Software, San Diego, CA). The statistical significance of differences between groups was analyzed using one-way analysis of variance (ANOVA) applying Bonferroni’s post hoc test. p values of <0.05 were considered to indicate statistical significance.
Results
Secondary Structure and Compactness Predictions
A useful first step in modeling a protein structure is to predict the propensity for each residue to exist in and contribute to a secondary structure element. Modern secondary structure prediction algorithms, such as PSIPRED, gain improved accuracy by considering sequence homologues,18 identified using, e.g., a PSI-BLAST search. For the full-length sequence of SERT, PSIPRED predicted only one secondary structure element in the N-terminal domain and one in the C-terminal domain (Figure 1a, SSP-full-SERT). This result, however, reflected the fact that the PSI-BLAST step collected numerous sequences of, e.g., DAT and NET, which, despite being related to SERT in their TM regions, are entirely different at their termini and therefore contaminate the predictions for the SERT terminal regions. Searching PSI-BLAST using only the individual terminal domains as queries identified exclusively SERT orthologs. This approach dramatically increased the proportion of secondary structure elements predicted with >50% confidence, i.e., six elements in the N-terminal domain and two elements in the C-terminal domain (Figure 1a, SSP-PSIPRED and SSP-prob).
PSIPRED predicts that there are two regions of the N-terminal domain, residues 10–23 and 68–80, in which the residues are likely to be helical. Nevertheless, the overall fraction of predicted secondary structure elements in the N-terminal domain is low (∼35% of the residues), and therefore, an alternative predictive approach was also used for that region. The approach used is based on the so-called meta-structure concept, which was recently introduced as a theoretical framework for protein sequence analysis and provides quantitative parameters for compactness and local secondary structure.19 The residue-specific compactness value predicts the structural complexity of an individual residue in the context of the 3D protein fold; large compactness values are assigned to residues that are buried deep in the interior of a structure. The meta-structure-derived secondary structure parameter is defined in analogy to the well-established NMR 13C chemical shift index, with positive values for an α-helix and negative values indicating the presence of β-strands or an extended conformation. In agreement with the PSIPRED predictions, the meta-structure predictions for the N-terminal domain of SERT (Figure 1b) indicate two regions likely to contain helical elements, separated by a long loosely compacted, extended region. The overall compactness of the N-terminal domain is therefore likely to be low.
Modeling of the Terminal Domains
We assessed whether the predicted helical elements were energetically favored within the context of a large unfolded N-terminal domain, and examined the fold of the smaller C-terminal domains, by de novo structure prediction using Rosetta. A very large number (1 million per domain) of candidate folds were generated to increase the likelihood that physically realistic folds were sampled (Figure 2a). The energetically most probable models, according to the Rosetta energy function, were then identified, reducing the set to 200000 models per domain (Figure 2a). From here, redundancy in the obtained folds was further decreased by clustering according to the rmsd of the structures; only the predicted structured elements were used in the fitting and calculation of the rmsd to reduce noise from the coiled regions. The clustering procedure required two stages because of the computational requirements for clustering such a large number of folds. The general properties of the models, according to the calculated radius of gyration (Rg), were similar during the energy filtering and clustering stages (Figure S4a,b of the Supporting Information), and more physically reasonable folds, as measured using the Rosetta score (ERosetta), were retained (Figure S4d,e of the Supporting Information).
Models of SERT Terminal Domains Contained Secondary Structure
After filtering by energy and clustering by structural similarity, we were left with 1821 N-terminal domain and 231 C-terminal domain models (in sets Nclust2 and Cclust2, respectively). These distinct low-energy models contain significant amounts of secondary structure (Figure 2f), consistent with the sequence-based predictions (Figure 1a,b). Specifically, within the N-terminal domain, three main helical segments were identified in a majority (>75%) of the models; these helices comprise residues 10–14, 18–24, and 68–75, with a total of 20 residues or ∼25% of the domain. In the C-terminal domain, helical domains were also found (Figure 2f). As the secondary structure prediction is one of the input parameters for the de novo modeling, we conducted a set of control modeling calculations, in which minimal secondary structure was provided (see the SSP-full-SERT prediction in Figure 1a). The models produced using this approach had higher Rosetta energy scores; i.e., they were energetically less favorable (Figure S4d of the Supporting Information), suggesting that, for the SERT terminal domains, some folded elements are indeed energetically favorable.
NMR Measurements on the Isolated SERT N-Terminal Domain
To assess experimentally the predicted secondary structure in the N-terminal domain of SERT, a construct of a His-tagged N-terminal domain (83 amino acids) (SERT-Nter-H8) was obtained. The 1D proton NMR spectrum of SERT-Nter-H8 showed limited dispersion of the amide proton signals (Figure 3a), indicating that the protein did not contain significant amounts of stable β-sheets or tertiary contacts. However, as proton amides point toward the solvent in α-helices, stably formed helical elements that are loosely packed cannot be excluded on the basis of this spectrum.
Figure 3.
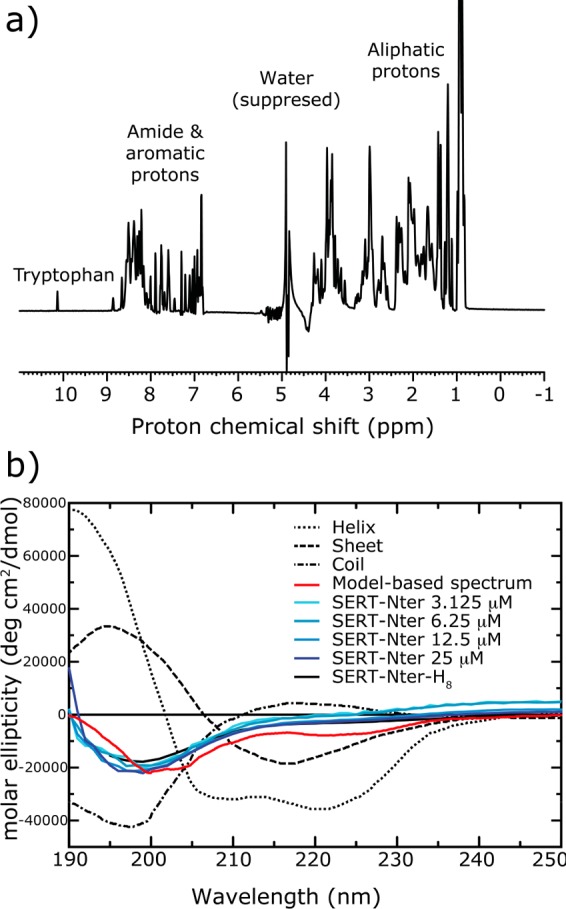
Structural analysis of the isolated N-terminal domain of SERT. (a) One-dimensional proton NMR spectrum of SERT-Nter-H8. The narrow shift dispersion (6.8–8.8 ppm) of the amide protons indicates significant conformational flexibility of the N-terminal domain of SERT. Several regions of the spectrum are marked. Signals at 0.9 ppm were cut for better visibility of the tryptophan signal. (b) CD spectra of SERT-Nter at varied protein concentrations (blue) and SERT-Nter-H8 (solid black line) constructs, compared to the spectrum computed on the basis of the percentages of helix in models of the isolated N-terminal domain (red). For reference, the ideal curves for α-helix (dotted line), β-sheet (dashed line), and random coil (dotted–dashed line) are also shown. The computed curve is a linear combination of these curves, weighted according to the percentages of each secondary structure, which is known to be a reasonable first approximation.47
DOSY measurements were then performed in the same buffer as that used to record the 1D spectrum, at a protein concentration of 100 μM. Fits of the decay were performed at two positions of the spectrum and at two temperatures. We calculated the hydrodynamic radius, Rh, for these four fits yielding values between 24.2 and 25.0 Å. Using an experimentally derived relationship between Rh values for native and denatured proteins, the expected values for a globular or unfolded SERT-Nter-H8 (95 amino acids) would be 17.8 or 29.6 Å, respectively.44 These results support the notion that the N-terminal domain contains a significant fraction of intrinsically disordered residues, alongside structured elements that are not likely to be stable β-sheets.
CD of the Isolated SERT N-Terminal Domain
As an alternative approach, the secondary structure of SERT was analyzed by measuring the CD spectrum of the isolated His-tagged SERT-Nter-H8 as well as of a construct lacking the histidine tag (SERT-Nter). The CD spectra of the two constructs were similar, largely independent of protein concentration (Figure 3b, blue lines), and demonstrated clear features of high “random-coil” content, consistent with the structure predictions (Figures 1 and 2) and NMR (Figure 3a) measurements. Quantification of the curves using DichroWeb (see Experimental Procedures) produced results consistent with a significant proportion of random coil (e.g., ∼35%), as well as “turn” (e.g., ∼17–24%). Nevertheless, the quantitation was highly sensitive to the choice of software and reference set, with large variations in the expected proportion of helix. Moreover, most of the estimates contained significant fractions of strand (not shown). Given that β-stranded elements can be clearly ruled out by the 1D NMR data (Figure 3a), we instead opted for a more direct comparison with the structural models. Specifically, we calculated a theoretical CD spectrum for a linear combination of “ideal” spectra weighted according to the percentages of secondary structure found in the models of the isolated N-terminal domain. These percentages were 29 ± 6% helix, 1.0 ± 0.2% strand, 39 ± 7% turn, and 31 ± 6% unstructured (Figure 2f; turn and unstructured residues are both assigned to the random-coil component). Reassuringly, this model-based predicted CD spectrum (Figure 3b, red line) overlays well with the experimental spectra (Figure 3b, blue lines), indicating that the extent of secondary structure in the models is consistent with the CD measurement. Altogether, these results are consistent with the prediction that the N-terminal domain contains unstructured elements separated by two or more helices.
Modification of Sec24C Binding by Disruption of a C-Terminal Domain Helix
One of the most reliable predictions of the computational models is that the C-terminal domain contains a helical element immediately after the last TM helix, i.e., at residues 599–611. A similar helical segment is observed in residues 585–595 of dDAT at the beginning of the C-terminal domain,14 even though there is significant sequence divergence between dDAT and SERT (Figure S5 of the Supporting Information), particularly after the helix. This helix in SERT is of particular interest because it contains the motif RI, which upon being mutated to AA abolishes interaction with the COPII component Sec24C.7,8 Moreover, mutation of the subsequent residue K610 to tyrosine switches the specificity to Sec24D, whereas alanine is tolerated.7,8 Accordingly, we introduced a proline residue after the RI motif at position K610, whose presence should break the predicted helix and thereby disrupt its interaction with Sec24C. Proline residues lack an amide hydrogen atom and are thus unable to hydrogen bond to the residue located four positions upstream (N-terminal). This means that proline cannot be tolerated after the first three residues of a helix.56 The K610P mutant was introduced into a construct of SERT tagged with CFP and YFP at the N- and C-termini, respectively (C-SERT-Y57) and transiently expressed in HEK-293 cells. As predicted, the K610P mutant did not reach the cell surface and remained confined to the ER (Figure 4). In contrast, and as expected, the control modification (K610A) resulted in protein exclusively localized to the cell surface (Figure 4) similar to wild-type protein. Furthermore, consistent with the observed localization, [3H]-5-HT transport was undetectable for SERT-K610P, whereas SERT-K610A took up 5-HT at rates similar to those of the wild type (Table 1). These results are consistent with the presence of a helical segment in the C-terminal domain between residues 599 and 611, providing confidence in the predicted secondary structures.
Figure 4.
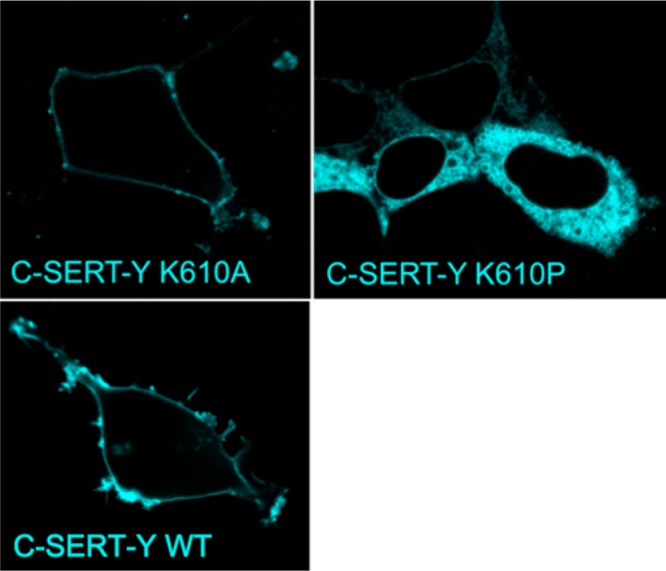
Intracellular retention of C-SERT-Y K610P, but not of WT C-SERT-Y or C-SERT-Y K610A. Confocal images show the lack of surface expression of C-SERT-Y K610P expressed in HEK293 cells. In contrast, C-SERT-Y K610A is transported readily to the cell surface and C-SERT-Y K610A and WT C-SERT-Y are both found at the cell surface. Shown are representative images, of three independent transfections with identical results.
Table 1. Kinetic Parameters for the Uptake of [3H]-5-HT into Cellsa.
| Vmax (% of control) | KM (μM) | |
|---|---|---|
| WT C-SERT-Y | 106.4 ± 0.5 | 3.4 ± 0.1 |
| A14P | 173 ± 2.5 | 3.2 ± 0.2 |
| Q22P | 52.7 ± 0.6 | 2.1 ± 0.1 |
| Q22A | 252.0 ± 7.9 | 3.9 ± 0.4 |
| N24P | 222.7 ± 5.1 | 3.4 ± 0.3 |
| N24A | 294.9 ± 23.1 | 6.4 ± 1.4 |
| T69Y | 51.3 ± 1.6 | 2.3 ± 0.3 |
| L70P | 88.5 ± 1.4 | 2.9 ± 0.2 |
| V71P | 83.9 ± 1.4 | 3.9 ± 0.2 |
| V71E | 54.9 ± 0.5 | 1.6 ± 0.1 |
| L74P | 249.2 ± 16.6 | 6.4 ± 1.1 |
| L74A | 121.9 ± 11.1 | 4.8 ± 1.3 |
| K610A | 70.0 ± 8.4 | 7.8 ± 2.4 |
| K610P | <20% of WT | not detected |
Uptake experiments employing [3H]-5-HT in cells transiently expressing WT C-SERT-Y and the indicated mutants (using C-SERT-Y as the basis; CaPO4 transfection method). Vmax values are expressed as a percent of control, i.e., the mean of all WT C-SERT-Y uptake values, to take differing expression levels into account. All experiments were performed in triplicate determinations (n = 3). Statistical differences were not observed between C-SERT-Y and mutants after the application of one-way ANOVA followed by a Bonferroni post hoc test. We did not include SERT-K610P in our statistical analysis because the level of uptake was exceedingly low and no reliable KM value could be detected.
Alteration of FRET by Mutation in Predicted N-Terminal Domain Helices
We tested the prediction that the N-terminal domain contains helical segments by taking advantage of the strong resonance energy transfer between the terminal fluorescent tags in C-SERT-Y. This FRET is sensitive to conformational changes in the protein.58 Accordingly, we introduced helix-breaking mutations within the predicted helices, expecting that these mutations would translate into changes in the N-terminus–C-terminus distance. Substrate translocation involves conformational changes that affect the FRET, so we eliminated these effects by recording FRET in a physiological extracellular sodium concentration, which is believed to bias C-SERT-Y toward the outward-open conformation.59 A number of experiments verify this assumption that the sodium-loaded state of C-SERT-Y is predominantly outward-open. (i) The reactivity of a cysteine introduced into the cytoplasmic permeation pathway (here measured as inhibition of β-CIT binding by the cysteine reactive reagent MTSEA) decreased markedly (requiring higher MTSEA concentrations) in the presence of sodium, compared to that under control conditions (Figure 5a), indicating that the cytoplasmic pathway of C-SERT-Y is significantly less accessible in the presence of sodium. Similar observations have been made previously for the conformational preference of LeuT.60,61 (ii) By contrast, saturating concentrations of 5-HT or ibogaine have been shown to shift the conformational equilibrium of C-SERT-Y to an inward-open state, as measured by FRET between the CFP and YFP probes59 and cytoplasmic pathway accessibility.4,48 (iii) Importantly, however, the addition of 10 μM paroxetine, which binds to the outward-open state of SERT, was shown to reveal no additional change in FRET relative to that with sodium alone.58
Figure 5.

Conformational behavior of C-SERT-Y and mutants thereof. (a) β-CIT binding to SERT after treatment with the indicated concentration of MTSEA, in the presence (○) or absence (●) of sodium, expressed as a percentage of binding without MTSEA treatment. Sodium was replaced by NMDG+. (b) FRET imaging and pixel by pixel analysis of the resulting images performed in transiently transfected HEK-293 cells as described in Experimental Procedures. The bar graph shows the means ± SEM of the measured FRET efficiencies for the WT (red) and mutants thereof (the abbreviations on the y axis denote the amino acids before and after mutation in the single-letter code and its position in the SERT amino terminus). The number of experiments is provided on the right of the y-axis; the total number of cells that were evaluated is given in the Experimental Procedures. Statistical significance was tested by one-way ANOVA followed by a Bonferroni post hoc test (***p < 0.001; ****p < 0.0001 compared to WT C-SERT-Y).
We therefore proceeded to assess whether helix-breaking mutations in the N-terminal domain affect the distance between the two fluorophores by recording FRET efficiencies and comparing them to results obtained for unmodified C-SERT-Y. All constructs were transiently expressed in HEK-293 cells and observed to reach the cell surface, albeit to differing extents (Figure S6 of the Supporting Information). Likewise, although the transport characteristics were similar to those of WT C-SERT-Y with respect to the substrate affinity (i.e., Km value), any changes in the Vmax value that were observed reflected the changes in the expression level (Table 1). In spite of these functional similarities, statistically significant changes in FRET efficiency were measurable for several of the site-specific mutants (Figure 5b and Figure S7 of the Supporting Information).
In the N-terminal domain, helices were predicted for residues ∼9–16 (hI), ∼8–24 (hII), ∼40–47 (hIII), and ∼68–76 (hIV). The three most confidently predicted helix conformations (hI, hII, and hIV) were tested using proline mutations A14P, Q22P, N24P, L70P, V71P, and L74P, as follows. The first helix of the N-terminal domain (hI) was predicted by PSIPRED to comprise residues Q11–E16 (Figure 1a), and we observed a high frequency of helical structure between residues Q9 and A14 (Figure 2b). Insertion of a proline should not be tolerated at position 14 within this helix. However, we observed no change in FRET for the A14P mutation (Figure 5b), suggesting that either hI is not present or that the helix starts after the 10th residue. In addition, this helix might be poorly constrained because of its location at the beginning of the N-terminal domain, so it is possible that disruptions in this region do not translate into detectable changes in average relative distance and hence in resonance energy transfer. We note that this helix was predicted with the lowest level of confidence of the three main helices in the N-terminal domain of SERT and has the weakest sequence conservation and, therefore, may be present in some species and not in others.
A second helix at the N-terminus of SERT (hII) is predicted to include residues G18–E23 [according to PSIPRED (Figure 1a)] or to extend to N24 [in the models (Figure 2b)], though this region has a poor helical propensity according to the meta-structure prediction (Figure 1b). Interestingly, the average local secondary values in the latter prediction are close to zero, suggesting equivalent propensities for α-helical and unstructured/extended conformations (Figure 1b). We introduced mutation Q22P or N24P to destabilize a putative helix in this region and observed in each case a significant increase in the distance between the N- and C-termini, detected by changes in FRET efficiency (Figure 5b). By contrast, replacement with alanine, which should favor helix formation, caused no statistically significant changes in FRET efficiency in Q22A or N24A (Figure 5b), consistent with the predictions. These findings are consistent with a helix in this region being disrupted by the proline mutations and unaffected by alanine mutations.
The last predicted helix of the N-terminal domain (hIV), which immediately precedes the TM segments of SERT, begins around residues T68–L70 and ends after Q76 (Figures 1 and 2). Statistical analysis also predicts with a high probability that T69 is the so-called helix capping (i.e., first) residue.56 Specifically, within the 68-TTLVA-72 sequence, the residues have the following likelihoods of being a capping residue, normalized to amino acid occurrence: 1.13 for T68, 1.41 for T69, 0.84 for L70, 0.70 for V71, and 1.43 for A72.56 FRET measurements indicated that proline is tolerated in L70P and V71P (Figure 5b), suggesting that the amino acid located four residues N-terminal to V71 (position 67) is not in a helix. To test this prediction further, we replaced position 69 with tyrosine, which has only an average frequency (0.88) at helix-capping sites, compared to 1.41 for threonine, which is the second most abundant residue at N-terminal helix caps.56 The observed change in FRET efficiency upon introduction of the T69Y mutation (Figure 5b) is therefore consistent with the notion that T69 caps the beginning of the helix. Substituting proline, but not alanine, for L74 also altered the C-SERT-Y resonance energy transfer (Figure 5b). This provides further support for the presence of a helix that starts at least at residue 70. Finally, the sequence at the C-terminal end of this helix is 73-ELHQGE-78, with G77 being the first residue after the C-terminal helix cap (i.e., Q76), resembling an αL-type capping motif, a common helix termination motif.56,62 Indeed, G77 is not helical in a high percentage of our models (Figure 2b).
In summary, the FRET results are consistent with the prediction of the second (hII) and the last (hIV) helices of the N-terminal domain; the lack of an effect for the first putative helix (hI) in the N-terminus, however, cannot conclusively rule out a helix at this position as described above.
Filtering Terminal Domain and Full-Length Models Using FRET Data
Using the FRET results, we designed filters that allowed us to further narrow the 1821 energetically reasonable and distinct N-terminal folds to a smaller set of plausible models. Specifically, the N-terminal domain structures obtained after clustering (1821 Nclust2 models) were reduced to a subset of 122 models (Nclust2*). This was achieved by assuming that G18, D20, Q22, N24, T69, L70, and L74 are α-helical, whereas nonhelicity was imposed for A65 (four residues upstream from T69) and T68 (because T69 appears to cap the helix). Given the uncertainty in the result for the first N-terminal helix, we chose to neither exclude nor select for models with helices in that region.
This filtered, FRET consistent Nclust2* set of N-terminal domain models was used to construct full-length models of SERT, by first joining them to the model of the TM domain and then combining them with the C-terminal domain models from set Cclust2 (Figure 2e), resulting in a set of 28182 full-length models (Fall). These full-length models were then further filtered using experimental data that could be applied to only the full-length protein. Specifically, cysteine reactivity measurements indicate that C15 and C622 are exposed to the solvent, whereas C21 is not.32,33 Although we cannot rule out the possibility that C21 was masked by interacting proteins during the aforementioned experiments, we assumed that the conformation of SERT itself dictates its lack of reactivity. These criteria reduced the number of full-length models to 1724 (in set F1724), without biasing toward high-energy models (Figure S2e of the Supporting Information; Fall vs F1724) or significantly altering the properties of the folds, as measured by compactness (Figure S4c of the Supporting Information; Fall vs F1724).
Further Filtering the Full-Length Models
One conclusion from the modeling of the isolated terminal domains that was supported by the FRET measurements was that residues T69–Q76 of SERT form a helix (hIV). To identify an additional filter to use with our full-length models, we introduced a mutation into C-SERT-Y that might destabilize tertiary packing at a position in the center of this helix in the full-length models. In particular, residue V71 is in a hydrophobic stretch in this helix (Figure 1a) in a region that is predicted to be relatively compact (Figure 1b), so that any hydrophobic packing interactions might be disrupted by mutation to glutamate. However, no change in FRET efficiency was observed for V71E (Figure 5b), from which we concluded that position 71 is sufficiently solvent-exposed that the protein can tolerate a charged side chain without a significant energy cost. Accordingly, we reasoned that a full-length model containing the V71E mutation in silico should have a Rosetta energy similar to that of the corresponding WT model, i.e., ΔERosetta ∼ 0 arbitrary unit. Thus, from the full-length SERT models in F1724, we selected the 100 models that best met this criterion [Fout100 (Figure 2e)]. The outward-open model with the lowest Rosetta score of those 100 models that also contains a β-strand in at least two residues of the putative PDZ binding motif (see below) was chosen as an example full-length SERT model for visualization (Figure 6). While it should be noted that the relative orientations of the secondary structure elements within each terminal domain vary in the different Fout models, this figure at least provides a sense of the volume and relative locations of the N- and C-terminal domains relative to the transmembrane segment, as well as of the relative sizes of the secondary structure elements.
Figure 6.
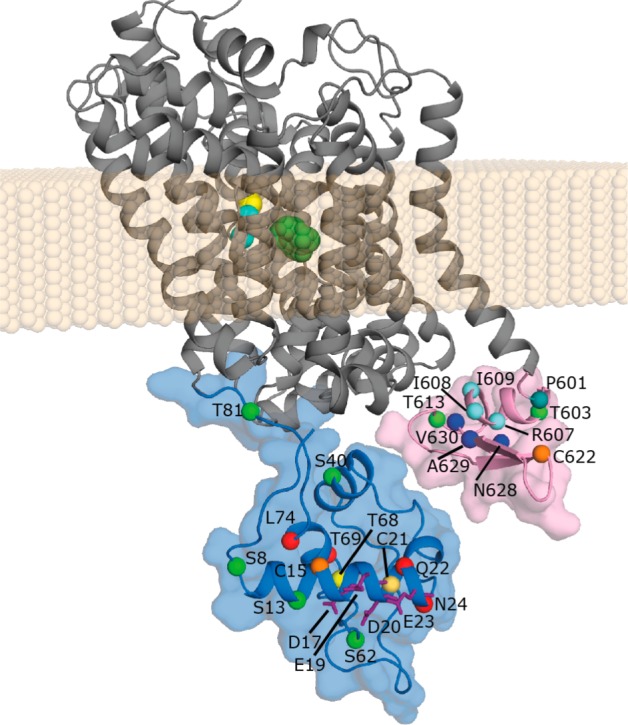
Selected model of full-length SERT, out of 100 models of an outward-open state. The TM domain is shown as cartoon helices (gray), while the N- and C-terminal domains (light blue and pink, respectively) are represented by both cartoons and van der Waals surfaces. The approximate membrane region is represented as beige spheres, while ions (cyan spheres) and substrate (green sticks) are shown bound in the central binding sites. The Cα atoms of specific residues are highlighted, namely, residues predicted to bind syntaxin 1A (purple sticks) and nNOS (dark blue spheres); solvent accessible residues C15 and C622 (orange spheres) and inaccessible residue C21 (light orange spheres); residues predicted to form PKC phosphorylation sites (light green spheres) or to bind Sec24C (pale blue spheres); residue P601, which breaks the TM12 helix (teal); and residues Q22, N24, T69, and L74 that are α-helical (red spheres) and residue T68 that is not α-helical (yellow spheres) according to the FRET measurements. Note that the distance between the closest atoms in the terminal domains is ≥9 Å and the apparent closeness is a consequence of the viewing angle.
Further filtering of the models using conservation analysis was considered but found not to be reliable for the SERT terminal domains. Conservation analysis (used in, e.g., ProQ263 or ConQuass64 model quality assessment functions) assigns a model a higher score if the variable residues are exposed and conserved residues are buried. However, we estimate that 60% of the residues in the N- and C-terminal domains contribute to either known or predicted regulatory binding sites or post-translational modification sites. These sites tend to be conserved but exposed, breaking the typical pattern. Thus, although we provide ProQ263 scores of the Fout100 models in the Supporting Information, we have not used them for filtering at this stage.
Analysis of the Terminal Domain Positions
Instead of further filtering, we analyzed all the best models of SERT to assess the positional variability of the SERT terminal domains in the context of the full-length protein (Figure 7). The N- and C-termini did not randomly explore all of the available conformational space but instead were predicted to occupy two specific loci, both before [Fall (Figure 7a)] and after filtering out less likely models [F1724, Fout100 (Figure 7b,c)]. These loci appear even smaller upon comparison of the center of mass of the domain (Figure 8), rather than the three terminal residues (Figure 7), because in different folds the terminal residues are found in different locations.
Figure 7.
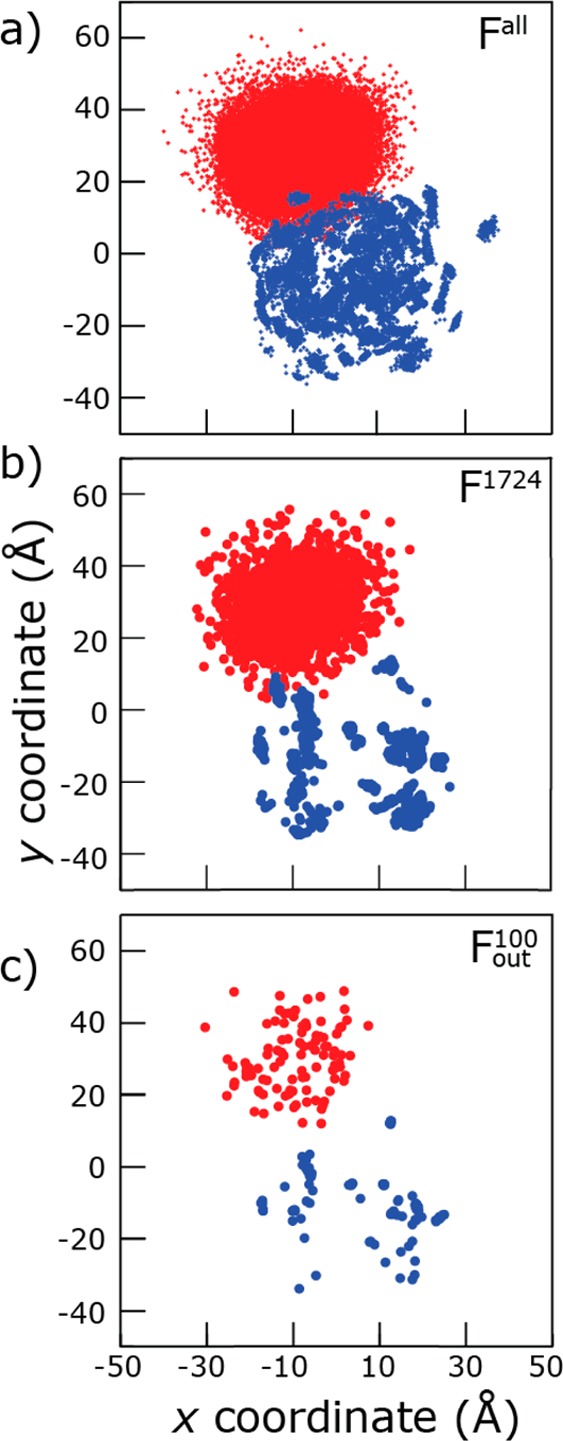
SERT termini are predicted to be limited to specific loci. Projections onto the x–y plane of the center of mass of the first or last three Cα atoms of the N-terminus (blue) and C-terminus (red) of outward-facing models of SERT. Coordinates are plotted for each model in sets Fall (a), F1724 (b), and Fout100 (c). Models were structurally aligned to one another by superimposing the backbone atoms of the scaffold domain (TM3–5 and TM8-12). The membrane plane is coincident with the x–y plane.
Figure 8.

Arrangement of terminal domains in SERT comparing inward- and outward-facing models. (a) Projection onto the x–y plane of the center of mass of all Cα atoms in the N- and C-terminal domains for each model in the sets Fout100 and Fin, after superposition on the scaffold region. The coordinates of the termini in the outward-facing models, Fout100(N) and Fout(C), are colored blue and red, respectively, showing little difference between the two states. The coordinates of the C-terminal domain of the inward-facing models Fin100(C) are colored brown. After the change to the inward-facing conformation, the N-terminal domain [Fin(N)] moves away from the C-terminal domain, although the extent of the change could be minimal [purple, Fin100(N)] or more extreme [cyan, Fin(N)*], depending on the degree of change in TM1a relative to the rest of the protein. The latter coordinates were determined by identifying the change in the position of the backbone nitrogen atom of K84 from TM1a when comparing the models of SERT with two alternate positions of TM1a (see the text). The surface of the TM region in the outward-facing conformation is shown (gray), highlighting residues from TM1 (green) and TM12 (orange). (b) Example full-length outward-open (blue, green, gray, and red) and inward-open (cyan, light green, light gray, and brown) models are represented as cartoons and viewed from the cytoplasm. The Cα atoms of the first and last residues are highlighted (spheres). The inward-open model (cyan, light green, light gray, and brown) is that obtained by using TM1a from the Fab-bound structure of LeuT (PDB entry 3TT3) as a template, i.e., indicating the most extreme expected conformational change. (c and d) Interactions between N-terminal domain residues [R79 and W82 (blue sticks and surface)] and those belonging to the TM region [F88, F347, Y350, and D452 (green sticks and surface)] in an outward-open (c) or inward-open (d) conformation. TM1a is colored dark blue. The approximate membrane region is represented as beige spheres.
We then assessed the effect of the transport-related transition on the position of the terminal domains by comparing outward- and inward-facing models and assuming that the scaffold region (TM3–5 and TM8–12) is essentially static. In this analysis, the locus of the C-terminal domain did not change significantly (Figure 8a,b), whereas the SERT N-terminal domain locus shifted significantly. These changes reflected differences in the position of TM1a and caused an increase in the distance between the N- and C-terminal domains, consistent with the observed decrease in the FRET efficiency in C-SERT-Y upon addition of substrate.59
We assessed the probable extent of this N-terminal domain movement by comparing SERT models that were open to differing degrees (see Experimental Procedures). Assuming a very conservative model, the intracellular R79–D452 salt bridge that stabilizes the outward-facing state in, e.g., DAT65 (see Figure 8c) can still be formed, and the outward to inward change is ∼6 Å (Figure 8a, blue vs purple). Importantly, this shift was larger than the conformational flexibility (∼3 Å) of the three-residue Q76-G77-E78 linker that tethers the N-terminal domain in the outward-facing models (see Experimental Procedures). Moreover, if we assume that a greater conformational change in TM1a was necessary to fully open the pathway (see Experimental Procedures), the R79–D452 salt bridge was broken as expected (Figure 8d), and the movement of the end of TM1a was ∼17 Å (Figure 8a, blue vs cyan). We note that the N-terminal domain has greater conformational freedom in inward-facing states (∼9 Å more diversity in the y-dimension than in outward-facing states) because of residues R79–T81 no longer interacting with the transmembrane domain (Figure 8d), though this flexibility is not sufficient to allow those residues reach across and re-form the R79–D452 salt bridge unless TM1a or the bundle also moves. In summary, even allowing for flexible linker segments, the modeling suggests a net increase in the distance between the terminal domains upon the substrate-induced conformational change.
Predicted Domain–Domain Contacts and Accessibility
To identify whether the terminal domains contact each other in any of the models, we calculated the minimal distance between any pair of residues in each model. In outward-open models, the minimal distance was sometimes as small as 5 Å (Figure S8b of the Supporting Information), suggesting that interactions might form between the two domains in this state of the transport cycle. By contrast, in the inward-open models, the minimal distance between domains was shifted to larger values with a broad peak at 25–30 Å, and thus, direct interactions are significantly less likely in this state.
The predicted change in the relative positions of the SERT terminal domains during the transport-associated conformational change indicates that some residues become more or less exposed during the transport cycle. Given that this might influence the accessibility to regulatory proteins, we therefore calculated the solvent accessible surface area (SASA) for each residue in models from sets Fout100 and Fin (Figure S9 of the Supporting Information). However, no consistent pattern of interactions involving direct contact between the terminal domains was detected for these models. The only changes in solvent accessibility were found for the intracellular interaction network (Figure 8c,d) or were due to the proximity of residues to the membrane mimetic used during the SASA calculation (Figure 6, beige spheres).
Discussion
Because of their inherent flexibility, it has been notoriously difficult to characterize the structure of intracellular N- and/or C-terminal domains of polytopic membrane proteins. In SERT, however, it is evident that these segments serve important roles in folding,66 ER export,7,8 and aspects of transport.13 In addition, they receive regulatory stimuli via kinases67−70 and other proteins.6 Analogous observations have been made for other NSS members.1 The landmark publication of a eukaryotic NSS structure (dDAT) has contributed enormously to our understanding of the transmembrane segments of this transporter family.34 However, the difficulty of crystallizing proteins with flexible segments is underscored by the requirement that the dDAT construct be truncated by the first 20 residues as well as by residues in an extracellular loop.34 Moreover, even when present within the protein construct in the crystal, flexible elements often cannot be resolved. Thus, aspects of membrane protein regulation often remain obscured even after their core structures have been reported.
Given these difficulties, alternative approaches to gaining additional insights become necessary. Here, we combined bioinformatics, computational modeling, NMR, CD, and FRET measurements to identify structural features of the terminal domains of SERT. The NMR, CD, and FRET measurements are consistent with the prediction of structured (helical) elements, both in isolated N-terminal domain constructs and in the context of the full-length protein. Moreover, the FRET measurements provide support for the specific location of two helices in the N-terminal domain, and a third in the C-terminal domain. The modeling illustrates that such structured domains are located in both ends of SERT but are interspersed with unstructured regions. It is of particular interest to note that several regulatory interaction sites identified for SERT appear to lie within these structured regions (see below).
The full-length models of SERT identify common features reflecting the location and separation of the domains, even without requiring a detailed analysis that would be otherwise beyond the resolution and confidence level of the de novo modeling. For example, analyzing the candidate full-length models (in sets Fall and F1724), as well as the conformations most consistent with experimental data (in set Fout100), revealed that the domains occupy relatively well-defined loci. This localization reflects their length and partially folded nature, as well as interactions with the transmembrane region, particularly in the outward-open state.
It should be mentioned that the terminal domain models may well be overly compact, because of the energetic term in the Rosetta force field that favors compactness.17 While the compactness term is unlikely to force the formation of α-helices, it may compress the unstructured regions to some degree. Another concern could be that the Rosetta energy function is constructed to reflect well-structured proteins in the PDB. Indeed, models of the N-terminal domain based on a secondary structure prediction containing a much smaller fraction of structured residues [SSP-full-SERT (Figure 1a)] had poorer Rosetta energies [NEfilt* (Figure S4e of the Supporting Information)], consistent with the energy function favoring more structured domains. However, the fact that the proportions of helix and strand in the Fout100 selected models are not greater than those in the input predictions is suggestive that the Rosetta energy function does not excessively bias toward structured elements. Of course, the selection of fragments during the Rosetta model building is also organized to ensure that the percentages of coil, sheet, and helix match that of the secondary structure prediction, at least initially. Nevertheless, because Rosetta allows changes in torsion angles of the backbone of the flanking residues subsequent to fragment selection, there is at least the potential for sampling of more or less structured segments. In the end, the agreement between the NMR and CD spectra and the models provides the strongest support for the proportions of secondary structure predicted in the models. Thus, the full-length models of SERT, despite their limited resolution, allow a general analysis of available experimental data relating to regulation within a structural context. In the following, we discuss the implications for four regulatory factors: nNOS, misfolding, kinases, and syntaxin 1A.
nNOS
The last few residues (with the sequence NAV) of the C-terminal domain of SERT have been proposed to adopt a noncanonical PDZ binding motif that may interact with nNOS.71 The extended conformation required for such an interaction72 was observed in a fraction (6%) of the full-length models (see Figure 6), suggesting that this interaction is possible, although not very probable, and that if such a “noncanonical” PDZ binding domain does bind, then the NAV segment might alternate between two different folds to achieve the interaction.
Misfolding
Residues P601 and G602 are required for the correct folding of SERT.66 Specifically, mutation of both residues to alanine results in SERT retention in the ER, aggregation, and association with calnexin chaperones.66 Proline and glycine residues tend to break α-helices, and consequently, the helix in TM12 is terminated before P601/G602 in all 100 selected models (e.g., Figure 6), in accordance with the template structure, dDAT, which is also broken in this region. Because alanine residues have a higher α-helical propensity, we hypothesize that the double alanine mutation66 causes TM12 to become continuous with the first helix of the C-terminal domain. Indeed, the predicted secondary structure according to PSIPRED after replacing these two positions in the sequence was helical, with confidence levels of 55 and 81% for positions 601 and 602, respectively. Such a structural change is likely to significantly alter the position of the C-terminal domain, explaining the observed misfolding of the double alanine SERT mutant.
Kinases
Phosphorylation levels of SERT are increased upon PKC activation,67−70 although it is not yet clear whether this phosphorylation is direct or instead induced by PKC. After reproducing predictions73 that any direct PKC phosphorylation would occur at S8, S13, S40, S62, T81, T603, and/or T613 (see Experimental Procedures), we analyzed the solvent accessibility of these residues in the Fout100 set of structural models, assuming access as a requirement for phosphorylation. Most of the seven predicted PKC sites (including both the R/K and the S/T of the motif) are exposed in some fraction of these models (Figure S9 of the Supporting Information), and most appear to be exposed independent of the conformation of the protein. Thus, unfortunately, these models cannot yet discriminate between putative phosphorylation sites.
Syntaxin 1A
SERT is known to interact with syntaxin 1A on the basis of pull-down assays, which showed syntaxin 1A coprecipitation with the N-terminal domain of SERT, but not with other regions of SERT.9 Specifically, residues E16, D17, E19, D20, and E23 of human SERT were proposed to be syntaxin 1A binding residues, because the SERT mutant in which these five residues are mutated to alanine no longer associates9 with syntaxin 1A. Of these five carboxylic residues, four are conserved in rat SERT but E16 is replaced with alanine and thus may not be essential (Figure 1a). All four residues are exposed in >40% of the 100 best models of full-length SERT (Figure S9 of the Supporting Information), of which E19 and E23 are consistently the most accessible.
Interestingly, all four syntaxin 1A binding residues are predicted to be located in helix hII, both by PSIPRED (Figure 1a) and by the modeling (Figure 2f), though not by meta-structure-based prediction (Figure 1b), and supported by observed FRET changes in Q22P and N24P (Figure 5b). We therefore propose that the binding of the α-helical H3 domain of syntaxin 1A with the N-terminal domain of SERT involves helix–helix packing, as found in other interactions involving H3 of syntaxin 1A (e.g., ref (74)).
Finally, an important consideration that may be relevant for any regulatory mechanism is the increase in distance between the domains upon the substrate-driven transition from outward- to inward-facing states. This increase reflects the separation of transmembrane helices in the bundle relative to the scaffold, with any further outward motion of TM1a likely to amplify this effect. In general, the predicted change in distance is in agreement with the observed decrease in FRET efficiency in C-SERT-Y upon addition of substrate.59 This conformational change may allow specific regulatory protein–protein interactions to occur only in particular conformational states of the transporter, e.g., the inward-open state. Higher-resolution structural data for the domains and their interaction partners will be required to address this intriguing notion in more detail.
In conclusion, although of limited resolution, our hybrid de novo/homology models provide the first structure-based insights into the tertiary arrangement of the SERT terminal domains, which is extremely difficult to access using crystallography. The full-length models of SERT provide a hypothesis for the interaction mode of syntaxin 1A and may be useful for identifying further specific interaction sites. This work should therefore be useful for designing further experiments to understand the regulation of serotonin uptake.
Acknowledgments
We thank José Faraldo-Gómez, Claudio Anselmi, Lee Whitmore, and Johannes A. Schmid for fruitful discussions and technical assistance and Michael Freissmuth and José Faraldo-Gómez for suggestions about the manuscript.
Glossary
Abbreviations
- SERT
serotonin transporter
- dDAT
D. melanogaster dopamine transporter
- CD
circular dichroism
- NSS
neurotransmitter:sodium symporter
- FRET
fluorescence resonance energy transfer
- nNOS
neuronal nitric oxide synthase
- PKC
protein kinase C
- DOSY
diffusion-ordered spectroscopy
- CFP
cyan fluorescent protein
- YFP
yellow fluorescent protein
- C-SERT-Y
CFP-SERT-YFP construct
- SASA
solvent accessible surface area.
Supporting Information Available
Nine figures, one table, and the selected 100 SERT models in inward-facing (Fin100) and outward-facing (Fout) conformations, containing ProQ2 and Rosetta scores (in the headers). This material is available free of charge via the Internet at http://pubs.acs.org.
Author Present Address
L.R.F and C.F.-F.: Computational Structural Biology Section, National Institutes of Neurological Disorders and Stroke, National Institutes of Health, Bethesda, MD 20824.
Author Contributions
L.R.F., H.H.S., R.K., G.R., and S.K.S. designed research. C.F.-F. and R.K. ran computational predictions. C.F.-F. and A.R.M. modeled structures. A.P., S.A., and T.C.S. measured CD spectra. T.C.S. measured NMR data. O.K., J.G., T.H., and S.T. conducted mutagenesis. A.P., S.T., and K.J. designed constructs and expressed and purified protein. S.T., J.G., and T.H. measured uptake or binding. L.R.F., T.S., and C.F.-F. analyzed computational data. S.K.S., S.A., C.F.-F., and R.K. analyzed CD data. H.H.S. measured and analyzed FRET data. L.R.F., S.K.S., R.K., and H.H.S. wrote the manuscript. All authors reviewed and commented on the manuscript.
This work was supported by grants to H.H.S. from the Austrian Science Fund/FWF (F35 and W1232), to R.K. (Grant W-1221-B03), to S.K.S. from the Goodman Gilman Yale Scholar Award, the Alfred P. Sloan Foundation, and the National Institutes of Health (R00MH083050 and R21MH098180), and to L.R.F. from the Max Planck Society and the Division of Intramural Research of the National Institute of Neurological Disorder and Stroke, at the National Institutes of Health.
The authors declare no competing financial interest.
Funding Statement
National Institutes of Health, United States
Supplementary Material
References
- Kristensen A. S.; Andersen J.; Jorgensen T. N.; Sorensen L.; Eriksen J.; Loland C. J.; Stromgaard K.; Gether U. (2011) SLC6 neurotransmitter transporters: Structure, function, and regulation. Pharmacol. Rev. 63, 585–640. [DOI] [PubMed] [Google Scholar]
- Krishnamurthy H.; Gouaux E. (2012) X-ray structures of LeuT in substrate-free outward-open and apo inward-open states. Nature 481, 469–474. [DOI] [PMC free article] [PubMed] [Google Scholar]
- Forrest L. R.; Rudnick G. (2009) The rocking bundle: A mechanism for ion-coupled solute flux by symmetrical transporters. Physiology 24, 377–386. [DOI] [PMC free article] [PubMed] [Google Scholar]
- Forrest L. R.; Zhang Y.-W.; Jacobs M. T.; Gesmonde J.; Xie L.; Honig B. H.; Rudnick G. (2008) Mechanism for alternating access in neurotransmitter transporters. Proc. Natl. Acad. Sci. U.S.A. 105, 10338–10343. [DOI] [PMC free article] [PubMed] [Google Scholar]
- Torres G. E.; Amara S. G. (2007) Glutamate and monoamine transporters: New visions of form and function. Curr. Opin. Neurobiol. 17, 304–312. [DOI] [PubMed] [Google Scholar]
- Chanrion B.; Mannoury la Cour C.; Bertaso F.; Lerner-Natoli M.; Freissmuth M.; Millan M. J.; Bockaert J.; Marin P. (2007) Physical interaction between the serotonin transporter and neuronal nitric oxide synthase underlies reciprocal modulation of their activity. Proc. Natl. Acad. Sci. U.S.A. 104, 8119–8124. [DOI] [PMC free article] [PubMed] [Google Scholar]
- Sucic S.; El-Kasaby A.; Kudlacek O.; Sarker S.; Sitte H. H.; Marin P.; Freissmuth M. (2011) The serotonin transporter is an exclusive client of the coat protein complex II (COPII) component SEC24C. J. Biol. Chem. 286, 16482–16490. [DOI] [PMC free article] [PubMed] [Google Scholar]
- Sucic S.; Koban F.; El-Kasaby A.; Kudlacek O.; Stockner T.; Sitte H. H.; Freissmuth M. (2013) Switching the clientele: A lysine residing in the C terminus of the serotonin transporter specifies its preference for the coat protein complex II component SEC24C. J. Biol. Chem. 288, 5330–5341. [DOI] [PMC free article] [PubMed] [Google Scholar]
- Quick M. W. (2003) Regulating the conducting states of a mammalian serotonin transporter. Neuron 40, 537–549. [DOI] [PubMed] [Google Scholar]
- Sung U.; Apparsundaram S.; Galli A.; Kahlig K. M.; Savchenko V.; Schroeter S.; Quick M. W.; Blakely R. D. (2003) A regulated interaction of syntaxin 1A with the antidepressant-sensitive norepinephrine transporter establishes catecholamine clearance capacity. J. Neurosci. 23, 1697–1709. [DOI] [PMC free article] [PubMed] [Google Scholar]
- Lee K. H.; Kim M. Y.; Kim D. H.; Lee Y. S. (2004) Syntaxin 1A and receptor for activated C kinase interact with the N-terminal region of human dopamine transporter. Neurochem. Res. 29, 1405–1409. [DOI] [PubMed] [Google Scholar]
- Binda F.; Dipace C.; Bowton E.; Robertson S. D.; Lute B. J.; Fog J. U.; Zhang M.; Sen N.; Colbran R. J.; Gnegy M. E.; Gether U.; Javitch J. A.; Erreger K.; Galli A. (2008) Syntaxin 1A interaction with the dopamine transporter promotes amphetamine-induced dopamine efflux. Mol. Pharmacol. 74, 1101–1108. [DOI] [PMC free article] [PubMed] [Google Scholar]
- Sucic S.; Dallinger S.; Zdrazil B.; Weissensteiner R.; Jorgensen T. N.; Holy M.; Kudlacek O.; Seidel S.; Cha J. H.; Gether U.; Newman A. H.; Ecker G. F.; Freissmuth M.; Sitte H. H. (2010) The N terminus of monoamine transporters is a lever required for the action of amphetamines. J. Biol. Chem. 285, 10924–10938. [DOI] [PMC free article] [PubMed] [Google Scholar]
- Penmatsa A.; Wang K. H.; Gouaux E. (2013) X-ray structure of dopamine transporter elucidates antidepressant mechanism. Nature 503, 85–90. [DOI] [PMC free article] [PubMed] [Google Scholar]
- Hamilton P. J.; Belovich A. N.; Khelashvili G.; Saunders C.; Erreger K.; Javitch J. A.; Sitte H. H.; Weinstein H.; Matthies H. J. G.; Galli A. (2014) PIP2 regulates psychostimulant behaviors through its interaction with a membrane protein. Nat. Chem. Biol. 10, 582–589. [DOI] [PMC free article] [PubMed] [Google Scholar]
- Bradley P.; Malmstrom L.; Qian B.; Schonbrun J.; Chivian D.; Kim D. E.; Meiler J.; Misura K. M.; Baker D. (2005) Free modeling with Rosetta in CASP6. Proteins 61, 128–134. [DOI] [PubMed] [Google Scholar]
- Rohl C. A.; Strauss C. E.; Misura K. M.; Baker D. (2004) Protein structure prediction using Rosetta. Methods Enzymol. 383, 66–93. [DOI] [PubMed] [Google Scholar]
- Jones D. T. (1999) Protein secondary structure prediction based on position-specific scoring matrices. J. Mol. Biol. 292, 195–202. [DOI] [PubMed] [Google Scholar]
- Konrat R. (2009) The protein meta-structure: A novel concept for chemical and molecular biology. Cell. Mol. Life Sci. 66, 3625–3639. [DOI] [PMC free article] [PubMed] [Google Scholar]
- Mayer C.; Slater L.; Erat M. C.; Konrat R.; Vakonakis I. (2012) Structural analysis of the Plasmodium falciparum erythrocyte membrane protein 1 (PfEMP1) intracellular domain reveals a conserved interaction epitope. J. Biol. Chem. 287, 7182–7189. [DOI] [PMC free article] [PubMed] [Google Scholar]
- Schedlbauer A.; Gandini R.; Kontaxis G.; Paulmichl M.; Furst J.; Konrat R. (2011) The C-terminus of ICln is natively disordered but displays local structural preformation. Cell. Physiol. Biochem. 28, 1203–1210. [DOI] [PMC free article] [PubMed] [Google Scholar]
- Naranjo Y.; Pons M.; Konrat R. (2012) Meta-structure correlation in protein space unveils different selection rules for folded and intrinsically disordered proteins. Mol. BioSyst. 8, 411–416. [DOI] [PubMed] [Google Scholar]
- Geist L.; Henen M. A.; Haiderer S.; Schwarz T. C.; Kurzbach D.; Zawadzka-Kazimierczuk A.; Saxena S.; Zerko S.; Kozminski W.; Hinderberger D.; Konrat R. (2013) Protonation-dependent conformational variability of intrinsically disordered proteins. Protein Sci. 22, 1196–1205. [DOI] [PMC free article] [PubMed] [Google Scholar]
- Daura X.; Gademann K.; Jaun B.; Seebach D.; van Gunsteren W. F.; Mark A. E. (1999) Peptide Folding: When Simulation Meets Experiment. Angew. Chem. 38, 236–240. [Google Scholar]
- Lindahl E.; Hess B.; van der Spoel D. (2001) GROMACS 3.0: A package for molecular simulation and trajectory analysis. J. Mol. Model. 7, 306–317. [Google Scholar]
- Kabsch W.; Sander C. (1983) Dictionary of protein secondary structure: Pattern recognition of hydrogen-bonded and geometrical features. Biopolymers 22, 2577–2637. [DOI] [PubMed] [Google Scholar]
- Joosten R. P.; te Beek T. A.; Krieger E.; Hekkelman M. L.; Hooft R. W.; Schneider R.; Sander C.; Vriend G. (2011) A series of PDB related databases for everyday needs. Nucleic Acids Res. 39, D411–D419. [DOI] [PMC free article] [PubMed] [Google Scholar]
- Sali A.; Blundell T. L. (1993) Comparative protein modelling by satisfaction of spatial restraints. J. Mol. Biol. 234, 779–815. [DOI] [PubMed] [Google Scholar]
- Stamm M.; Staritzbichler R.; Khafizov K.; Forrest L. R. (2013) Alignment of helical membrane protein sequences using AlignMe. PLoS One 8, e57731. [DOI] [PMC free article] [PubMed] [Google Scholar]
- Stamm M.; Staritzbichler R.; Khafizov K.; Forrest L. R. (2014) AlignMe: A membrane protein sequence alignment web server. Nucleic Acids Res. 42, W246–W251. [DOI] [PMC free article] [PubMed] [Google Scholar]
- Lomize M. A.; Lomize A. L.; Pogozheva I. D.; Mosberg H. I. (2006) OPM: Orientations of proteins in membranes database. Bioinformatics 22, 623–625. [DOI] [PubMed] [Google Scholar]
- Androutsellis-Theotokis A.; Ghassemi F.; Rudnick G. (2001) A conformationally sensitive residue on the cytoplasmic surface of serotonin transporter. J. Biol. Chem. 276, 45933–45938. [DOI] [PubMed] [Google Scholar]
- Androutsellis-Theotokis A.; Rudnick G. (2002) Accessibility and conformational coupling in serotonin transporter predicted internal domains. J. Neurosci. 22, 8370–8378. [DOI] [PMC free article] [PubMed] [Google Scholar]
- Yamashita A.; Singh S. K.; Kawate T.; Jin Y.; Gouaux E. (2005) Crystal structure of a bacterial homologue of Na+/Cl–-dependent neurotransmitter transporters. Nature 437, 215–223. [DOI] [PubMed] [Google Scholar]
- Blom N.; Gammeltoft S.; Brunak S. (1999) Sequence and structure-based prediction of eukaryotic protein phosphorylation sites. J. Mol. Biol. 294, 1351–1362. [DOI] [PubMed] [Google Scholar]
- Blom N.; Sicheritz-Ponten T.; Gupta R.; Gammeltoft S.; Brunak S. (2004) Prediction of post-translational glycosylation and phosphorylation of proteins from the amino acid sequence. Proteomics 4, 1633–1649. [DOI] [PubMed] [Google Scholar]
- Gnad F.; Gunawardena J.; Mann M. (2011) PHOSIDA 2011: The posttranslational modification database. Nucleic Acids Res. 39, D253–D260. [DOI] [PMC free article] [PubMed] [Google Scholar]
- Gnad F.; Ren S.; Cox J.; Olsen J. V.; Macek B.; Oroshi M.; Mann M. (2007) PHOSIDA (phosphorylation site database): Management, structural and evolutionary investigation, and prediction of phosphosites. Genome Biol. 8, R250. [DOI] [PMC free article] [PubMed] [Google Scholar]
- Bharadwaj R.; Windemuth A.; Nicholls A.; Sridharan S.; Honig B. (1994) Evaluating Electrostatic Solvation Energies of Biomolecules Using the Fast Multipole Algorithm. Biophys. J. 66, A290. [Google Scholar]
- Nicholls A.; Sharp K. A.; Honig B. (1991) Protein folding and association: Insights from the interfacial and thermodynamic properties of hydrocarbons. Proteins 11, 281–296. [DOI] [PubMed] [Google Scholar]
- Humphrey W.; Dalke A.; Schulten K. (1996) VMD: Visual molecular dynamics. J. Mol. Graphics 14, 33–38. [DOI] [PubMed] [Google Scholar]
- Delaglio F.; Grzesiek S.; Vuister G. W.; Zhu G.; Pfeifer J.; Bax A. (1995) NMRPipe: A multidimensional spectral processing system based on UNIX pipes. J. Biomol. NMR 6, 277–293. [DOI] [PubMed] [Google Scholar]
- Piotto M.; Saudek V.; Sklenar V. (1992) Gradient-tailored excitation for single-quantum NMR spectroscopy of aqueous solutions. J. Biomol. NMR 2, 661–665. [DOI] [PubMed] [Google Scholar]
- Wilkins D. K.; Grimshaw S. B.; Receveur V.; Dobson C. M.; Jones J. A.; Smith L. J. (1999) Hydrodynamic radii of native and denatured proteins measured by pulse field gradient NMR techniques. Biochemistry 38, 16424–16431. [DOI] [PubMed] [Google Scholar]
- Lobley A.; Whitmore L.; Wallace B. A. (2002) DICHROWEB: An interactive website for the analysis of protein secondary structure from circular dichroism spectra. Bioinformatics 18, 211–212. [DOI] [PubMed] [Google Scholar]
- Whitmore L.; Wallace B. A. (2004) DICHROWEB, an online server for protein secondary structure analyses from circular dichroism spectroscopic data. Nucleic Acids Res. 32, W668–W673. [DOI] [PMC free article] [PubMed] [Google Scholar]
- Whitmore L.; Wallace B. A. (2008) Protein secondary structure analyses from circular dichroism spectroscopy: Methods and reference databases. Biopolymers 89, 392–400. [DOI] [PubMed] [Google Scholar]
- Zhang Y. W.; Rudnick G. (2006) The cytoplasmic substrate permeation pathway of serotonin transporter. J. Biol. Chem. 281, 36213–36220. [DOI] [PubMed] [Google Scholar]
- Tavoulari S.; Forrest L. R.; Rudnick G. (2009) Fluoxetine (Prozac) binding to serotonin transporter is modulated by chloride and conformational changes. J. Neurosci. 29, 9635–9643. [DOI] [PMC free article] [PubMed] [Google Scholar]
- Schmid J. A.; Sitte H. H. (2003) Fluorescence resonance energy transfer in the study of cancer pathways. Curr. Opin. Oncol. 15, 55–64. [DOI] [PubMed] [Google Scholar]
- Bartholomaus I.; Milan-Lobo L.; Nicke A.; Dutertre S.; Hastrup H.; Jha A.; Gether U.; Sitte H. H.; Betz H.; Eulenburg V. (2008) Glycine transporter dimers: Evidence for occurrence in the plasma membrane. J. Biol. Chem. 283, 10978–10991. [DOI] [PMC free article] [PubMed] [Google Scholar]
- Thevenaz P.; Ruttimann U. E.; Unser M. (1998) A pyramid approach to subpixel registration based on intensity. IEEE Transactions on Image Processing 7, 27–41. [DOI] [PubMed] [Google Scholar]
- Feige J. N.; Sage D.; Wahli W.; Desvergne B.; Gelman L. (2005) PixFRET, an ImageJ plug-in for FRET calculation that can accommodate variations in spectral bleed-throughs. Microsc. Res. Tech. 68, 51–58. [DOI] [PubMed] [Google Scholar]
- Youvan D. C.; Silva C. M.; Bylina E. J.; Coleman W. J.; Dilworth M. R.; Yang M. M. (1997) Calibration of Fluorescence Resonance Energy Transfer in Microscopy Using Genetically GFP Derivatives on Nickel Chelating Beads. Biotechnology et alia 3, 1–18. [Google Scholar]
- Patterson G. H.; Piston D. W.; Barisas B. G. (2000) Forster distances between green fluorescent protein pairs. Anal. Biochem. 284, 438–440. [DOI] [PubMed] [Google Scholar]
- Aurora R.; Rose G. D. (1998) Helix capping. Protein Sci. 7, 21–38. [DOI] [PMC free article] [PubMed] [Google Scholar]
- Just H.; Sitte H. H.; Schmid J. A.; Freissmuth M.; Kudlacek O. (2004) Identification of an additional interaction domain in transmembrane domains 11 and 12 that supports oligomer formation in the human serotonin transporter. J. Biol. Chem. 279, 6650–6657. [DOI] [PubMed] [Google Scholar]
- Bulling S.; Schicker K.; Zhang Y. W.; Steinkellner T.; Stockner T.; Gruber C. W.; Boehm S.; Freissmuth M.; Rudnick G.; Sitte H. H. (2012) The Mechanistic Basis for Noncompetitive Ibogaine Inhibition of Serotonin and Dopamine Transporters. J. Biol. Chem. 287, 18524–18534. [DOI] [PMC free article] [PubMed] [Google Scholar]
- Schicker K.; Uzelac Z.; Gesmonde J.; Bulling S.; Stockner T.; Freissmuth M.; Boehm S.; Rudnick G.; Sitte H. H.; Sandtner W. (2012) Unifying concept of serotonin transporter-associated currents. J. Biol. Chem. 287, 438–445. [DOI] [PMC free article] [PubMed] [Google Scholar]
- Zhao Y.; Terry D.; Shi L.; Weinstein H.; Blanchard S. C.; Javitch J. A. (2010) Single-molecule dynamics of gating in a neurotransmitter transporter homologue. Nature 465, 188–193. [DOI] [PMC free article] [PubMed] [Google Scholar]
- Claxton D. P.; Quick M.; Shi L.; de Carvalho F. D.; Weinstein H.; Javitch J. A.; McHaourab H. S. (2010) Ion/substrate-dependent conformational dynamics of a bacterial homolog of neurotransmitter:sodium symporters. Nat. Struct. Mol. Biol. 1–9. [DOI] [PMC free article] [PubMed] [Google Scholar]
- Presta L. G.; Rose G. D. (1988) Helix signals in proteins. Science 240, 1632–1641. [DOI] [PubMed] [Google Scholar]
- Ray A.; Lindahl E.; Wallner B. (2012) Improved model quality assessment using ProQ2. BMC Bioinf. 13, 224. [DOI] [PMC free article] [PubMed] [Google Scholar]
- Kalman M.; Ben-Tal N. (2010) Quality assessment of protein model-structures using evolutionary conservation. Bioinformatics 26, 1299–1307. [DOI] [PMC free article] [PubMed] [Google Scholar]
- Kniazeff J.; Shi L.; Loland C. J.; Javitch J. A.; Weinstein H.; Gether U. (2008) An intracellular interaction network regulates conformational transitions in the dopamine transporter. J. Biol. Chem. 283, 17691–17701. [DOI] [PMC free article] [PubMed] [Google Scholar]
- El-Kasaby A.; Just H.; Malle E.; Stolt-Bergner P. C.; Sitte H. H.; Freissmuth M.; Kudlacek O. (2010) Mutations in the carboxyl-terminal SEC24 binding motif of the serotonin transporter impair folding of the transporter. J. Biol. Chem. 285, 39201–39210. [DOI] [PMC free article] [PubMed] [Google Scholar]
- Samuvel D. J.; Jayanthi L. D.; Bhat N. R.; Ramamoorthy S. (2005) A role for p38 mitogen-activated protein kinase in the regulation of the serotonin transporter: Evidence for distinct cellular mechanisms involved in transporter surface expression. J. Neurosci. 25, 29–41. [DOI] [PMC free article] [PubMed] [Google Scholar]
- Jayanthi L. D.; Samuvel D. J.; Blakely R. D.; Ramamoorthy S. (2005) Evidence for biphasic effects of protein kinase C on serotonin transporter function, endocytosis, and phosphorylation. Mol. Pharmacol. 67, 2077–2087. [DOI] [PubMed] [Google Scholar]
- Ramamoorthy S.; Blakely R. D. (1999) Phosphorylation and sequestration of serotonin transporters differentially modulated by psychostimulants. Science 285, 763–766. [DOI] [PubMed] [Google Scholar]
- Ramamoorthy S.; Giovanetti E.; Qian Y.; Blakely R. D. (1998) Phosphorylation and regulation of antidepressant-sensitive serotonin transporters. J. Biol. Chem. 273, 2458–2466. [DOI] [PubMed] [Google Scholar]
- Carneiro A. M.; Blakely R. D. (2006) Serotonin-, protein kinase C-, and Hic-5-associated redistribution of the platelet serotonin transporter. J. Biol. Chem. 281, 24769–24780. [DOI] [PMC free article] [PubMed] [Google Scholar]
- Hillier B. J.; Christopherson K. S.; Prehoda K. E.; Bredt D. S.; Lim W. A. (1999) Unexpected modes of PDZ domain scaffolding revealed by structure of nNOS-syntrophin complex. Science 284, 812–815. [PubMed] [Google Scholar]
- Ramamoorthy S.; Bauman A. L.; Moore K. R.; Han H.; Yang-Feng T.; Chang A. S.; Ganapathy V.; Blakely R. D. (1993) Antidepressant- and cocaine-sensitive human serotonin transporter: Molecular cloning, expression, and chromosomal localization. Proc. Natl. Acad. Sci. U.S.A. 90, 2542–2546. [DOI] [PMC free article] [PubMed] [Google Scholar]
- Misura K. M. S. (2001) Crystal Structure and Biophysical Properties of a Complex between the N-terminal SNARE Region of SNAP25 and Syntaxin 1a. J. Biol. Chem. 276, 41301–41309. [DOI] [PubMed] [Google Scholar]
Associated Data
This section collects any data citations, data availability statements, or supplementary materials included in this article.