

Abstract
Na+-glucose cotransporter 1 (SGLT1)-mediated glucose uptake leads to activation of Na+-H+ exchanger 3 (NHE3) in the intestine by a process that is not dependent on glucose metabolism. This coactivation may be important for postprandial nutrient uptake. However, it remains to be determined whether SGLT-mediated glucose uptake regulates NHE3-mediated NaHCO3 reabsorption in the renal proximal tubule. Considering that this nephron segment also expresses SGLT2 and that the kidneys and intestine show significant variations in daily glucose availability, the goal of this study was to determine the effect of SGLT-mediated glucose uptake on NHE3 activity in the renal proximal tubule. Stationary in vivo microperfusion experiments showed that luminal perfusion with 5 mM glucose stimulates NHE3-mediated bicarbonate reabsorption. This stimulatory effect was mediated by glycolytic metabolism but not through ATP production. Conversely, luminal perfusion with 40 mM glucose inhibited NHE3 because of cell swelling. Notably, pharmacologic inhibition of SGLT activity by Phlorizin produced a marked inhibition of NHE3, even in the absence of glucose. Furthermore, immunofluorescence experiments showed that NHE3 colocalizes with SGLT2 but not SGLT1 in the rat renal proximal tubule. Collectively, these findings show that glucose exerts a bimodal effect on NHE3. The physiologic metabolism of glucose stimulates NHE3 transport activity, whereas, supraphysiologic glucose concentrations inhibit this exchanger. Additionally, Phlorizin-sensitive SGLT transporters and NHE3 interact functionally in the proximal tubule.
The kidney proximal tubule (PT) is the site where the reabsorption of approximately 70% of filtered sodium bicarbonate occurs. It is mainly performed by the Na+/H+ exchanger isoform 3 (NHE3).1 The physiologic importance of NHE3 became evident after the development of NHE3 knockout mice, which presented mild metabolic acidosis and volume depletion with reduced BP, underscoring the role of NHE3 in volume homeostasis.2
It has been shown that NHE3 physically and functionally interacts with dipeptidyl-peptidase IV, an enzyme that degrades and inactivates the incretin hormone glucagon like peptide-1.3 The inhibition of dipeptidyl-peptidase IV and the action of glucagon like peptide-1 were shown to inhibit NHE3 and promote natriuresis.3–8 Additionally, various conditions and substances related to glucose metabolism, including diabetes, insulin, ATP, and glucose, modulate NHE3 in different tissues, showing a close relationship between carbohydrate homeostasis and NHE3 activity.9–12
Plasma glucose concentration is maintained at a constant level by a complex system, in which the kidneys perform a pivotal role by reabsorbing all the filtered glucose in the PT.13 In addition, the kidneys and liver are the only organs that express the glucose-6-phosphatase enzyme, thus enabling them to perform gluconeogenesis.14,15 This enzyme is only expressed in the PT,16 highlighting the importance of this kidney segment in carbohydrate metabolism.
It has been shown that the kidneys metabolize 20% of the glucose consumed in a meal.14 The PT has a low expression of hexokinase but the highest concentration and activity of glucose-6-phosphate dehydrogenase, indicating that this segment is able to metabolize glucose.16,17 However, it is currently believed that the PT uses noncarbohydrate compounds as energy sources.17
With relation to glucose uptake, the majority of filtered glucose is reabsorbed by the low-affinity, high-capacity sodium-glucose cotransporter isoform 2 (SGLT2). Some glucose is also reabsorbed by the high-affinity, low-capacity sodium-glucose cotransporter isoform 1 (SGLT1).13 Recently, SGLT2 inhibitors have been approved for the treatment of hyperglycemia in diabetic patients. The use of these inhibitors has been shown to decrease blood glucose, glycated hemoglobin, postprandial glucose, insulinemia, and body weight.18–20
The role of glucose uptake in the modulation of NHE3 activity in the small intestine has been extensively studied. Experiments have shown that glucose uptake through SGLT1 promotes intracellular NHE3-dependent alkalinization.21–26 However, functional differences between intestinal and renal NaHCO3 NHE3-mediated reabsorption have not been established. These two systems differ physiologically, because the gastrointestinal system is exposed to fluctuations in glucose concentration between the periods of fasting and after meals.13 The presence of large amounts of solutes within the intestinal cells after meals modulates membrane transporters, such as glucose transporter 2 (GLUT2) and NHE3,21,27 an important process for nutrient absorption.
Although the synergistic activation between SGLT1 and NHE3 has been observed in the intestine,21 it is not known if this process also occurs in the kidneys. Considering that the kidneys also express SGLT2 and the particularities of glucose availability in this organ, the goal of the present work was to determine the effect of glucose and SGLT activity on NHE3 in the renal PT.
Results
Glucose Modulates NHE3-Dependent JHCO3− in the Renal PT
As an initial approach to study the effect of glucose on NHE3-mediated bicarbonate reabsorption, Wistar rats were subjected to stationary microperfusion in vivo, and their PTs were perfused with solutions containing different concentrations of glucose or a control solution (CTRL; solution without any transported sugar) (Concise Methods).
As shown in Figure 1A, the rate of bicarbonate flux (JHCO3−) in the PTs perfused with 5 mM glucose (GLU) was significantly higher than in CTRL-perfused tubules (1.903±0.083 versus 2.779±0.093 nmol/cm2 per second). A progressive inhibition of JHCO3− was found after the perfusion of higher glucose concentrations (1.125±0.13 and 1.25±0.16 nmol/cm2 per second for GLU40 and GLU60, respectively). Because the stimulatory effect was observed only on perfusion of GLU5 and the maximum inhibitory effect occurred on GLU40 perfusion, these concentrations were used in all the following experiments. Representative curves of pH changes are given in Supplemental Figure 1.
Figure 1.

Proximal tubule NHE3-mediated HCO3− reabsorption (JHCO3−) is modulated by glucose. JHCO3− was evaluated by means of in vivo stationary microperfusion, and the continuous measurement of luminal pH was performed according to the protocol described in Concise Methods. (A) Rat kidney proximal tubules were perfused with CTRL, GLU5, GLU20, GLU40, or GLU60. The data are the means±SEMs. *P<0.001 versus CTRL; **P<0.001 versus CTRL; #P<0.001 versus GLU5; &P<0.001 versus GLU20. (B) The tubules were perfused with CTRL, GLU5, or GLU40 in the presence (+S3226) or absence (alone) of the specific NHE3 inhibitor S3226 (10 μM). The data are means±SEMs. The numbers of perfused tubules are indicated in the bars. *P<0.01 versus CTRL.
To confirm that the glucose-dependent JHCO3− modulation was NHE3-dependent, we performed experiments in the presence of the specific NHE3 inhibitor S3226.28 The addition of 10 μM S3226 markedly inhibited JHCO3− in all groups (from 1.903±0.083 to 0.701±0.041 nmol/cm2 per second in CTRL; from 2.779±0.094 to 0.521±0.070 nmol/cm2 per second in GLU5; from 1.125±0.130 to 0.538±0.069 nmol/cm2 per second in GLU40) (Figure 1B). The S3226-insensitive bicarbonate reabsorption component was equivalent among all different groups, indicating that NHE3 is the only H+ transporter in the PT that is modulated by glucose.
The Glucose-Dependent Stimulatory Effect on NHE3 Occurs through Glucose Metabolism
To evaluate whether the glucose-dependent, NHE3-mediated JHCO3− modulation was caused by the intrinsic properties of glucose, we performed a set of experiments, in which glucose was replaced by galactose. The perfusion of different galactose concentrations failed to modulate NHE3 activity (Figure 2A).
Figure 2.

Glucose-dependent NHE3 stimulation is dependent on glucose metabolism. The rate of bicarbonate reabsorption was evaluated by stationary microperfusion and expressed as JHCO3−. The dotted horizontal lines indicate JHCO3− in GLU5- and GLU40-perfused tubules. (A) The experiments were performed in the presence of CTRL or galactose (GALAC; 5 and 40 mM), a C-4 epimer of glucose. (B) The tubules were perfused with CTRL or α-MG (5 and 40 mM), a nonmetabolizable glucose analog. (C) The experiments were conducted in the presence of CTRL or GLU5 alone or with 2-DG (10 mM), a hexokinase inhibitor. (D) PTs were perfused with glucose-free solution or GLU5 plus 2-DG in the presence or absence of 10 mM l-alanine alone or with 500 μM 7M DL-cycloserine, an alanine aminotransferase inhibitor. The numbers of perfused tubules are indicated above the bars. The data are the means±SEMs. *P<0.001 versus CTRL; #P<0.001 versus GLU5; ##P<0.01 versus GLU5.
Because galactose is metabolized by galactokinase, an enzyme with expression and activity that decrease after weaning,29 we postulated that differences in the metabolism of glucose and galactose could be responsible for the differences in NHE3 modulation in the PT. To test this hypothesis, we performed experiments in which the nonmetabolizable glucose analog, α-methyl-d-glucopiranoside (α-MG), was perfused in the tubules.
As depicted in Figure 2B, α-MG5 was not able to stimulate NHE3. This result suggests that glucose metabolism is required for 5 mM glucose-dependent NHE3 stimulation. However, α-MG40 produced an inhibitory effect on NHE3 similar to the effect produced by GLU40, showing that the glucose inhibitory effect occurs by a metabolically independent mechanism (1.113±0.10 nmol/cm2 per second for α-MG40 versus 1.903±0.083 nmol/cm2 per second for CTRL).
To evaluate if the mechanism by which GLU5 stimulates NHE3 was by ATP generation, we analyzed if another substrate capable of generating ATP was able to mimic the stimulatory effect of glucose on NHE3. We then performed experiments in which the PTs were perfused with amino acids that can be metabolically converted into ATP by specific aminotransferases highly expressed in the kidney.30 Perfusion of 10 mM isoleucine, alanine, or aspartate failed to stimulate NHE3 (data not shown), indicating that ATP generation is not the final step responsible for the stimulatory effect observed on GLU5 perfusion.
To determine the role of glucose metabolism on NHE3 activity, we performed experiments in which the PTs were perfused with CTRL and GLU5 alone or together with 10 mM 2-deoxy-d-glucose (2-DG), a hexokinase inhibitor. Addition of 10 mM 2-DG to GLU5 not only abolished the stimulatory effect of GLU5 on NHE3 but also, produced an additional inhibitory effect that was also observed on the perfusion of CTRL+2-DG (JHCO3− from 1.903±0.083 to 1.289±0.054 nmol/cm2 per second for CTRL and from 2.779±0.094 to 1.143±0.073 nmol/cm2 per second for GLU5) (Figure 2C).
Because 2-DG can result in ATP depletion,31 we performed experiments, in which alanine alone or plus DL-cycloserine (an alanine aminotransferase inhibitor) was added to the 2-DG– or GLU5+2-DG–containing solution as an ATP source. Addition of 10 mM alanine abolished the 2-DG–dependent NHE3 inhibition in both the presence and absence of glucose (Figure 2D). The same effect was not observed in the presence of the alanine aminotransferase inhibitor DL-cycloserine, showing that alanine conversion into pyruvate is necessary to abolish the 2-DG–dependent NHE3 inhibition. Therefore, because the addition of alanine to the 2-DG+GLU5 solution did not produce a stimulatory effect, we confirmed that glucose metabolism is absolutely necessary for the NHE3 regulation, even after the addition of another source of energy.
High Glucose–Dependent NHE3 Inhibition Is Associated with Osmotic Stress
It is well established that SGLT1-mediated Na+-glucose uptake promotes cell swelling.32 As such, although all the buffers used in this study were osmotically balanced, an increase in cell volume associated with SGLT-mediated glucose uptake was expected. To determine if cell swelling was associated with NHE3 inhibition in the PT, we performed experiments under hypotonic conditions (250 mOsM/kg H2O). The perfusion of the hypotonic solution inhibited JHCO3− to the same extent as GLU40 (Figure 3A, dotted horizontal line). This result shows that the cell swelling promoted by hypotonic shock inhibits NHE3 in the PT.
Figure 3.

High glucose-dependent NHE3 inhibition in the proximal tubule is caused by osmotic stress. (A) JHCO3− was measured under hypotonic conditions (250 mOsM/kg H2O). For comparison, the dotted horizontal line indicates JHCO3− in GLU40-perfused tubules. *P<0.001 versus CTRL. (B) The tubules were perfused with CTRL, GLU40, or α-MG40 alone or together with mannitol (40 mM). The dotted horizontal line indicates JHCO3− in GLU5-perfused tubules. The data are means±SEMs. The numbers of perfused tubules are indicated in the bars. *P<0.05 versus CTRL; **P<0.01 versus CTRL; ***P<0.001 versus CTRL.
To confirm that the GLU40-inhibitory effect was caused by cell swelling, we conducted experiments, in which 40 mM mannitol, a nonpermeable and osmotically active substance that remains in the lumen after perfusion (thus producing an opposite osmotic effect) (Supplemental Figure 2), was added to the GLU40 solution.
As depicted in Figure 3B, the addition of 40 mM mannitol to CTRL produced a slight inhibition of JHCO3−. Conversely, the addition of 40 mM mannitol to GLU40 completely abolished the high glucose-dependent inhibitory effect on NHE3 and produced a stimulatory effect similar to the effect observed on GLU5 perfusion (Figure 3B, horizontal dotted line) (JHCO3− of 2.802±0.216 nmol/cm2 per second for GLU40+40 mM mannitol). As shown earlier, α-MG5 failed to mimic the stimulatory effect. Therefore, we conducted experiments where α-MG40 was perfused alone or together with 40 mM mannitol.
The addition of 40 mM mannitol to α-MG40 abolished the inhibitory effect of α-MG40 on NHE3 (1.113±0.106 versus 1.726±0.119 nmol/cm2 per second) but was not able to produce a stimulatory effect. This finding further confirms that the stimulatory effect of glucose on NHE3 transport activity is dependent on glucose metabolism.
SGLTs Inhibition by Phlorizin Impairs NHE3-Dependent JHCO3−
To verify the effect of SGLTs on NHE3, we used the SGLT competitive inhibitor, Phlorizin (Plz). Because of the high variability of Plz concentrations used in different reports21,25,33,34 and because of the fact that SGLTs are able to perform the electrogenic Na+ uptake in the absence of a sugar,35 we initially performed a Plz dose-response curve starting with the CTRL solution (absence of glucose).
As illustrated in Figure 4A, 10 μM Plz produced a significant decrease of JHCO3− (to 1.388±0.1283 nmol/cm2 per second versus CTRL) (Figure 4A, vertical dotted line). The perfusion of higher Plz concentrations caused progressive decreases of JHCO3− with the most pronounced effect observed with 500 μM Plz.
Figure 4.

The SGLTs inhibitor, Plz, inhibits NHE3-dependent HCO3− reabsorption in the renal proximal tubule. The graphs show the dose–response curves obtained for Plz treatment under different conditions. (A) The tubules were perfused with control solution in the presence of Plz (5, 10, 50, 100, 500 μM, or 2 mM). The dotted horizontal lines indicate JHCO3− in GLU5- and GLU40-perfused tubules. (B) The experiments were performed in the presence of GLU5 instead of CTRL solution. The following concentrations of Plz were used: 50 μM, 500 μM, 1 mM, 2 mM, or 3 mM. The dotted horizontal lines indicate JHCO3− in CTRL- and GLU40-perfused tubules. (C) Plz was added to GLU40 solution in the following concentrations: 500 μM, 1 mM, or 2 mM. The dotted horizontal lines indicate JHCO3− in CTRL- and GLU5-perfused tubules. (D and E) The tubules were perfused with Plz (50 μM, 500 μM, or 1 mM) together with GALAC5 and α-MG5, respectively. The dotted horizontal lines indicate JHCO3− in CTRL-, GLU5-, and GLU40-perfused tubules. The dotted vertical lines indicate the concentration of Plz that significantly inhibited JHCO3−. aP<0.05 versus no Plz; bP<0.001 versus no Plz; cP<0.001 versus no Plz.
To establish whether Plz was capable of inhibiting NHE3 in the presence of a sugar, we performed a Plz dose-response curve with the GLU5 and GLU40 solutions. As depicted in Figure 4B, the addition of 1 mM Plz to the GLU5 solution caused an inhibition similar to the inhibition observed by the addition of 50 µM Plz to the CTRL solution. Because Plz is a competitive inhibitor, higher concentrations of the inhibitor were required to produce the same effect on NHE3 in the presence of glucose. However, the addition of Plz was not able to produce any additional inhibitory effect when used together with the GLU40 solution (Figure 4C).
Next, we examined the ability of Plz to inhibit JHCO3− in the presence of other sugars. For this purpose, we performed experiments with Plz and 5 mM galactose or α-MG5. The addition of 500 μM Plz to 5 mM galactose (Figure 4D, vertical dotted line) significantly inhibited NHE3-dependent JHCO3−. However, only the addition of a higher concentration of Plz (1 mM) to α-MG5 (Figure 4E, vertical dotted line) was able to significantly inhibit JHCO3−. Altogether, these results indicate that inhibition of SGLT activity by Plz also inhibits NHE3.
Systemic Administration of Plz Produces Bicarbonaturia
To test whether Plz increases HCO3− excretion when administered systemically, rats were treated with 0.4 mg/kg Plz by subcutaneous injection every 12 hours36,37 and placed in metabolic cages. The renal function and other parameters are depicted in Supplemental Table 1. As expected, Plz increased the absolute and fractional excretions of glucose (Figure 5, A and B). As depicted in Figure 5, C and D, Plz markedly increased urinary Na+ and HCO3− excretion (HCO3− excretion of 0.2985±0.023 and Na+ excretion of 0.1836±0.0304 in Plz treatment versus 0.1690±0.038 and 0.0911±0.0108 mmol/d per 100 g body wt, respectively, in vehicle) (Figure 5, C and D, *P<0.05) compared with controls. These findings are in accordance with our microperfusion data, showing that both systemic and local administrations of Plz inhibit NHE3 activity in the PT.
Figure 5.

Acute systemic administration of Plz increases Na+ and HCO3− urinary excretion. Wistar rats were placed in metabolic cages for 24-hour urine collection during Plz (0.4 g/kg body wt every 12 hours) or vehicle treatment. After the 24-hour period, rats were decapitated, and a blood sample was collected. (A) Urinary glucose excretion (milligrams per day), (B) fractional excretion of glucose (%), (C) HCO3− excretion (millimoles per day/100 g body wt), and (D) Na+ excretion (millimoles per day/100 g body wt). Values are means±SEMs; n=7 rats/group. *P<0.05 versus vehicle. BW, body wt; N.D., not detectable.
SGLT2 Colocalizes with NHE3
Plz was able to inhibit NHE3, even in the absence of a sugar, indicating that SGLT-dependent Na+ uptake can modulate NHE3. Given the functional interaction between SGLTs and NHE3, we then hypothesized that these transporters might be located in the same microdomain within the PT brush border (BB) membrane. Thus, we performed immunofluorescence experiments to examine whether NHE3 colocalizes with SGLT1 and/or SGLT2.
As depicted in Figure 6, the expression of NHE3 (Figure 6A) and SGLT2 (Figure 6B) was restricted to the PT apical BB, and the merged image (Figure 6C) showed a considerable colocalization of these proteins. In contrast, the immunofluorescence staining of SGLT1 (Figure 6F) was more diffuse and could be detected at both BBs and in cytoplasm vesicles. Accordingly, the merged image of SGLT1 and NHE3 staining (Figure 6G) did not show a significant colocalization of these two proteins. These results suggest that the inhibition of NHE3 by Plz is most likely mediated by SGLT2.
Figure 6.

SGLT2, but not SGLT1, colocalizes with NHE3 in the renal proximal tubule. Kidney sections were obtained from adult rats. The kidney tissue was fixed, and the sections obtained were subjected to immunofluorescence staining with antibodies against NHE3, SGLT2, and SGLT1. The images were obtained using a Carl Zeiss confocal microscope. (A–C) SGLT2 (red) and NHE3 (green) staining were only present in the apical membrane of the proximal tubule. (C) The merged image shows the colocalization of SGLT2 and NHE3. (D) The merged staining images including the contrast phase channel of selected tubules and the nuclei staining (blue). (E–G) SGLT1 (red) staining was distributed diffusely in the proximal tubules, whereas NHE3 (green) was only detected in the apical membrane of the proximal tubule. (G) The merged image shows that SGLT1 does not colocalize with NHE3. (H) The contrast phase channel of selected tubules with the nuclei staining (blue).
Discussion
The present work shows that physiologic concentrations of glucose (5 mM) stimulate NHE3 transport activity by a process that is dependent on glycolytic metabolism. Higher glucose concentrations inhibit the transporter because of cell swelling. In addition, we showed that the inhibition of the SGLT-dependent Na+ uptake inhibits NHE3. Moreover, immunofluorescence experiments showed that NHE3 colocalizes with SGLT2 but not SGLT1. Figure 7 summarizes the major findings of the present work.
Figure 7.

Model of how physiological and supraphysiological concentrations of glucose modulate NHE3 activity in the renal PT. Perfused GLU enters the PT cell through SGLT1 and/or SGLT2. Intracellularly, it is metabolized by glucose metabolism through the action of hexokinase. Glucose metabolism stimulates the exchanger. The perfusion of supraphysiological concentrations of glucose (↑GLU) increases glucose uptake through SGLT2, the low-affinity, high-capacity glucose transporter, because the Km of this transporter is higher than the Km of physiological glucose concentration. Glucose uptake is known to be accompanied by water flow, and as such, glucose uptake promotes cell swelling and NHE3 inhibition. AQ, aquaporin.
With regard to the effects of glucose metabolism on NHE3, the results presented in this work are significantly different from the results reported in a previous study using the intestinal cell line CaCo-2.21 In this intestinal cell model, SGLT1-mediated Na+-glucose uptake led to NHE3-dependent cytoplasmic alkalinization that was not dependent on glucose metabolism. In contrast, we showed that glycolytic metabolism is necessary for the stimulatory effect of GLU5 on NHE3, because the perfusion of nonmetabolizable sugars did not produce the same stimulation and the addition of 2-DG to GLU5 abolished the stimulatory effect. The generation of intermediary compounds of glycolytic metabolism may be involved in this effect, because the generation of these compounds has been reported to modulate intracellular proteins.38
In agreement with our findings, some studies have shown that glucose metabolism modulates other members of the NHE family.9,31,39–44 These transporters have been shown to be inhibited by glycolytic inhibitors, such as 2-DG,9,45–47 and have also been observed to be more sensitive to glycolytic inhibitors than oxidative phosphorylation inhibitors.48–50 Additionally, our study suggests, for the first time, that the apical uptake of glucose is important for maintaining NHE3 activity, because glucose was perfused only apically in the tubules, and that glucose metabolism occurs in the PT and is important for maintaining NHE3 activity.
NHE3 can also be modulated by ATP, and it is believed that the ancillary proteins bound to the C-terminal tail of NHE3 are responsible for its modulation by ATP.41 Because alanine, a noncarbohydrate source of energy, was able to abolish the inhibitory effect produced by the perfusion of 2-DG only in the absence of DL-cycloserine (an alanine aminotransferase inhibitor), we can assume that (1) 2-DG perfusion produced ATP depletion, which has been observed previously,41 and (2) alanine is converted into pyruvate and can be used by the PT cells as an energy source. In addition, these data suggest that decreased glycolytic metabolism as well as ATP depletion might inhibit NHE3 in the PT.
Experiments conducted in absorptive epithelial cells and other heterologous systems have shown that SGLTs are capable of transporting water together with GLU.51–53 Thus, although all solutions used in this work were isotonic, cell swelling associated with SGLT-mediated glucose uptake was expected. In the present study, we found that hypotonic shock inhibits NHE3, supporting the hypothesis that the GLU40- or α-MG40–dependent inhibitory effect on NHE3 is caused by an increase in cell volume. The abolishment of this inhibitory effect by the addition of mannitol confirmed that the osmotic flow of water was responsible for the GLU40-dependent inhibitory effect on NHE3.
The NHE family members, especially the housekeeping isoforms, are involved in the control of cell volume. Therefore, cell swelling might induce NHE3 inhibition as a cell survival response, although NHE3 itself is not considered a housekeeping protein. Alternatively, an increase in cell volume could signal excessive sodium uptake, leading to the inhibition of this transporter to maintain volume homeostasis.
In the literature, there is no consensus regarding the effect of increased cell volume on NHE3 activity. Several studies have found that an increase in volume promotes NHE3 stimulation.54–57 However, other studies have found that the addition of an extracellular hypotonic solution inhibits or has no effect on NHE3.21,40,58 The differences in NHE3 activity caused by hypo-osmotic shock might be because of the involvement of different intermediaries responsible for NHE3 modulation.1,57,59,60
We showed that the pharmacological inhibition of SGLT by Plz is accompanied by marked NHE3 inhibition, indicating that SGLT activity plays a role in NHE3-dependent sodium bicarbonate reabsorption. Because the CTRL solution does not contain any transportable sugar, the NHE3 inhibition by Plz cannot be attributed to abolition of glucose uptake. In the absence of glucose, SGLT1 and SGLT2 are still able to produce currents, which are attributed to Na+ leak.35 Then, NHE3 inhibition by Plz might occur through dissipation of this transepithelial Na+ current. However, a direct action of Plz in the exchanger cannot be discarded.
Noteworthy, a recent report has shown that dapagliflozin, an SGLT2 inhibitor, promotes diuresis and reduces BP.18 Moreover, Plz prevents hypertension development in an experimental model of diabetes.61 Our results suggest that one possible mechanism by which dapagliflozin and Plz could induce diuresis and attenuate hypertension development is through NHE3 inhibition of Na+/HCO3− reabsorption.
As expected, acute systemic administration of Plz increases the fractional excretion of glucose. We have found that Plz-induced glicosuria is accompanied by natriuresis and bicarbonaturia. Interestingly, Plz also promoted an increase in GFR estimated by creatinine clearance. Although creatinine clearance may not be an optimal filtration marker in rodents, the effect of Plz on GFR has been previously shown in earlier studies, in which Plz was chronically administered to different animal models.62,63 Therefore, although the increase of urinary excretion of sodium bicarbonate induced by Plz may have a glomerular component, the differences of the magnitude of changes (35% increase of GFR and 87% and 100% increase of bicarbonate and sodium urinary excretion, respectively) allied with the microperfusion finding that intraluminal perfusion of Plz inhibits NHE3 activity strongly suggest that there is an important proximal tubular component responsible for the Plz-mediated sodium bicarbonate urinary loss.
Having defined a functional interaction between SGLT and NHE3, we next examined whether SGLT1 and/or SGLT2 are expressed in the same PT subcellular sites as NHE3. By immunostaining, we determined that, in adult rats, NHE3 and SGLT2 are localized in the apical membrane of PT and showed a clear colocalization. However, SGLT1 staining was not concordant with NHE3 staining. SGLT1 staining was observed in regions where NHE3 staining was not present, and its intracellular staining was observed in regions of strong apical NHE3 staining. Consistent with these findings, it has been shown that NHE3 is virtually absent in the PT S3 segment,64 the region with the highest expression of SGLT1. Additionally, although SGLT1 is expressed throughout the S1 and S2 segments of the PT, its location is markedly intracellular, whereas the localization of NHE3 is mostly apical.64,65
Having shown that SGLT2 and NHE3 colocalize in the rat renal PT, we hypothesized that these two transporters may be physically associated. Unfortunately, we were unable to validate this hypothesis, because all commercially available antibodies recognizing SGLT2 that we tested were not suitable for immunoprecipitation procedures (data not shown). Although the exact structural and functional features of the interaction of NHE3 and SGLT2 remain to be further characterized, our present data suggest that, because we could not find the apical colocalization of SGLT1 and NHE3, only SGLT2 inhibition is involved in NHE3 inhibition.
In summary, the findings of this study show a bimodal effect of glucose on NHE3 activity in the renal PT. The stimulatory effect of physiologic concentrations of glucose on NHE3 involves glucose metabolism by the glycolytic cascade, whereas the inhibitory effect of supraphysiological glucose concentrations involves the water influx caused by glucose uptake on high glucose perfusion. We also showed that SGLT2 colocalizes with NHE3 in the PT and that SGLT inhibition is accompanied by NHE3 inhibition. Furthermore, these results provide evidence that the inhibition of NHE3 is the mechanism by which SGLT2 inhibitors cause diuresis.
Concise Methods
Reagents and Antibodies
All chemicals were obtained from Sigma-Aldrich unless otherwise noted. S3226 was donated by Jurgen Punter (Sanofi-Aventis Deutschland GmbH, Frankfurt, Germany). Anti-SGLT2 polyclonal antibody and anti-NHE3 monoclonal antibody were obtained from Santa Cruz Biotechnology. Anti-SGLT1 polyclonal antibody was obtained from Abcam, Inc. Alexafluor-588 and AlexaFluor-488 secondary antibodies were obtained from Life Technologies.
Animal Protocols
Animal procedures and protocols followed the ethical principles in animal research of the Brazilian College of Animal Experimentation and were approved by the Institutional Animal Care and Use Committee. The experiments were performed using male Wistar rats (200–350 g) housed under standardized conditions of constant temperature of 22°C, 12:12-hour dark to light cycles, and relative humidity of 60% at the Institute of Biomedicine of the University of São Paulo animal facility. On the days of the experiment, the rats were anesthetized with ketamine-acepromazine (200 and 1.5 mg/kg intramuscularly, respectively) and Propofol (25 mg/kg intravenously as needed) and prepared for the stationary microperfusion experiments as described below.
Stationary Microperfusion Experiments
The animals were prepared for in vivo micropuncture as described previously.66 Supplemental Figure 3 represents a model for the technique. In this technique, a double-barreled micropipette was used to puncture a PT. One pipette barrel was filled with the experimental solutions (90 mM NaCl, 25 mM NaHCO3, 5 mM KCl, 1 mM CaCl2, and 1.2 mM MgSO4) stained with FDC green. The glucose concentrations of these solutions varied between 0 (CTRL) and 60 mM or were substituted with 5 or 40 mM galactose or α-MG. Another group was perfused with the same CTRL solution and the 5 mM glucose solution with 5 or 10 mM isoleucine or with 10 mM 2-DG alone or plus 10 mM isoleucine. The 40 mM glucose and 40 mM α-MG solution were also perfused together with 40 mM mannitol. The osmolality of solutions ranged from 250 (hypotonic) to 300 (adjusted with raffinose), up to 340 (hypertonic) mosM/kg H2O.
The other pipette barrel was filled with castor oil stained with Sudan black. The tubules were perfused with the abovementioned solutions depending on the experimental strategy, and the column of injected fluid was isolated from tubular and glomerular fluid and held stationary until the next perfusion by droplets of castor oil.
To measure the tubular pH, a double-barreled, asymmetric microelectrode was used. The larger barrel was silanized with hexamethyldisilazane (Sigma Fluka) and contained an H+ ion-sensitive ion exchange resin (Sigma Fluka). The smaller barrel contained 1 mM KCl colored by FDC green. The voltage, representing tubular H+ activity, was measured by the electrode by a WPI electrometer. The voltage was measured continuously and recorded by an analog to digital converter (Lynx). Luminal bicarbonate was calculated from luminal pH and arterial blood PCO2. The rate of tubular acidification was expressed as the half-time of the exponential reduction of the injected HCO3− concentration to its stationary level (t1/2). The net HCO3− reabsorption (JHCO3−) per centimeter2 of tubule epithelium was calculated using the following equation:
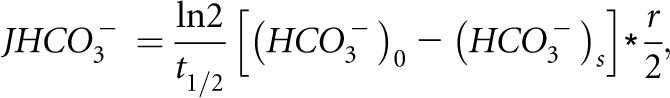 |
where t1/2 is the half-time of bicarbonate absorption, r is the tubule radius, and (HCO3−)0 and (HCO3−)s are the concentrations of the injected HCO3− and HCO3− at the stationary level, respectively. The value of N is the number of perfused tubules. Each experimental group was composed of at least three animals, and each animal had one to four proximal tubules perfused.
Acute Phlorizin Treatment
Male Wistar rats were placed in individual metabolic cages for the collection of urine samples, quantification of urine output, and food and water consumption. Animals were placed individually in a metabolic cage for a 48-hour period of adaptation. In the next 24-hour period, animals received Plz dissolved in a solution containing ethanol (2.5:1) in PBS injected subcutaneously at a dose of 0.4 g/kg two times (in 12-hour intervals) or vehicle. At the end of the period, animals were immediately decapitated, and blood samples were collected for analysis.
Renal Function Analysis
Urine and blood samples, collected in metabolic cages, were used to measure urine output, HCO3− excretion, plasma glucose, glucose excretion, fractional glucose excretion, sodium excretion, potassium excretion, and GFR. Creatinine clearance was used to estimate GFR. Serum and urinary creatinine and glucose concentrations were measured by a kinetic method (Labtest) using a ThermoPlate Analyzer Plus (ThermoPlate). Sodium and potassium were measured on an electrolyte analyzer (Roche Diagnostic). Urine HCO3− was measured in a gasometer Radiometer ABL5 (Radiometer Medical).
Kidney Preparation for Immunohistochemistry
The animals were anesthetized as described above, and the kidneys of all animals were perfused with PBS at 37°C through the abdominal aorta for 10 minutes followed by periodate-lysine-paraformaldehyde perfusion fixation for 20 minutes. The kidneys were removed and immediately frozen in Tissue-Tek (Tissue-Tek OCT Compound) using liquid nitrogen.
Immunohistochemistry
The kidneys were frozen in Tissue-Tek and sectioned (6 µm) using a Cryostat (Microm HM 505E). After fixation in 4% paraformaldehyde, the sections were rehydrated in PBS for 5 minutes and incubated in 0.5% Triton X-100 solution for 10 minutes at room temperature and then, PBS containing 2% casein (Sigma-Aldrich) for 30 minutes to block nonspecific staining. The sections were incubated with an antiserum raised against NHE3 mouse monoclonal antibody and SGLT1 rabbit polyclonal antibody (diluted 1:50 and 1:25 in PBS containing 0.5% casein, respectively) or NHE3 and SGLT2 goat polyclonal antibody (1:25) overnight at 4°C in a humid chamber. This incubation was followed by four washes of 5 minutes each in PBS. The sections were then incubated for 90 minutes at room temperature with AlexaFluor-488–coupled anti-mouse antibody, AlexaFluor-555–coupled anti-rabbit antibody, and AlexaFluor-555–coupled anti-rabbit antibody at a final concentration of 1:500. The nuclei were stained with 20 µg/ml 4′,6-diamidino-2-phenylindole (Life Technologies). Negative control slides were incubated with secondary antibody alone (data not shown). The sections were washed in PBS and mounted in 50% glycerol solution diluted in PBS, and the images were captured using a Carl Zeiss 510 LMS confocal system connected to an Axiovert microscope.
Statistical Analyses
Statistical comparisons were made by paired t test by taking the probability of 0.05 (5%) as the limit of significance. When more than two groups were compared, a one-way ANOVA followed by Tukey’s post hoc test was used. For each group, a minimum of six tubules was analyzed (N=number of perfused tubules).
Disclosures
None.
Supplementary Material
Acknowledgments
The authors thank Nancy Amaral Rebouças for her helpful support.
This work was supported by Fundação de Amparo à Pesquisa do Estado de São Paulo Grants 2012/10146-0 (to A.C.C.G.) and 2008/58287-5 (to G.M.) and the Conselho Nacional de Desenvolvimento Científico e Tecnológico. T.D.P. was supported by a doctoral fellowship from FAPESP (2009/51772-8).
Footnotes
Published online ahead of print. Publication date available at www.jasn.org.
This article contains supplemental material online at http://jasn.asnjournals.org/lookup/suppl/doi:10.1681/ASN.2013060588/-/DCSupplemental.
References
- 1.Donowitz M, Li X: Regulatory binding partners and complexes of NHE3. Physiol Rev 87: 825–872, 2007 [DOI] [PubMed] [Google Scholar]
- 2.Schultheis PJ, Clarke LL, Meneton P, Miller ML, Soleimani M, Gawenis LR, Riddle TM, Duffy JJ, Doetschman T, Wang T, Giebisch G, Aronson PS, Lorenz JN, Shull GE: Renal and intestinal absorptive defects in mice lacking the NHE3 Na+/H+ exchanger. Nat Genet 19: 282–285, 1998 [DOI] [PubMed] [Google Scholar]
- 3.Girardi AC, Degray BC, Nagy T, Biemesderfer D, Aronson PS: Association of Na(+)-H(+) exchanger isoform NHE3 and dipeptidyl peptidase IV in the renal proximal tubule. J Biol Chem 276: 46671–46677, 2001 [DOI] [PubMed] [Google Scholar]
- 4.Girardi AC, Fukuda LE, Rossoni LV, Malnic G, Reboucas NA: Dipeptidyl peptidase IV inhibition downregulates Na+ - H+ exchanger NHE3 in rat renal proximal tubule. Am J Physiol Renal Physiol 294: F414–F422, 2008 [DOI] [PubMed] [Google Scholar]
- 5.Girardi AC, Knauf F, Demuth HU, Aronson PS: Role of dipeptidyl peptidase IV in regulating activity of Na+/H+ exchanger isoform NHE3 in proximal tubule cells. Am J Physiol Cell Physiol 287: C1238–C1245, 2004 [DOI] [PubMed] [Google Scholar]
- 6.Pacheco BP, Crajoinas RO, Couto GK, Davel AP, Lessa LM, Rossoni LV, Girardi AC: Dipeptidyl peptidase IV inhibition attenuates blood pressure rising in young spontaneously hypertensive rats. J Hypertens 29: 520–528, 2011 [DOI] [PubMed] [Google Scholar]
- 7.Crajoinas RO, Oricchio FT, Pessoa TD, Pacheco BP, Lessa LM, Malnic G, Girardi AC: Mechanisms mediating the diuretic and natriuretic actions of the incretin hormone glucagon-like peptide-1. Am J Physiol Renal Physiol 301: F355–F363, 2011 [DOI] [PubMed] [Google Scholar]
- 8.Rieg T, Gerasimova M, Murray F, Masuda T, Tang T, Rose M, Drucker DJ, Vallon V: Natriuretic effect by exendin-4, but not the DPP-4 inhibitor alogliptin, is mediated via the GLP-1 receptor and preserved in obese type 2 diabetic mice. Am J Physiol Renal Physiol 303: F963–F971, 2012 [DOI] [PMC free article] [PubMed] [Google Scholar]
- 9.Cassel D, Katz M, Rotman M: Depletion of cellular ATP inhibits Na+/H+ antiport in cultured human cells. Modulation of the regulatory effect of intracellular protons on the antiporter activity. J Biol Chem 261: 5460–5466, 1986 [PubMed] [Google Scholar]
- 10.Fuster DG, Bobulescu IA, Zhang J, Wade J, Moe OW: Characterization of the regulation of renal Na+/H+ exchanger NHE3 by insulin. Am J Physiol Renal Physiol 292: F577–F585, 2007 [DOI] [PMC free article] [PubMed] [Google Scholar]
- 11.Klisic J, Nief V, Reyes L, Ambuhl PM: Acute and chronic regulation of the renal Na/H+ exchanger NHE3 in rats with STZ-induced diabetes mellitus. Nephron Physiol 102: 27–35, 2006 [DOI] [PubMed] [Google Scholar]
- 12.Dhar-Chowdhury P, Malester B, Rajacic P, Coetzee WA: The regulation of ion channels and transporters by glycolytically derived ATP. Cell Mol Life Sci 64: 3069–3083, 2007 [DOI] [PMC free article] [PubMed] [Google Scholar]
- 13.Vallon V: Molecular determinants of renal glucose reabsorption. Focus on “Glucose transport by human renal Na+/D-glucose cotransporters SGLT1 and SGLT2.” Am J Physiol Cell Physiol 300: C6–C8, 2011 [DOI] [PMC free article] [PubMed] [Google Scholar]
- 14.Stumvoll M, Meyer C, Mitrakou A, Gerich JE: Important role of the kidney in human carbohydrate metabolism. Med Hypotheses 52: 363–366, 1999 [DOI] [PubMed] [Google Scholar]
- 15.Stumvoll M, Perriello G, Meyer C, Gerich J: Role of glutamine in human carbohydrate metabolism in kidney and other tissues. Kidney Int 55: 778–792, 1999 [DOI] [PubMed] [Google Scholar]
- 16.Guder WG, Ross BD: Enzyme distribution along the nephron. Kidney Int 26: 101–111, 1984 [DOI] [PubMed] [Google Scholar]
- 17.Lawrence GM, Jepson MA, Trayer IP, Walker DG: The compartmentation of glycolytic and gluconeogenic enzymes in rat kidney and liver and its significance to renal and hepatic metabolism. Histochem J 18: 45–53, 1986 [DOI] [PubMed] [Google Scholar]
- 18.Lambers Heerspink HJ, de Zeeuw D, Wie L, Leslie B, List J: Dapagliflozin a glucose-regulating drug with diuretic properties in subjects with type 2 diabetes. Diabetes Obes Metab 15: 853–862, 2013 [DOI] [PMC free article] [PubMed] [Google Scholar]
- 19.Polidori D, Sha S, Mudaliar S, Ciaraldi TP, Ghosh A, Vaccaro N, Farrell K, Rothenberg P, Henry RR: Canagliflozin lowers postprandial glucose and insulin by delaying intestinal glucose absorption in addition to increasing urinary glucose excretion: Results of a randomized, placebo-controlled study. Diabetes Care 36: 2154–2161, 2013 [DOI] [PMC free article] [PubMed] [Google Scholar]
- 20.Raskin P: Sodium-glucose cotransporter inhibition: Therapeutic potential for the treatment of type 2 diabetes mellitus. Diabetes Metab Res Rev 29: 347–356, 2013 [DOI] [PubMed] [Google Scholar]
- 21.Turner JR, Black ED: NHE3-dependent cytoplasmic alkalinization is triggered by Na(+)-glucose cotransport in intestinal epithelia. Am J Physiol Cell Physiol 281: C1533–C1541, 2001 [DOI] [PubMed] [Google Scholar]
- 22.Zhao H, Shiue H, Palkon S, Wang Y, Cullinan P, Burkhardt JK, Musch MW, Chang EB, Turner JR: Ezrin regulates NHE3 translocation and activation after Na+-glucose cotransport. Proc Natl Acad Sci U S A 101: 9485–9490, 2004 [DOI] [PMC free article] [PubMed] [Google Scholar]
- 23.Hu Z, Wang Y, Graham WV, Su L, Musch MW, Turner JR: MAPKAPK-2 is a critical signaling intermediate in NHE3 activation following Na+-glucose cotransport. J Biol Chem 281: 24247–24253, 2006 [DOI] [PubMed] [Google Scholar]
- 24.Shiue H, Musch MW, Wang Y, Chang EB, Turner JR: Akt2 phosphorylates ezrin to trigger NHE3 translocation and activation. J Biol Chem 280: 1688–1695, 2005 [DOI] [PMC free article] [PubMed] [Google Scholar]
- 25.Turner JR, Black ED, Ward J, Tse CM, Uchwat FA, Alli HA, Donowitz M, Madara JL, Angle JM: Transepithelial resistance can be regulated by the intestinal brush-border Na(+)/H(+) exchanger NHE3. Am J Physiol Cell Physiol 279: C1918–C1924, 2000 [DOI] [PubMed] [Google Scholar]
- 26.Lin R, Murtazina R, Cha B, Chakraborty M, Sarker R, Chen TE, Lin Z, Hogema BM, de Jonge HR, Seidler U, Turner JR, Li X, Kovbasnjuk O, Donowitz M: D-glucose acts via sodium/glucose cotransporter 1 to increase NHE3 in mouse jejunal brush border by a Na+/H+ exchange regulatory factor 2-dependent process. Gastroenterology 140: 560–571, 2011 [DOI] [PMC free article] [PubMed] [Google Scholar]
- 27.Kellett GL, Brot-Laroche E: Apical GLUT2: A major pathway of intestinal sugar absorption. Diabetes 54: 3056–3062, 2005 [DOI] [PubMed] [Google Scholar]
- 28.Schwark JR, Jansen HW, Lang HJ, Krick W, Burckhardt G, Hropot M: S3226, a novel inhibitor of Na+/H+ exchanger subtype 3 in various cell types. Pflugers Arch 436: 797–800, 1998 [DOI] [PubMed] [Google Scholar]
- 29.Cuatrecasas P, Segal S: Mammalian galactokinase. Developmental and adaptive characteristics in the rat liver. J Biol Chem 240: 2382–2388, 1965 [PubMed] [Google Scholar]
- 30.Burch HB, Cambon N, Lowry OH: Branched-chain amino acid aminotransferase along the rabbit and rat nephron. Kidney Int 28: 114–117, 1985 [DOI] [PubMed] [Google Scholar]
- 31.Goss GG, Woodside M, Wakabayashi S, Pouyssegur J, Waddell T, Downey GP, Grinstein S: ATP dependence of NHE-1, the ubiquitous isoform of the Na+/H+ antiporter. Analysis of phosphorylation and subcellular localization. J Biol Chem 269: 8741–8748, 1994 [PubMed] [Google Scholar]
- 32.MacLeod RJ, Hamilton JR: Volume regulation initiated by Na(+)-nutrient cotransport in isolated mammalian villus enterocytes. Am J Physiol 260: G26–G33, 1991 [DOI] [PubMed] [Google Scholar]
- 33.Mackenzie B, Loo DD, Panayotova-Heiermann M, Wright EM: Biophysical characteristics of the pig kidney Na+/glucose cotransporter SGLT2 reveal a common mechanism for SGLT1 and SGLT2. J Biol Chem 271: 32678–32683, 1996 [DOI] [PubMed] [Google Scholar]
- 34.Hummel CS, Lu C, Liu J, Ghezzi C, Hirayama BA, Loo DD, Kepe V, Barrio JR, Wright EM: Structural selectivity of human SGLT inhibitors. Am J Physiol Cell Physiol 302: C373–C382, 2012 [DOI] [PMC free article] [PubMed] [Google Scholar]
- 35.Wright EM, Turk E: The sodium/glucose cotransport family SLC5. Pflugers Arch 447: 510–518, 2004 [DOI] [PubMed] [Google Scholar]
- 36.Malatiali S, Francis I, Barac-Nieto M: Phlorizin prevents glomerular hyperfiltration but not hypertrophy in diabetic rats. Exp Diabetes Res 2008: 305403, 2008 [DOI] [PMC free article] [PubMed] [Google Scholar]
- 37.Rastogi KS, Cooper RL, Shi ZQ, Vranic M: Quantitative measurement of islet glucagon response to hypoglycemia by confocal fluorescence imaging in diabetic rats: Effects of phlorizin treatment. Endocrine 7: 367–375, 1997 [DOI] [PubMed] [Google Scholar]
- 38.Obrosova I, Faller A, Burgan J, Ostrow E, Williamson JR: Glycolytic pathway, redox state of NAD(P)-couples and energy metabolism in lens in galactose-fed rats: Effect of an aldose reductase inhibitor. Curr Eye Res 16: 34–43, 1997 [DOI] [PubMed] [Google Scholar]
- 39.Demaurex N, Grinstein S: Na+/H+ antiport: Modulation by ATP and role in cell volume regulation. J Exp Biol 196: 389–404, 1994 [DOI] [PubMed] [Google Scholar]
- 40.Kapus A, Grinstein S, Wasan S, Kandasamy R, Orlowski J: Functional characterization of three isoforms of the Na+/H+ exchanger stably expressed in Chinese hamster ovary cells. ATP dependence, osmotic sensitivity, and role in cell proliferation. J Biol Chem 269: 23544–23552, 1994 [PubMed] [Google Scholar]
- 41.Aharonovitz O, Demaurex N, Woodside M, Grinstein S: ATP dependence is not an intrinsic property of Na+/H+ exchanger NHE1: Requirement for an ancillary factor. Am J Physiol 276: C1303–C1311, 1999 [DOI] [PubMed] [Google Scholar]
- 42.Burns KD, Homma T, Harris RC: Regulation of Na(+)-H+ exchange by ATP depletion and calmodulin antagonism in renal epithelial cells. Am J Physiol 261: F607–F616, 1991 [DOI] [PubMed] [Google Scholar]
- 43.Levine SA, Montrose MH, Tse CM, Donowitz M: Kinetics and regulation of three cloned mammalian Na+/H+ exchangers stably expressed in a fibroblast cell line. J Biol Chem 268: 25527–25535, 1993 [PubMed] [Google Scholar]
- 44.Demaurex N, Romanek RR, Orlowski J, Grinstein S: ATP dependence of Na+/H+ exchange. Nucleotide specificity and assessment of the role of phospholipids. J Gen Physiol 109: 117–128, 1997 [DOI] [PMC free article] [PubMed] [Google Scholar]
- 45.Weissberg PL, Little PJ, Cragoe EJ, Jr., Bobik A: The pH of spontaneously beating cultured rat heart cells is regulated by an ATP-calmodulin-dependent Na+/H+ antiport. Circ Res 64: 676–685, 1989 [DOI] [PubMed] [Google Scholar]
- 46.Little PJ, Weissberg PL, Cragoe EJ, Jr., Bobik A: Dependence of Na+/H+ antiport activation in cultured rat aortic smooth muscle on calmodulin, calcium, and ATP. Evidence for the involvement of calmodulin-dependent kinases. J Biol Chem 263: 16780–16786, 1988 [PubMed] [Google Scholar]
- 47.Brown SE, Heming TA, Benedict CR, Bidani A: ATP-sensitive Na(+)-H+ antiport in type II alveolar epithelial cells. Am J Physiol 261: C954–C963, 1991 [DOI] [PubMed] [Google Scholar]
- 48.Wu ML, Vaughan-Jones RD: Effect of metabolic inhibitors and second messengers upon Na(+)-H+ exchange in the sheep cardiac Purkinje fibre. J Physiol 478: 301–313, 1994 [DOI] [PMC free article] [PubMed] [Google Scholar]
- 49.Satoh H, Sugiyama S, Nomura N, Terada H, Hayashi H: Importance of glycolytically derived ATP for Na+ loading via Na+/H+ exchange during metabolic inhibition in guinea pig ventricular myocytes. Clin Sci (Lond) 101: 243–251, 2001 [PubMed] [Google Scholar]
- 50.Sugiyama S, Satoh H, Nomura N, Terada H, Watanabe H, Hayashi H: The importance of glycolytically-derived ATP for the Na+/H+ exchange activity in guinea pig ventricular myocytes. Mol Cell Biochem 217: 153–161, 2001 [DOI] [PubMed] [Google Scholar]
- 51.Loo DD, Hirayama BA, Meinild AK, Chandy G, Zeuthen T, Wright EM: Passive water and ion transport by cotransporters. J Physiol 518: 195–202, 1999 [DOI] [PMC free article] [PubMed] [Google Scholar]
- 52.Zeuthen T, Meinild AK, Loo DD, Wright EM, Klaerke DA: Isotonic transport by the Na+-glucose cotransporter SGLT1 from humans and rabbit. J Physiol 531: 631–644, 2001 [DOI] [PMC free article] [PubMed] [Google Scholar]
- 53.Wright EM, Loo DD: Coupling between Na+, sugar, and water transport across the intestine. Ann N Y Acad Sci 915: 54–66, 2000 [DOI] [PubMed] [Google Scholar]
- 54.Good DW, Di Mari JF, Watts BA, III: Hyposmolality stimulates Na(+)/H(+) exchange and HCO(3)(-) absorption in thick ascending limb via PI 3-kinase. Am J Physiol Cell Physiol 279: C1443–C1454, 2000 [DOI] [PubMed] [Google Scholar]
- 55.Watts BA, III, Good DW: Hyposmolality stimulates apical membrane Na(+)/H(+) exchange and HCO(3)(-) absorption in renal thick ascending limb. J Clin Invest 104: 1593–1602, 1999 [DOI] [PMC free article] [PubMed] [Google Scholar]
- 56.Alexander RT, Malevanets A, Durkan AM, Kocinsky HS, Aronson PS, Orlowski J, Grinstein S: Membrane curvature alters the activation kinetics of the epithelial Na+/H+ exchanger, NHE3. J Biol Chem 282: 7376–7384, 2007 [DOI] [PubMed] [Google Scholar]
- 57.Hoffmann EK, Lambert IH, Pedersen SF: Physiology of cell volume regulation in vertebrates. Physiol Rev 89: 193–277, 2009 [DOI] [PubMed] [Google Scholar]
- 58.Su X, Pang T, Wakabayashi S, Shigekawa M: Evidence for involvement of the putative first extracellular loop in differential volume sensitivity of the Na+/H+ exchangers NHE1 and NHE2. Biochemistry 42: 1086–1094, 2003 [DOI] [PubMed] [Google Scholar]
- 59.Donowitz M, Mohan S, Zhu CX, Chen TE, Lin R, Cha B, Zachos NC, Murtazina R, Sarker R, Li X: NHE3 regulatory complexes. J Exp Biol 212: 1638–1646, 2009 [DOI] [PMC free article] [PubMed] [Google Scholar]
- 60.Donowitz M, Cha B, Zachos NC, Brett CL, Sharma A, Tse CM, Li X: NHERF family and NHE3 regulation. J Physiol 567: 3–11, 2005 [DOI] [PMC free article] [PubMed] [Google Scholar]
- 61.Osorio H, Bautista R, Rios A, Franco M, Arellano A, Vargas-Robles H, Romo E, Escalante B: Effect of phlorizin on SGLT2 expression in the kidney of diabetic rats. J Nephrol 23: 541–546, 2010 [PubMed] [Google Scholar]
- 62.Wang X, Zhang S, Liu Y, Spichtig D, Kapoor S, Koepsell H, Mohebbi N, Segerer S, Serra AL, Rodriguez D, Devuyst O, Mei C, Wuthrich RP: Targeting of sodium-glucose cotransporters with phlorizin inhibits polycystic kidney disease progression in Han:SPRD rats. Kidney Int 84: 962–968, 2013 [DOI] [PubMed] [Google Scholar]
- 63.Gouvea WL, Alpert HC, Kelley J, Pardo V, Vaamonde CA: Phlorizin-induced glycosuria does not prevent gentamicin nephrotoxicity in rats. Kidney Int 35: 1041–1048, 1989 [DOI] [PubMed] [Google Scholar]
- 64.Amemiya M, Loffing J, Lotscher M, Kaissling B, Alpern RJ, Moe OW: Expression of NHE-3 in the apical membrane of rat renal proximal tubule and thick ascending limb. Kidney Int 48: 1206–1215, 1995 [DOI] [PubMed] [Google Scholar]
- 65.Balen D, Ljubojevic M, Breljak D, Brzica H, Zlender V, Koepsell H, Sabolic I: Revised immunolocalization of the Na+-D-glucose cotransporter SGLT1 in rat organs with an improved antibody. Am J Physiol Cell Physiol 295: C475–C489, 2008 [DOI] [PubMed] [Google Scholar]
- 66.Lessa LM, Amorim JB, Fonteles MC, Malnic G: Effect of renoguanylin on hydrogen/bicarbonate ion transport in rat renal tubules. Regul Pept 157: 37–43, 2009 [DOI] [PubMed] [Google Scholar]
Associated Data
This section collects any data citations, data availability statements, or supplementary materials included in this article.