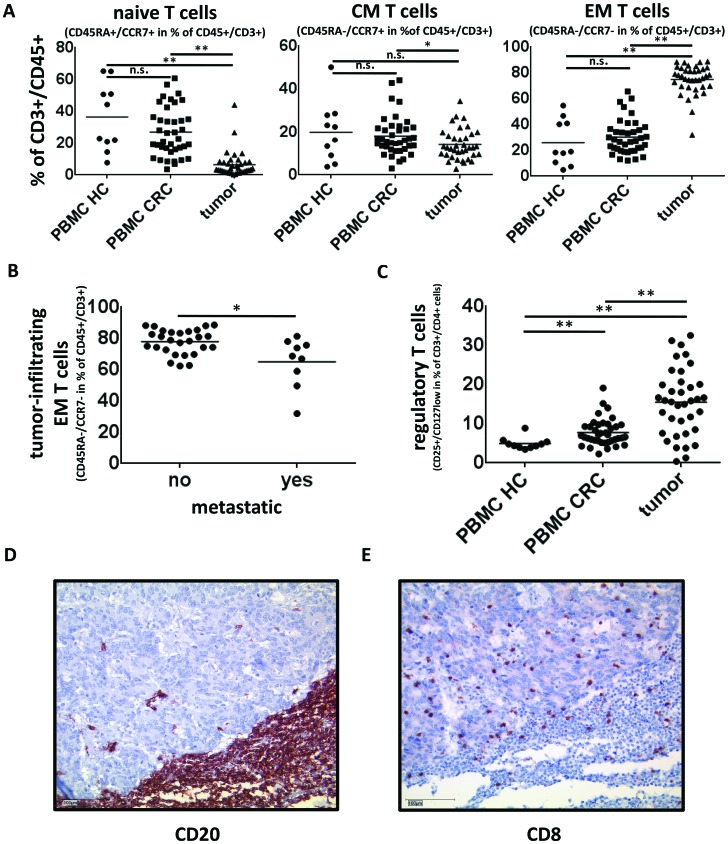
Figure 5. Tumor infiltrating T cells in colorectal cancer.
(A) Tumor infiltrating T cells are mainly of a CD45RA−CCR7− effector/memory (EM) phenotype (n=37) whereas PBMC of CRC patients (n=38) and healthy controls (n=10) contain predominantly naive (CD45RA+CCR7+) and central memory (CM) (CD45RA−CCR7+) T cells. (B) The percentage of CD45RA−CCR7− effector memory T cells in primary tumor samples is significantly reduced in Stage IV colorectal cancer (65% vs. 77,9%, p<0,05) (C) CD3+CD4+CD25+CD127low T cells which are known to contain a high percentage of FoxP3+ regulatory T cells are significantly elevated in tumor samples (n=38) compared to PBMC of CRC patients (n=39) and healthy controls (n=10) (15.5% of CD4+-Tcells in tumor samples compared to 7.8% and 5.0% respectively, p<0,005) (D,E) Immunohistochemical staining of CD20 and CD8 were performed to illustrate the intratumoral distribution of B and T cells. B cells were detectable throughout the whole tumor samples, but were predominantly localized in peritumoral tertiary lymphoid structures. Figure E highlights the infiltration of Colorectal Cancer by cytotoxic T cells and also demonstrates a colocalisation of cytotoxic T and B cells especially within the tertiary lymphoid structures. Sequential immunohistochemistries of CD8+-T cells and CD20+-B cells revealed similar colocalisations in 40% of the analyzed samples.

