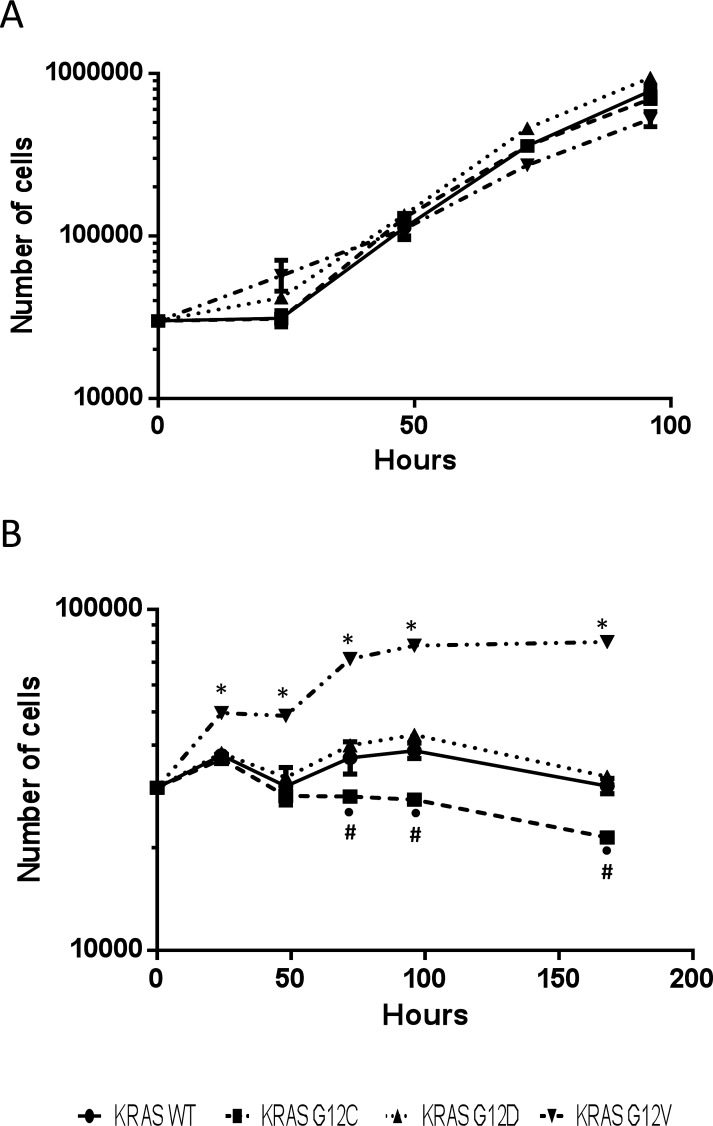
Figure 6.
Growth curves of H1299-derived KRAS overexpressing clones cultured with (A) or without (B) glutamine. Cells were cultured in six-well plates and counted 24, 48, 72, 96 and 168 hours after seeding using cell counter. Values are the mean and SD of three independent experiments. Asterisks mark significant differences (two-way ANOVA and Bonferroni post-test, p <0.001), •KRAS G12C vs KRAS WT; *KRAS G12V vs KRAS WT, KRAS G12C, KRAS G12D; #KRAS G12C vs KRAS G12D.

