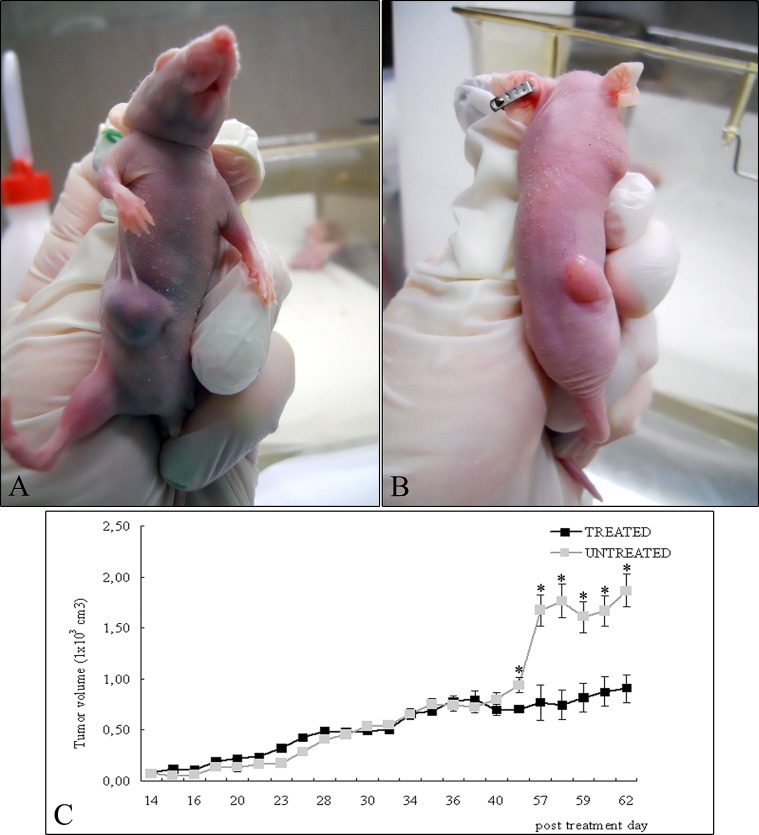
Figure 1. A549 cells were injected into the right flanks of nude mice and tumor size was serially measured until post treatment day 62.
(A) Representative photographs of xenograft tumors in situ were taken demonstrating increased A549 tumor size compared with the (B) treated tumors. (C) Over the time tumor volumes showed significant growth retardation in the treated group compared with untreated group (mean ± standard error of the mean; n=10). * p < 0.05 compared to untreated tumors.

